1. Executive Summary
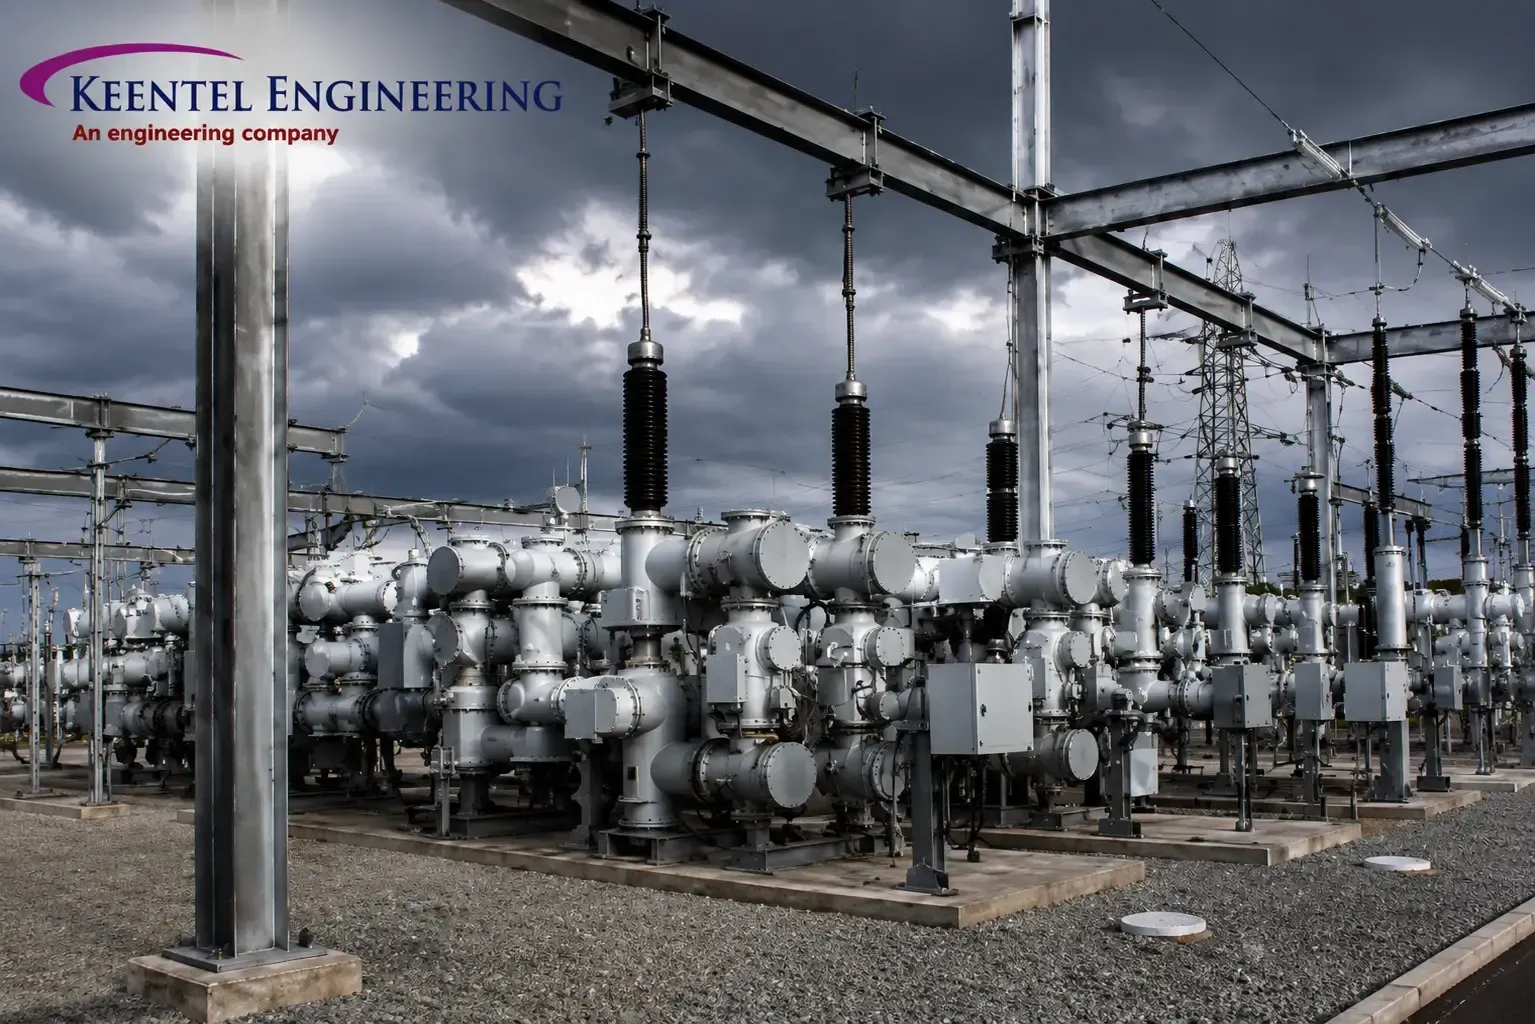
Keentel Engineering Solutions was retained by the Owner of a 345 kV gas-insulated substation (GIS) to determine why the station's secondary systems misbehaved whenever a disconnector was operated, and whether the phenomenon responsible also threatened the primary insulation. The presenting symptoms were three. Numerical relays and station computers recorded spurious status changes, communications dropouts and, on nine occasions in the fourteen months preceding Month 0, protection misoperations requiring reporting under NERC PRC-004. Field personnel reported perceptible and in two cases startling electric shocks on contact with enclosure surfaces during disconnector operation, in a yard where nothing was energized that anyone could touch. And the Owner's asset group had begun to question whether the two 345/138 kV transformer banks connected directly to the GIS through SF6-to-oil bushings were accumulating insulation damage that no routine test would find. The three symptoms have one cause. A gas-insulated substation is an electrically compact coaxial system in which a traveling wave crosses a bay in tens of nanoseconds, the bus surge impedance is 50 to 80 Ω rather than the 300 to 400 Ω of an overhead line, and a disconnector's slow-moving contacts strike and restrike hundreds of times during a single operation. The result is a class of transient — very fast transient overvoltage (VFTO) inside the enclosure, and transient enclosure voltage (TEV) on the outside of it — with rise times of a few nanoseconds and oscillation frequencies in the tens of megahertz. These phenomena do not exist in an air-insulated substation in any comparable form. They are invisible to load flow, to short-circuit analysis, to conventional switching studies, and even to a standard lightning study, because every one of those methods uses a time step and a model bandwidth that filters them out before they can appear. The study was executed in PSCAD/EMTDC with an independent EMTP cross-check, using a distributed-parameter representation of 214 individual GIS sections, a nanosecond-scale spark model for the disconnector arc, a measured high-frequency capacitive model of the transformers, and a separate transmission-line model of the enclosure with respect to the station ground grid. The time step was 0.5 ns over a 20 µs window, and 9,000 Monte Carlo shots were used to sample restrike instants and trapped-charge states. The results were unambiguous. VFTO reached a statistical 2 percent value of 2.34 pu of peak line-to-ground voltage at the transformer terminal and 2.11 pu on the bus, ringing at 12.8 MHz with a 4.6 ns rise time — roughly 260 times faster than the 1.2/50 µs lightning impulse against which the equipment's 1050 kV BIL was demonstrated. TEV measured 8.4 kV peak at a bushing flange with a dominant 6.1 MHz component. Induced voltage on unshielded secondary cabling reached 3.1 kV, exceeding the 2.5 kV oscillatory surge withstand crest of IEEE Std C37.90.1 at a frequency an order of magnitude above what that test applies. The recommended package — 500 Ω damping resistors on the four disconnectors adjacent to the transformer bays, a rebuilt enclosure bonding and equipotential mesh scheme, shielded and double-bonded secondary cabling with parallel ground continuity conductors, and an interim operational restriction — reduced VFTO to 1.62 pu, TEV to 1.9 kV, and secondary induced voltage to below 300 V. Misoperations ceased. The shock reports ceased. The Owner retained the validated model and added VFTO and TEV requirements to its GIS procurement standard. Figures presented are representative of the delivered study and have been generalized to protect client confidentiality. Study at a Glance
| Parameter | Value |
|---|---|
| Asset studied | 345 kV GIS, double bus single breaker, nine bays |
| Transformation | Two 345/138 kV banks, direct SF6-to-oil bushing connection |
| Trigger for study | 9 protection misoperations, 3 personnel shock reports |
| Study type | Very fast transient and enclosure voltage EMT study |
| Primary tool | PSCAD/EMTDC; independent EMTP cross-check |
| Governing VFTO before mitigation | 2.34 pu at transformer terminal, 12.8 MHz, 4.6 ns rise |
| Governing TEV before mitigation | 8.4 kV peak at bushing flange, 6.1 MHz |
| Post-mitigation result | VFTO 1.62 pu, TEV 1.9 kV, secondary induced under 300 V |
2. Background and Study Drivers
The station is a nine-bay 345 kV indoor GIS in a double-bus, single-breaker arrangement, serving four transmission lines through SF6-to-air bushings, two 345/138 kV transformer banks through SF6-to-oil bushings, one bus coupler bay and two bays reserved for future extension. The GIS replaced an air-insulated yard whose footprint the Owner could not extend, and the compactness that justified the replacement is precisely the property that produced the problem. The commercial and compliance stake had three parts. The first was regulatory. Protection misoperations are reportable and correctable events under NERC PRC-004, and a station generating them at a rate approaching one every six weeks, with no fault present and no identified relay defect, is a standing compliance exposure. The Owner's protection group had already replaced two relays, reflashed firmware on four more, and rerouted one cable, none of which changed the rate. The second was personnel safety. Three shock reports had been logged by switching crews, two describing an involuntary startle reaction on contact with a bushing flange handrail. No injury resulted. The Owner correctly treated this as a serious finding rather than a nuisance, because the hazard in a TEV event is not electrocution — the discharge is energy-limited and brief — but the startle-and-fall response of a person on a ladder, a platform or a walkway, which is the mechanism OSHA 1910.269 and NFPA 70E exist to prevent. Operations had responded by restricting disconnector operation to periods when the affected bay was unoccupied, an unsustainable constraint on switching. The third was asset risk. VFTO stress on a transformer is not detectable by any conventional acceptance test. It does not show on a power-factor test, it does not necessarily show on a routine dissolved gas analysis until damage is well advanced, and it is not covered by the BIL demonstration because the BIL test waveform is far slower than the stress. The Owner had two banks with an eighteen-month replacement lead time and a spare policy covering one phase. A quantified answer on winding stress was worth considerably more than the study cost. A fourth driver emerged during scoping. The Owner intended to extend the GIS into the two reserved bays and had a procurement specification that said nothing about VFTO, nothing about TEV, and nothing about damping resistors. Whatever the study found, the specification needed to change before the extension was tendered.
3. Study Objectives and Scope of Work
- Characterize the disconnector restrike process at this installation, including the number of restrikes per operation, the distribution of trapped-charge states, and the resulting statistical distribution of very fast transient overvoltage.
- Determine VFTO magnitude, dominant frequency and rise time at every dielectrically significant location in the GIS, and compare against the equipment insulation levels with explicit treatment of the fact that a nanosecond front is not covered by the BIL demonstration.
- Determine the voltage distribution imposed on the transformer high-voltage winding by the VFTO front, quantify the departure from uniform distribution across the line-end turns, and identify part-winding resonance exposure.
- Determine transient enclosure voltage at every enclosure discontinuity — bushings, viewing ports, insulating flanges, cable terminations, expansion joints — and assess personnel shock exposure and interference potential.
- Quantify radiated and conducted coupling from the GIS into secondary cabling, and compare induced voltages against the surge withstand capability levels of IEEE Std C37.90.1 and the immunity levels of the IEC 61000-4 series.
- Verify circuit breaker transient recovery voltage against IEEE Std C37.06, including terminal fault, short-line fault and out-of-phase duties, and evaluate cable and transformer energization and lightning ingress through the overhead-to-GIS interface.
- Validate the model against a field measurement campaign using capacitive dividers and high-bandwidth acquisition, to a stated acceptance criterion.
- Compare mitigation options on technical merit, order-of-magnitude cost, schedule and residual risk; recommend a package; and supply specification language for the Owner's GIS procurement standard.
Scope and Deliverables
| Element | In scope | Out of scope |
|---|---|---|
| Transient classes | VFTO, TEV, switching, TRV, lightning ingress | Sub-synchronous and control interaction |
| GIS extent | All nine bays, all bus sections, both transformer bushings | Internal spacer and dielectric design |
| Secondary systems | Cable coupling, routing, shielding, bonding | Relay settings, logic, firmware |
| Grounding | Enclosure bonding, equipotential mesh, high-frequency behavior | Grid touch and step voltage redesign per IEEE Std 80 |
| Transformer | Terminal stress, initial winding distribution, resonance screening | Detailed internal winding model, remaining-life estimate |
| Deliverables | Report, validated models, mitigation design, specification text | Construction and retrofit management |
Two exclusions require comment. The study did not build a detailed lumped-element internal winding model of the transformers, because the manufacturer's winding geometry was not available and a model built on assumed geometry would have produced a precise-looking number with no evidential value. Instead the study quantified the initial capacitive distribution from measured terminal capacitances, which is defensible, and stated the resonance screening as a screening result rather than a stress calculation. The study also did not redesign the station ground grid for power-frequency fault performance; the grid was adequate at 60 Hz and the finding concerned its behavior at megahertz frequencies, which is a bonding problem rather than a grid problem. The Owner accepted both exclusions in writing.
4. Regulatory and Standards Basis
The regulatory drivers are protection performance and facility rating integrity. NERC PRC-004 requires identification and correction of protection system misoperations; a station producing misoperations from an electromagnetic interference mechanism has an uncorrected cause, and closing those events required identifying it. NERC PRC-005 governs maintenance and testing of protection systems, and the Owner's testing program could not have detected an interference-induced misoperation because the relays were functionally sound. NERC FAC-008 requires facility ratings consistent with equipment ratings; equipment subjected repeatedly to a dielectric stress outside the envelope in which its rating was demonstrated is not clearly within rating, and the study was scoped in part to establish whether that was the case here. Standards and Regulatory Register
| Reference | Application in this study |
|---|---|
| IEEE Std C37.122 | GIS rated above 52 kV; enclosure, bonding and dielectric requirements |
| IEEE Std C37.122.1 | GIS application guide; VFTO and TEV recognition and practice |
| IEEE Std 1313.1 / 1313.2 | Insulation coordination classes; very-fast-front class definition |
| IEEE Std C57.12.00-2021 | Transformer BIL and front-of-wave withstand; bushing levels |
| IEEE Std C57.142 | Switching transients from transformer and switching device interaction |
| IEEE Std C37.06 / C37.011 | Preferred TRV ratings; TRV calculation and application |
| IEEE Std C37.90.1 / C37.90.2 | Surge withstand capability and radiated immunity for relays |
| IEEE Std 525 | Design and installation of cable systems in substations; shield bonding |
| IEEE Std 1050 | Instrumentation and control equipment grounding practice |
| IEEE Std 80-2013 / 81-2012 | Grid design basis; measurement of grid and bonding impedance |
| IEEE Std 837 | Qualification of permanent connections for grounding |
| IEEE Std C62.11 / C62.22 | Arrester characteristics and application at the GIS interface |
| IEEE Std 998-2012 | Shielding at the overhead-to-GIS transition structure |
| ANSI C84.1-2020 | Maximum system voltage 362 kV; per-unit base derivation |
| NESC (ANSI C2), OSHA 1910.269, NFPA 70E | Clearance, grounding and personnel safety framing |
| NERC PRC-004, PRC-005, FAC-008 | Misoperation correction, protection maintenance, facility ratings |
| IEC 61000-4-4 / -4-18, IEC 62271-203 | Comparison only; see Section 6.5 |
US practice governs throughout. Insulation levels are stated as BIL from the preferred-level tables of IEEE Std C57.12.00 and IEEE Std C37.06, not against an IEC highest-voltage-for-equipment ladder. Immunity is assessed primarily against IEEE Std C37.90.1, with the IEC 61000-4 series cited where it covers a stress the IEEE test does not, which in this study it does. Voltages are referred to a base of 295.6 kV, the peak line-to-ground value at the 362 kV maximum system voltage of ANSI C84.1.
5. System Modeling and Data Development
5.1 Data sources and gap closure
A VFTO study is unusually data-hungry in one specific respect: it requires physical dimensions. Every straight run, every elbow, every disconnector chamber, every spacer, every bushing and every enclosure section must be represented by its own surge impedance and its own travel time, and both derive from geometry. A single-line diagram is close to useless. The study therefore began with a dimensional survey. Model Data Sources and Gap Closure
| Data item | Source | Gap closure |
|---|---|---|
| GIS internal geometry | General arrangement drawings, partial | Field survey, 214 sections dimensioned |
| Conductor and enclosure diameters | Manufacturer data incomplete | Measured at accessible flanges and spare chambers |
| Disconnector contact speed and stroke | Not documented | Measured on a spare unit during outage |
| Transformer HF terminal capacitance | Factory records absent | Measured on site, three-terminal method, 1 kHz to 1 MHz |
| Bushing capacitance and stray capacitance | Nameplate C1 only | C1 from nameplate; stray from geometry and measurement |
| Enclosure bonding strap lengths | Drawings generic | Field survey, all 96 bonding points |
| Station grid impedance vs frequency | 60 Hz value only | Injection test 10 kHz to 30 MHz, supported by CDEGS |
| Secondary cable routing and shield practice | Cable schedule, no routing detail | Physical trace of 41 representative circuits |
| Restrike count per operation | None | Measured, 18 operations, high-bandwidth acquisition |
The bonding survey and the cable trace were the two most valuable data activities, and both found conditions the drawings did not show. Fourteen of the 96 enclosure bonding points used straps between 9 and 13.5 feet long where the design intent had been under 3 feet. Nine of the 41 traced secondary circuits ran within 12 inches of a bushing flange for more than 16 feet, and six of those had cable shields bonded at one end only, a practice that is correct for low-frequency electrostatic screening and actively harmful at megahertz frequencies.
5.2 Model construction
The GIS was represented as a network of lossless distributed-parameter transmission lines. This is the correct formulation and effectively the only correct one: a coaxial gas-insulated bus is an almost ideal TEM structure with negligible dispersion over the band of interest, so its behavior is fully described by a surge impedance and a travel time, and both follow from the conductor and enclosure diameters. Surge impedance was computed as Z = 60·ln(D/d) for each section, where D is the enclosure inner diameter and d the conductor outer diameter, giving values from 48 Ω in the disconnector chambers, where the local conductor is enlarged, to 78 Ω in the spacer regions. The main bus runs came out at 62 Ω. Propagation velocity in SF6 at the operating density is within 2 percent of the speed of light, and 0.98c was used, giving a travel time of 3.40 ns per meter, or 1.04 ns per foot. Representative GIS Section Parameters
| Section type | Surge impedance (Ω) | Typical length (ft) | Travel time (ns) |
|---|---|---|---|
| Main bus run | 62 | 27.9 | 28.9 |
| Bay connection bus | 65 | 13.8 | 14.3 |
| Disconnector chamber | 48 | 3.6 | 3.7 |
| Circuit breaker chamber | 55 | 7.9 | 8.2 |
| Spacer / support region | 78 | 1.0 | 1.0 |
| SF6-to-oil bushing transition | 71 | 9.5 | 9.9 |
| Overhead line beyond bushing | 340 | — | — |
The contrast in the last two rows is the entire physics of the problem in one table. A wave arriving at the transition from a 62 Ω bus into a 340 Ω overhead line sees a reflection coefficient of +0.69 and nearly doubles; arriving at a transformer bushing terminated in a few nanofarads, it sees an effective open circuit at these frequencies and doubles outright. In an air-insulated substation the same wave travels between elements separated by hundreds of feet at 984 ft/µs and its reflections are smeared across a front measured in microseconds. Here they are separated by nanoseconds and arrive coherently. The disconnector was represented by a spark model rather than an ideal switch. When the contacts approach and the gap breaks down, the arc resistance does not step to zero; it collapses from an essentially infinite pre-breakdown value to a residual arc resistance with a time constant of the order of one nanosecond. The model used R(t) = R₀·e^(−t/τ) + R_arc with τ = 1.1 ns, R_arc = 0.7 Ω and R₀ = 10¹² Ω. This matters more than it appears to. An ideal switch produces a mathematically infinite rate of rise, which the solver then limits to one time step, making the computed rise time an artifact of the time step rather than a property of the system. With the spark model the rise time is a physical result, and it is what the study reports. Breakdown initiation used a gap-voltage criterion with the withstand of the opening gap rising in proportion to contact separation. The measured contact speed was 11 inches per second over a 10-inch stroke, an operating time of about 0.89 s, and the SF6 gap withstand gradient at the operating density gives a strength recovery rate of roughly 1.2 kV per microsecond of travel. Against a 60 Hz source traversing its full range every 8.33 ms, that recovery rate is glacial, and the consequence is the restrike train described in Section 7.2. The transformers were represented by a measured high-frequency capacitive network rather than by leakage impedance. At 12.8 MHz a transformer is not an inductance; it is a capacitance with a complicated internal structure. The measured values were a terminal-to-ground capacitance of 3,850 pF and an equivalent series winding capacitance of 210 pF, with the bushing contributing 480 pF in parallel. The model reproduced measured terminal impedance within 8 percent from 10 kHz to 5 MHz and within 15 percent to 20 MHz. The enclosure was modeled as a separate transmission-line network referenced to the station ground grid, with a computed enclosure-to-ground surge impedance of 130 Ω for the elevated runs. Every discontinuity — bushing flange, viewing port, insulating flange at the cable terminations, expansion joint — was represented as a coupling point between the internal coaxial system and the external enclosure system, with the coupling coefficient derived from the geometry of the aperture. Bonding straps were modeled as inductances at 0.32 µH per foot from the surveyed lengths, and the station grid as a frequency-dependent impedance from the injection test. Time step was 0.5 ns. This was verified by rerunning the governing cases at 0.2 ns, which changed peak VFTO by 0.9 percent and dominant frequency by 0.4 percent. The simulation window was 20 µs for VFTO and TEV cases, long enough to contain the full ringing decay and any reflection returning from the remote end of the shortest overhead line, and 100 ms for the TRV and energization cases at a 2 µs step.
5.3 Why conventional models fail here
It is worth stating explicitly what a conventional model does to these phenomena, because the Owner's first reaction was that the GIS had been studied at procurement and nothing had been found. A 60 Hz load flow or short-circuit model represents the entire GIS as a node. Its physical extent is zero and its travel times do not exist. A conventional switching study at a 10 to 50 µs time step has a Nyquist limit of 10 to 50 kHz; a 12.8 MHz oscillation is not attenuated by such a model, it is simply absent, and the solver will return a smooth, plausible, entirely wrong answer. Even a competently built lightning study, at a 2 ns step with frequency-dependent line models, will usually miss VFTO — not because of bandwidth but because of topology. A lightning model represents the incoming line in detail and the station in outline, often lumping the GIS into a few sections with a single capacitance. It has no disconnector spark model, no enclosure-to-ground network, and no reason to look at internal reflections. The procurement-stage study had been exactly this, and it had been adequate for the question it was asked.
5.4 Model validation
Model Validation and Benchmarking
| Check | Benchmark | Model result |
|---|---|---|
| Power frequency voltage and fault duty | Owner short-circuit case | Within 1.4 percent |
| GIS section impedances | Analytical coaxial formula | Exact by construction; geometry verified |
| Transformer terminal impedance | On-site sweep, 10 kHz to 20 MHz | Within 8 percent to 5 MHz, 15 percent to 20 MHz |
| Enclosure-to-ground impedance | Injection test, 10 kHz to 30 MHz | Within 12 percent |
| VFTO waveform, PSCAD vs EMTP | Independent EMTP build | Peak within 0.05 pu, frequency within 3 percent |
| Full model vs field measurement | Section 11 campaign | All quantities within acceptance criteria |
The EMTP cross-check was performed because the recommendation carried a seven-figure retrofit. An independent engineer rebuilt the case from the dimensional survey without sight of the PSCAD results.
6. Study Methodology and Assumptions
6.1 Analytical approach
The study proceeded in five stages. First, a deterministic single-restrike analysis established the mechanism and identified the locations at which VFTO and TEV were highest. Second, a Monte Carlo campaign sampled the restrike instant and the trapped-charge state to produce a statistical distribution rather than a single number. Third, the transfer of the resulting front into the transformer winding was evaluated. Fourth, the enclosure and secondary-circuit consequences were computed. Fifth, mitigation options were modeled in the same framework so that their comparison used consistent physics rather than vendor claims.
6.2 Tool selection
PSCAD/EMTDC was the primary tool, chosen for its distributed-parameter line models, its handling of very small time steps over long windows, and its scripted Monte Carlo facility. EMTP provided the independent cross-check on the governing cases. CDEGS supported the frequency-dependent grid impedance derivation between measurement points. Python was used for post-processing: extraction of peaks, rise times and dominant frequencies from 9,000 result files, and the fast Fourier transforms used to compare simulated and measured spectra.
6.3 Cases and scenarios
Case and Scenario Matrix
| Case group | Variable dimensions | Runs |
|---|---|---|
| Disconnector restrike, bus side | 6 disconnectors × 500 restrike samples | 3,000 |
| Disconnector restrike, transformer bays | 4 disconnectors × 500 restrike samples | 2,000 |
| Disconnector restrike, line bays | 8 disconnectors × 500 restrike samples | 4,000 |
| Circuit breaker switching and TRV | 4 duties × 3 configurations | 12 |
| Transformer and cable energization | 2 banks × 4 point-on-wave × 3 residual flux | 24 |
| Lightning ingress at overhead interface | 3 stroke currents × 4 termination points | 12 |
| Mitigation verification | 6 options × governing cases | 96 |
The Monte Carlo sampling covered two random variables. The first is the instant within the 60 Hz cycle at which each restrike occurs, which sets the source-side voltage. The second is the trapped charge remaining on the disconnected section from the previous restrike, which is not independent of the first but was sampled jointly from a distribution derived from the sequential restrike simulation described in Section 7.2. The worst case, and the one the study reports, is a restrike occurring when the source side is at positive peak while the trapped charge on the isolated section is negative — the two voltages add across the gap rather than subtract.
6.4 Acceptance criteria
Acceptance Criteria
| Quantity | Criterion | Basis |
|---|---|---|
| VFTO at any GIS location | Below 1.7 pu preferred; above 2.0 pu unacceptable | IEEE Std C37.122.1 practice; BIL margin |
| Transformer terminal VFTO | Below 1.7 pu | Winding distribution, not terminal BIL |
| TEV at any accessible surface | Below 2.0 kV peak | Personnel perception and startle threshold |
| Secondary circuit induced voltage | Below 1.0 kV core-to-ground | Margin below IEEE Std C37.90.1 crest |
| Breaker TRV, all duties | Below rated envelope of IEEE Std C37.06 | Rating verification |
| Model validation, peak values | Within ±15 percent of measurement | Study-specific, agreed at kickoff |
| Model validation, dominant frequency | Within ±10 percent of measurement | Study-specific, agreed at kickoff |
| Model validation, rise time | Within ±20 percent of measurement | Study-specific, agreed at kickoff |
The 2.0 kV TEV criterion deserves explanation because no US standard states one. TEV shocks are capacitive discharges of very low energy and are not an electrocution hazard; the mechanism of concern is the startle reaction. Published industry experience places the perception threshold in the range of 1 to 2 kV and the reliable startle threshold above about 3 kV. The Owner and Keentel agreed 2.0 kV as a criterion on the basis that it sits at the top of the perception band and well below the startle band, and that a criterion tied to human response is more defensible than one tied to an equipment test level.
6.5 Assumptions and limitations
The model assumed lossless GIS sections. Losses in the coaxial bus are genuinely small over 20 µs, and neglecting them is conservative: the computed ringing decays more slowly than the measured, as Section 11 confirms. The spark model parameters were taken from published industry values rather than measured on this disconnector, since measuring a nanosecond resistance collapse inside an SF6 chamber was not practical; sensitivity to τ was tested and is reported in Section 8. The transformer model represents terminal behavior and the initial capacitive distribution correctly but cannot compute internal turn-to-turn stress, which the study states as a limitation rather than obscuring. Coupling coefficients at enclosure discontinuities were derived geometrically and then calibrated against the field measurement at one bushing flange, with the calibration factor applied uniformly — a simplification the study documents.
7. Analysis and Results
7.1 Why gas-insulated substations are different
Four properties, each individually modest, combine to produce a phenomenon that has no air-insulated equivalent. The first is electrical compactness. A bay of this GIS is about 39 feet of bus from breaker to bushing. At 1.04 ns per foot, that is a 41 ns one-way travel time and an 82 ns round trip. Any event whose front is faster than 82 ns will see the bay as a transmission line with reflections, not as a lumped node. In an air-insulated 345 kV yard the equivalent path is 200 to 330 feet, a round trip of 400 to 660 ns, and the events that occur there have fronts measured in microseconds. Compactness does not make GIS quieter; it makes it resonant at a higher frequency. The second is low surge impedance. At 62 Ω the GIS bus is a stiff, low-impedance system. A given injected voltage step drives a current five to six times larger than the same step on a 340 Ω overhead line, and the impedance mismatch at every interface to the outside world is severe. The third is the disconnector. A GIS disconnector is not a fast device and is not meant to be. It moves at about 11 inches per second and takes the better part of a second to complete its stroke. Its function is isolation, and its interrupting capability is limited to the capacitive current of the section it disconnects — a small current that it nonetheless cannot clear cleanly, because the gap strength recovers far more slowly than the source voltage moves. The fourth is the coaxial geometry itself, which confines the internal wave almost perfectly, so that the only paths to the outside are the discontinuities — and every wave that reaches one couples energy onto the enclosure exterior.
7.2 The restrike train
Consider a disconnector opening a short section of bus that has no other source. As the contacts separate, the section is left with whatever charge it held. The source side continues to follow the 60 Hz waveform. The voltage across the gap is therefore the difference between a moving source voltage and a static trapped voltage. When that difference exceeds the gap's instantaneous withstand, the gap breaks down, a very fast transient is launched into both sides, the section is recharged to a new voltage close to the instantaneous source voltage, and the gap recovers. The contacts have meanwhile moved a fraction of a millimeter. The cycle repeats. Each restrike leaves a new trapped charge. Early in the stroke, when the gap is short, restrikes occur near the zero crossings of the difference voltage and the trapped charge stays small. As the gap lengthens, restrikes require larger difference voltages, occur further from the crossing, and leave larger trapped charges of alternating sign. The last restrike of the sequence is the worst, because it occurs at the largest difference voltage the gap can no longer hold. Measurement over eighteen operations found between 168 and 340 restrikes per operation, with the maximum on a bus-side disconnector opening the longest isolated section. The theoretical worst case is a trapped charge of −1.0 pu meeting a source at +1.0 pu, a gap voltage of 2.0 pu. The measured and simulated distributions did not reach that bound; the governing sampled case had a trapped charge of −0.72 pu against a source at +1.00 pu, a gap step of 1.72 pu. Closing operations produce the same mechanism in reverse, with prestrikes rather than restrikes; the counts were similar and the magnitudes slightly lower, because during closing the gap is shortening and the strike occurs earlier relative to the difference voltage. Restrike Characteristics, Measured and Simulated
| Quantity | Measured range | Simulated range |
|---|---|---|
| Restrikes per opening operation | 168 to 340 | 174 to 328 |
| Prestrikes per closing operation | 155 to 311 | 161 to 302 |
| Trapped charge, final restrike | −0.69 to +0.66 pu | −0.72 to +0.70 pu |
| Gap step voltage, governing case | 1.68 pu | 1.72 pu |
| Interval between restrikes, late stroke | 1.9 to 4.4 ms | 2.1 to 4.6 ms |
7.3 Very fast transient overvoltage results
When the gap breaks down, the 1.72 pu step launches two traveling waves, one into each side, with amplitudes set by the impedance division at the gap. Each wave then reflects at every discontinuity it meets. At the open end of the isolated section the reflection coefficient is +1 and the wave doubles. At the transformer bushing, terminated in a few nanofarads that look like an open circuit at 12.8 MHz, it also very nearly doubles. At the junction to a 340 Ω overhead line the coefficient is +0.69. The superposition of the trapped charge, the incident wave and these reflections is the VFTO. VFTO Results, Statistical 2 Percent Values, Pre-Mitigation
| Location | VFTO (pu) | Dominant frequency (MHz) | Rise time (ns) |
|---|---|---|---|
| Transformer bay terminal, Bank 1 | 2.34 | 12.8 | 4.6 |
| Transformer bay terminal, Bank 2 | 2.29 | 12.4 | 4.9 |
| Main bus, adjacent to operated DS | 2.11 | 14.1 | 4.1 |
| Line bay, SF6-to-air bushing | 1.96 | 11.6 | 5.3 |
| Bus coupler bay | 1.88 | 15.2 | 3.8 |
| Instrument transformer chamber, line bay | 2.04 | 13.7 | 4.4 |
| Absolute maximum over 9,000 shots | 2.41 | 12.8 | 4.5 |
The transformer terminal is the worst location for a structural reason: it is a near-open termination at the end of a section whose length places its quarter-wave resonance at 12.8 MHz. A quarter-wave at 12.8 MHz in this medium is 19.2 ft, and the bus run from the transformer disconnector to the bushing is 19.4 ft. The GIS was, unintentionally, tuned. Against a 1050 kV BIL, 2.34 pu is 692 kV, a margin that looks comfortable. It is not the relevant comparison. The BIL demonstration uses a 1.2/50 µs impulse. This front rises in 4.6 ns, roughly 260 times faster. Insulation coordination as codified in IEEE Std 1313.1 recognizes a very-fast-front class precisely because the standard impulse tests do not cover it, and no routine factory or field test on any of this equipment applied a comparable waveform. The correct statement is not that the equipment passes with margin; it is that the equipment's withstand at this waveform is unverified, and the stress is being applied several hundred times per switching operation.
7.4 Transfer into the transformer winding
For a front this fast, the initial voltage distribution along a transformer winding is governed entirely by capacitance, not inductance. The distribution parameter is α = √(C_g/C_s), where C_g is the total winding-to-ground capacitance and C_s the equivalent series capacitance. The measured values give α = 4.3. For a step applied to the line end of a winding with a grounded neutral, the initial distribution follows a hyperbolic function of position, and with α = 4.3 the first 10 percent of the winding takes 35 percent of the applied voltage — 3.5 times what a uniform distribution would give. At the pre-mitigation VFTO of 2.34 pu, that is 242 kV across the first tenth of the winding. The turn-to-turn and disc-to-disc stress in that region is correspondingly concentrated, and it is concentrated in exactly the part of the winding where interturn insulation is thinnest relative to the stress it normally sees. Two further effects were assessed. The first is part-winding resonance. The measured terminal sweep showed winding resonances at 148 kHz and 640 kHz. A 12.8 MHz oscillation does not excite a 148 kHz resonance directly. But the restrike train is a burst of several hundred steps spread over a fraction of a second, and the spectral content of that burst envelope — as distinct from the content of any single front — has significant energy in the 100 to 700 kHz band. This is the mechanism by which repeated disconnector operation can excite a part-winding resonance that no single event would reach, and it is why restrike count matters as much as restrike magnitude. The second is surge transfer to the 138 kV winding. The high-frequency capacitive coupling between windings transferred 0.11 pu of the 345 kV side VFTO to the 138 kV terminals, or 76 kV on a 138 kV base — not a dielectric concern on its own, but relevant because the 138 kV side connects to cable and the transferred front propagates further. Transformer Winding Stress Summary
| Quantity | Pre-mitigation | Post-mitigation |
|---|---|---|
| Terminal VFTO | 2.34 pu (692 kV) | 1.62 pu (479 kV) |
| Voltage across first 10 percent of winding | 242 kV | 168 kV |
| Ratio to uniform distribution | 3.5 | 3.5 |
| Transferred voltage, 138 kV terminals | 76 kV | 53 kV |
| Restrike events per operation | up to 340 | up to 340 |
The ratio does not improve with mitigation because it is a property of the winding, not of the stress. Only the magnitude improves — which is the whole point of mitigating at the source.
7.5 Transient enclosure voltage results
The internal traveling wave is confined by the coaxial geometry, and at every discontinuity in that geometry a fraction of it couples to the outer surface of the enclosure. The enclosure then behaves as a transmission line with respect to remote earth, with a computed surge impedance of 130 Ω, and supports its own oscillation determined by its length and its terminations. TEV Results, Pre-Mitigation
| Location | TEV peak (kV) | Dominant frequency (MHz) | Accessible to personnel |
|---|---|---|---|
| SF6-to-oil bushing flange, Bank 1 | 8.4 | 6.1 | Yes, handrail contact |
| SF6-to-air bushing flange, line bay | 6.9 | 5.8 | Yes, platform |
| Insulating flange, cable termination | 5.6 | 7.4 | Yes |
| Viewing port, disconnector chamber | 4.2 | 6.3 | Yes |
| Expansion joint, main bus | 3.1 | 5.5 | Partial |
| Local control cabinet enclosure | 2.7 | 6.1 | Yes |
The 6.1 MHz dominant frequency corresponds to a quarter-wave resonance on 40 feet of enclosure, which is the run from the bushing flange to the nearest effective bond. That phrase — nearest effective bond — is the finding. There were bonding straps far closer than 40 feet. They were not effective. A bonding strap is an inductor. At 0.32 µH per foot, one of the surveyed 10.5-foot straps of 4/0 AWG copper presents 3.36 µH, and at 6.1 MHz its impedance magnitude is 129 Ω. The enclosure surge impedance is 130 Ω. The strap is, at this frequency, indistinguishable from no connection at all. At 60 Hz the same strap has an impedance of 1.3 milliohms and is an excellent ground. This is the single most important practical insight in the study and the one the Owner's staff found most counterintuitive: the station's grounding system was correctly designed, correctly installed, correctly tested, entirely compliant with IEEE Std 80, and completely irrelevant to the phenomenon causing the shocks. The remedy follows from the same arithmetic. Impedance is proportional to length, so halving the strap halves the impedance. Reducing the surveyed straps to under 2 feet and replacing round conductor with wide copper sheet — which has lower inductance per unit length because of its larger surface — brought the effective bond impedance at 6.1 MHz from 129 Ω to 21 Ω. Combined with additional bonds so that no enclosure run exceeded 10 feet between effective bonds, the resonant length dropped and the resonant frequency rose out of the band where the internal coupling has significant energy. Modeled TEV at the governing bushing flange fell to 1.9 kV.
7.6 Coupling into secondary circuits
Secondary circuits are exposed by three mechanisms, and the study found all three active. Conductive coupling occurs where a secondary cable's shield or a device's ground reference is bonded to an enclosure that is itself at 8.4 kV with respect to remote earth. The full TEV appears as a common-mode voltage between that reference and the reference at the other end of the cable. Inductive coupling occurs because the ground strap and enclosure currents are large and fast. Simulated peak current in the governing bushing bonding strap was 683 A with a 4.6 ns front, giving a di/dt of the order of 10¹¹ A/s. A cable routed parallel to that strap for 16 feet at 12 inches separation has a mutual inductance of roughly 0.9 µH, and the induced voltage follows directly. Radiative coupling occurs because a 6.1 MHz oscillation on a 40-foot enclosure is an efficient antenna. Field strengths in the immediate vicinity of a bushing flange during a restrike are substantial, and any cable within a few feet is in the near field. Secondary Circuit Induced Voltage
| Circuit condition | Induced voltage, core-to-ground | Frequency content |
|---|---|---|
| Unshielded, routed within 12 inches of flange | 3.1 kV | 5 to 14 MHz |
| Unshielded, routed in trench 10 feet from GIS | 1.4 kV | 5 to 12 MHz |
| Shielded, single-end bond, close routing | 2.2 kV | 5 to 14 MHz |
| Shielded, double-end bond, close routing | 640 V | 5 to 10 MHz |
| Shielded, double-end bond, GCC, rerouted | 280 V | 5 to 8 MHz |
The measured 3.1 kV must be compared against what the relays were actually qualified to. IEEE Std C37.90.1 specifies a 2.5 kV crest oscillatory surge withstand test at 1 MHz, and a 4 kV fast transient test. The measured stress exceeded the oscillatory crest by 24 percent and did so at 5 to 14 MHz, five to fourteen times the test frequency, where cable and equipment coupling behavior is entirely different. The IEC 61000-4-18 damped oscillatory wave test extends to 100 kHz and 1 MHz and likewise does not reach this band; IEC 61000-4-4 fast transient bursts have fast fronts but a 5 kHz repetition structure and a very different coupling path. The honest conclusion, and the one the study stated, is that no immunity test in either standards family qualifies a relay against the stress present in this station, and the correct response is therefore to reduce the stress rather than to demand a better-qualified relay. The single-end versus double-end shield bonding result was the one that changed practice. Bonding a shield at one end only prevents circulating power-frequency current and is standard practice in many US utilities for that reason. It also leaves the shield electrically open at high frequency at one end, so it cannot carry the return current that would otherwise cancel the induced core voltage. Bonding both ends reduced the induced voltage from 2.2 kV to 640 V. The circulating-current objection is addressed by the parallel ground continuity conductor, which carries the low-frequency current the shield would otherwise carry.
7.7 Circuit breaker switching and TRV verification
The GIS breakers were verified against IEEE Std C37.06 for terminal fault, short-line fault and out-of-phase duties. GIS is generally favorable for TRV because the bus capacitance reduces the rate of rise, and that was confirmed here. TRV Verification Against IEEE Std C37.06
| Duty | Rated peak (kV) | Rated RRRV (kV/µs) | Computed peak (kV) | Computed RRRV (kV/µs) |
|---|---|---|---|---|
| Terminal fault T100 | 554 | 2.0 | 512 | 1.84 |
| Terminal fault T60 | 620 | 3.0 | 571 | 2.66 |
| Terminal fault T30 | 675 | 5.0 | 634 | 4.41 |
| Short-line fault L90 | 700 | 7.0 | 651 | 6.12 |
| Out-of-phase | 831 | 1.6 | 712 | 1.41 |
All duties passed with margin. The short-line fault case is the closest, as it usually is, because the line-side sawtooth component is set by the overhead line surge impedance and the fault current, neither of which the GIS capacitance influences much. No mitigation was required. This part of the study is reported because a complete transient study of a station should verify TRV, and because a negative result here would have changed the mitigation package substantially.
7.8 Energization and lightning ingress
Transformer energization produced inrush with a 42 percent second-harmonic content and a maximum sympathetic interaction with the adjacent bank of 0.14 pu current, neither presenting a dielectric or protection concern; the existing second-harmonic restraint was confirmed adequate. Cable energization on the 138 kV side produced a maximum overvoltage of 1.71 pu, within the arrester protective level with a 38 percent margin. Lightning ingress was evaluated at the overhead-to-GIS interface, which is the only path by which a lightning surge can reach the GIS. A shielding failure stroke of 12 kA and a backflashover-driven surge of 68 kA were injected at the transition structure. With the existing line-entrance arresters the maximum voltage inside the GIS was 743 kV against the 1050 kV BIL, a protective margin of 41 percent, satisfying the 20 percent minimum of IEEE Std 1313.2. Lightning is a slower and, in this station, less demanding stress than VFTO in rate of rise, though larger in magnitude. That comparison — a 68 kA lightning surge producing a gentler front than a routine disconnector operation — is the clearest single illustration of why the study was necessary.
8. Sensitivity and Scenario Analysis
Six parameters were varied to establish which conclusions were robust and which depended on assumptions the study could not fully verify. Sensitivity Results
| Parameter varied | Range tested | Effect on governing VFTO |
|---|---|---|
| Spark time constant τ | 0.5 to 3.0 ns | 2.29 to 2.36 pu; rise time 3.4 to 7.1 ns |
| Residual arc resistance | 0.2 to 3.0 Ω | 2.31 to 2.34 pu |
| Trapped charge magnitude | −0.4 to −1.0 pu | 1.93 to 2.58 pu |
| Transformer terminal capacitance | ±30 percent | 2.27 to 2.39 pu; frequency 11.4 to 14.3 MHz |
| Time step | 0.2 to 1.0 ns | 2.32 to 2.36 pu |
| Enclosure bond strap length | 1.3 to 13.5 ft | TEV 1.6 to 9.1 kV |
Three conclusions follow. First, VFTO magnitude is dominated by trapped charge and almost indifferent to the spark model parameters; the spark parameters set the rise time, not the peak. This is fortunate, because trapped charge was measured and the spark parameters were assumed. Second, the frequency is set by geometry and terminal capacitance, so it can be predicted at design stage from drawings alone — which is the basis of the specification language delivered in Section 11. Third, TEV is overwhelmingly a function of bonding strap length and essentially nothing else within the ranges tested, which is why the mitigation is cheap and why the problem was avoidable. What did not matter: GIS section losses, changed by a factor of ten with less than 1 percent effect on peak; the number of bays energized, which shifted frequency by under 4 percent; and the exact overhead line length beyond the first mile, since nothing returns from further away inside the 20 µs window.
9. Findings and Root Cause Assessment
Findings Register
| No. | Finding | Severity |
|---|---|---|
| F1 | Enclosure bonding straps up to 13.5 ft present 129 Ω at 6.1 MHz | High |
| F2 | TEV of 8.4 kV at accessible bushing flange, above perception threshold | High |
| F3 | VFTO of 2.34 pu at transformer terminal, outside verified withstand envelope | High |
| F4 | 35 percent of VFTO step across first 10 percent of transformer winding | High |
| F5 | Nine secondary circuits routed within 12 inches of enclosure discontinuities | High |
| F6 | Six shielded circuits bonded at one end only | Medium |
| F7 | Induced 3.1 kV exceeds IEEE Std C37.90.1 crest at ten times test frequency | Medium |
| F8 | Restrike train excites 148 kHz part-winding resonance through burst envelope | Medium |
| F9 | AC and DC secondary circuits sharing trays over 200 feet | Medium |
| F10 | GIS procurement specification silent on VFTO, TEV and damping resistors | Medium |
| F11 | TRV, energization and lightning ingress all within rating | None |
The root cause has one root and several branches. The root is that the GIS was procured, designed, installed and commissioned by parties none of whom treated very fast transients as a design input. The disconnectors were supplied without damping resistors because none were specified; the bonding was designed to a 60 Hz grounding standard and satisfied it; the secondary cabling was routed for convenience and shielded to a practice that predates numerical relays; and the commissioning tests, all of which passed, measured nothing above a few kilohertz. The branches are the specific accumulations. F1 arose from field routing decisions taken during installation, where a strap was lengthened to clear an obstruction with no recognition that length was the parameter that mattered. F5 and F9 arose from cable tray congestion. F3 arose from a bus length that happened to place a quarter-wave resonance at the frequency the disconnector excites, an outcome of general arrangement drafting rather than of any electrical decision. F10 is the reason all of the above would have repeated in the planned extension. It is worth recording what was not the cause. The relays were sound. The grounding grid was sound. The SF6 system, the disconnector mechanisms and the breakers were all within specification and correctly maintained. Nothing was broken. The station was assembled from compliant parts into a configuration whose emergent behavior no party had analyzed.
10. Mitigation Options and Recommendations
Mitigation Options Comparison
| Option | Effect | Cost order | Residual risk |
|---|---|---|---|
| 500 Ω damping resistors on disconnectors | VFTO 2.34 to 1.62 pu | High | Low; needs outage and DS replacement |
| Ferrite rings on enclosure at discontinuities | TEV 8.4 to 6.2 kV | Low | Medium; saturates, limited VFTO effect |
| Surge arresters at transformer terminal | Limits peak, not rate of rise | Medium | High; does not address 4.6 ns front |
| Enclosure bonding and equipotential mesh | TEV 8.4 to 1.9 kV | Medium | Low; well understood, verifiable |
| Shielded double-bonded cable with GCC | Induced 3.1 kV to 280 V | Medium | Low |
| Operational restriction on DS operation | Exposure only, no physical change | Very low | High as a permanent measure |
Each option was modeled in the same framework, and three deserve comment because their intuitive appeal exceeds their performance. Surge arresters at the transformer terminal are the instinctive answer and are largely ineffective against VFTO. A metal-oxide arrester's protective action depends on the block conducting, and the arrester has its own inductance — lead inductance plus the internal column — which at a 4.6 ns front dominates its behavior. The arrester clips the peak of a slow surge; against a nanosecond front it inserts an inductive voltage that partly defeats its own purpose, and the separation distance between arrester and transformer, trivial at lightning frequencies, is a significant fraction of a wavelength at 12.8 MHz. Arresters remain necessary for lightning and switching duty and were retained. They are not a VFTO mitigation. Ferrite rings fitted around the enclosure at discontinuities add high-frequency series impedance to the enclosure current path and are genuinely useful, cheap and easy to retrofit. Their limitation is saturation at the current levels present here and their negligible effect on the internal VFTO. They were adopted as a supplement, not a primary measure. Damping resistors are the only effective VFTO mitigation. A resistor of the order of the bus surge impedance, in series with an auxiliary contact that makes before the main contact, damps the traveling wave at the instant it is launched. At 500 Ω the modeled VFTO fell from 2.34 to 1.62 pu, the ringing decayed in under 2 µs instead of 14 µs, and the winding stress fell in proportion. The cost is high because the disconnectors must be replaced rather than modified and the work requires a bay outage. The recommendation. A four-part package. First, replace the four disconnectors adjacent to the two transformer bays with damping-resistor-equipped units, during scheduled bay outages, one bay at a time. The transformer bays were selected because they carry the highest VFTO and the most valuable and least testable asset. The remaining disconnectors were left unmodified, a decision the study justified explicitly: with the enclosure and secondary mitigations in place, their VFTO of up to 2.11 pu stresses GIS equipment whose gas-insulated dielectric is far more tolerant of fast fronts than an oil-paper winding, and the marginal risk reduction did not justify eight further bay outages. Second, rebuild the enclosure bonding: no strap longer than 2 feet, wide copper sheet in place of round conductor, additional bonds so that no enclosure run exceeds 10 feet between effective bonds, and an equipotential mesh under all accessible platforms and walkways bonded to the enclosure at both ends of each run. This is the cheapest element of the package and delivers the personnel safety outcome outright. Third, reroute and re-terminate the affected secondary cabling: shielded cable throughout, shields bonded at both ends per IEEE Std 525, a parallel ground continuity conductor along every cable route between the GIS and the relay building, minimum 3 feet separation from enclosure discontinuities, and physical separation of AC and DC circuits into different trays. Fourth, retain the operational restriction on disconnector operation with personnel in the affected bay until the bonding work is complete, then withdraw it.
11. Implementation Support and Field Validation
The field measurement campaign served two purposes: it validated the model before the recommendation was issued, and it verified the result after implementation. Enclosure voltage was measured with capacitive dividers of 1000:1 ratio and 200 MHz bandwidth, mounted directly on the enclosure surface at six locations with the low-voltage arm referenced through a short coaxial run to a local reference plane. Currents in bonding straps were measured with wideband current transformers covering 100 Hz to 100 MHz. Internal VFTO could not be measured directly — there is no access to the conductor — so it was inferred at one location from a capacitive divider installed at a spare flange during the outage, a technique that gives a good waveform and frequency but a ratio uncertain by roughly 10 percent, which the study states as a limitation on that one quantity. Acquisition used an eight-channel digitizer at 2.5 GS/s and 500 MHz analog bandwidth, with all signal runs double-shielded and the instrument battery-powered inside a shielded enclosure to keep the measurement system from measuring itself. Eighteen disconnector operations were recorded pre-mitigation and twelve post-mitigation. Field Validation Against Simulation
| Quantity | Measured | Simulated | Deviation |
|---|---|---|---|
| TEV peak, bushing flange | 8.4 kV | 7.9 kV | −6.0 percent |
| TEV dominant frequency | 6.1 MHz | 6.4 MHz | +4.9 percent |
| VFTO, bus divider, 2 percent value | 2.11 pu | 2.04 pu | −3.3 percent |
| VFTO dominant frequency | 12.8 MHz | 13.4 MHz | +4.7 percent |
| VFTO rise time | 4.6 ns | 4.1 ns | −10.9 percent |
| Bonding strap peak current | 620 A | 683 A | +10.2 percent |
| Secondary cable induced voltage | 3.1 kV | 2.8 kV | −9.7 percent |
| Restrikes, maximum per operation | 340 | 328 | −3.5 percent |
Every quantity fell inside the acceptance criteria of Section 6.4. The consistent pattern of simulated frequencies slightly above measured and simulated decay slower than measured is the expected signature of a lossless model and confirms the direction of the conservatism rather than undermining it. Post-implementation measurement confirmed TEV at the governing bushing flange of 1.9 kV against a modeled 1.8 kV, and secondary induced voltage of 280 V against a modeled 260 V. Implementation support included the bonding design drawings, the damping resistor technical specification, cable routing drawings, witness of the first bay retrofit, and the specification language added to the Owner's GIS procurement standard. That language requires the supplier to state guaranteed VFTO limits at defined locations, to provide the section geometry needed for an independent VFTO study, to offer damping-resistor disconnectors as a priced option, to state maximum bonding strap length as a design constraint rather than a field decision, and to demonstrate TEV below 2.0 kV at all accessible surfaces during type or site testing.
12. Results and Value Delivered
Outcomes Scorecard
| Outcome | Before | After |
|---|---|---|
| VFTO at transformer terminal | 2.34 pu | 1.62 pu |
| Voltage across first 10 percent of winding | 242 kV | 168 kV |
| TEV at accessible bushing flange | 8.4 kV | 1.9 kV |
| Secondary circuit induced voltage | 3.1 kV | 280 V |
| Protection misoperations, per 14 months | 9 | 0 |
| Personnel shock reports | 3 | 0 |
| Operational restriction on DS operation | In force | Withdrawn |
| GIS procurement specification, VFTO and TEV | Silent | Specified |
Twenty-two months after completion of the retrofit the station has recorded no protection misoperation attributable to switching, no shock report, and no change in transformer dissolved gas trend. The validated model was transferred to the Owner and has since been used to evaluate the two-bay extension at design stage, where a bus arrangement placing a quarter-wave resonance close to the disconnector excitation band was identified on drawings and changed before procurement — at no cost, which is the difference between doing this analysis at design stage and doing it after commissioning.
13. Lessons Learned and Engineering Insights
A grounding system can be fully compliant and completely ineffective. The station's grid met IEEE Std 80 and its bonding met the installation specification. At 6.1 MHz a 10.5-foot bonding strap is a 129 Ω impedance against a 130 Ω enclosure — electrically, not a connection. Grounding adequacy is frequency-dependent, and no power-frequency test will reveal a high-frequency bonding failure. Where GIS is involved, strap length is a dielectric and safety parameter and belongs on the drawing with a maximum dimension, not left to field judgment. The BIL test does not cover the stress that dominates GIS. A 1050 kV BIL demonstrated with a 1.2/50 µs impulse says nothing useful about a 4.6 ns front applied several hundred times per switching operation. Reporting a comfortable margin against BIL for a very-fast-front stress is a category error. IEEE Std 1313.1 defines a separate very-fast-front class precisely because the standard waveforms do not reach it. Single-end shield bonding is a low-frequency practice applied in a high-frequency environment. The rule exists to prevent circulating power-frequency current, a real problem with a better solution — a parallel ground continuity conductor. Leaving a shield open at one end removes its ability to carry the high-frequency return current that would cancel the induced core voltage. Here the difference was 2.2 kV against 640 V from that decision alone. Model bandwidth is a scoping decision, and scoping decisions hide phenomena. The procurement-stage study was competent and correct for the questions it asked. Its time step made VFTO invisible, not small. When a client says a phenomenon was studied and not found, the first question is what time step and what topology, not what result. Mitigate at the source; downstream protection does not work against nanosecond fronts. Surge arresters, the instinctive remedy, are largely ineffective here because their own inductance and separation distance dominate at 12.8 MHz. Damping resistors work because they act at the instant the wave is launched, before any propagation has occurred. As a general principle for very fast transients, every meter between the mitigation and the source costs 3.4 ns of ineffectiveness. The cheapest fix addressed the most serious risk. The bonding rebuild was the least expensive element of the package and it delivered the personnel safety outcome and most of the interference reduction. The expensive element, disconnector replacement, addressed an asset risk that was real but slower-acting. Sequencing mitigation by cost-to-benefit rather than by severity of the headline finding got the shock hazard eliminated months before the retrofit outages began.
14. Keentel Capability Summary
- Very fast transient overvoltage (VFTO) studies for gas-insulated substations at all US transmission voltage classes
- Transient enclosure voltage (TEV) and transient ground potential rise assessment, including personnel exposure evaluation
- Nanosecond-resolution EMT modeling in PSCAD/EMTDC and EMTP, with distributed-parameter GIS section models and spark models for disconnector arcs
- High-frequency transformer modeling from on-site terminal impedance measurement, including initial winding distribution and part-winding resonance screening
- Electromagnetic compatibility assessment of substation secondary systems against IEEE Std C37.90.1 and the IEC 61000-4 series
- Substation grounding and bonding assessment at high frequency, including equipotential mesh design and bonding impedance verification
- Transient recovery voltage verification against IEEE Std C37.06 and IEEE Std C37.011, including terminal fault, short-line fault and out-of-phase duties
- Insulation coordination to IEEE Std 1313.1 and 1313.2 across temporary, switching, lightning and very-fast-front classes
- High-bandwidth field measurement campaigns using capacitive dividers, wideband current transformers and gigasample acquisition, with formal model validation criteria
- Preparation of GIS procurement specification language covering VFTO limits, TEV limits, damping resistor options and bonding design constraints
15. Frequently Asked Questions
Not necessarily, but the absence of symptoms is weak evidence. Two of the three symptom classes here are silent. Transformer winding stress produces no alarm, no trip and no test failure until damage is well advanced. Interference produces symptoms that are usually misattributed — a relay misoperation with no fault is blamed on the relay, and often the relay is replaced. Only the personnel shock is unambiguous, and it depends on someone touching an enclosure at the moment a disconnector operates. The practical screening question is whether you have a transformer connected directly to GIS through an SF6-to-oil bushing, bonding straps longer than about a meter, or secondary cable routed close to enclosure discontinuities. Any of those makes a study worth its cost. None of them makes it urgent.
Because time step is the smaller half of the problem. Reducing the step from 50 µs to 0.5 ns raises the model bandwidth, but bandwidth is useless without topology. A conventional switching model represents the entire GIS as one or two nodes with a lumped capacitance; it has no section-by-section travel times, so there is nothing for a wave to reflect from, and it has no spark model, so there is nothing to launch a wave. Rerun at a nanosecond step it will produce the same smooth answer, faster computation notwithstanding. The rebuild required is dimensional: every section modeled as its own transmission line with its own surge impedance and travel time, which means a physical survey. That survey, not the simulation, is the long pole in the schedule.
Not by the electrocution mechanism, and this distinction matters. A TEV discharge is capacitive, of very low energy, and lasts microseconds; it cannot deliver the current-time product required for ventricular fibrillation. The hazard is the involuntary startle response. A person on a ladder, a platform, a walkway or in the act of handling a tool who receives an unexpected 8 kV discharge may move sharply, and the resulting fall or contact is the injury. That is why the criterion adopted here was a perception-based 2.0 kV rather than an energy-based one, and why the correct response is elimination rather than administrative warning. Treat TEV reports as a serious safety finding and investigate them, but do not let anyone believe the enclosure is lethal, because that misunderstanding leads to the wrong controls.
Because arresters are largely ineffective against a 4.6 ns front. An arrester limits voltage by conducting, and its terminal voltage during conduction includes the inductive drop across its own column and leads. At 12.8 MHz that inductive component dominates. Worse, the separation distance between the arrester and the transformer bushing, negligible at lightning frequencies, becomes a meaningful fraction of a wavelength; the arrester and the equipment it is supposed to protect are no longer at the same voltage. Arresters remain essential for lightning and switching duty and were retained in this station. They simply do not address this mechanism. Damping resistors work because they act at the point and instant the wave is created, before propagation.
Between 150 and 350 per operation on this installation, measured over eighteen operations, with 340 the maximum. Whether each matters depends on which risk you are assessing. For dielectric breakdown, only the largest matters — one restrike at 2.34 pu is the governing event and the other 339 are irrelevant. For cumulative winding ageing and for part-winding resonance the count matters a great deal, because the burst envelope of several hundred steps has spectral energy in the 100 to 700 kHz band where the winding resonates, and no single step does. For interference, count matters because each restrike is another chance to disturb a relay, and a station switching frequently is exposed proportionally more often.
It is a defensible generalization and it was wrong here. VFTO in per unit is largely independent of voltage class, because it is set by trapped charge and reflection geometry, not by system voltage. What changes with voltage class is the ratio of BIL to peak operating voltage, which is more generous at lower classes, so a given per-unit VFTO consumes less of the available insulation margin at 345 kV than at 550 kV. That reasoning holds for gas-insulated equipment. It does not hold for a transformer winding, where the concern is the non-uniform initial distribution across the line-end turns and the excitation of part-winding resonance — neither of which scales with BIL margin. Where a transformer is directly connected to GIS, evaluate VFTO regardless of voltage class.
It is a resistor in series with an auxiliary contact that makes before the main disconnector contact and parts after it, so every strike passes through the resistor rather than through a bare arc. The resistor damps the traveling wave at the instant of launch, before it has propagated anywhere. The value is chosen relative to the bus surge impedance: too low and it does not damp; too high and it does not allow the section to charge, so the main contact still strikes hard. Values between three and ten times the bus surge impedance are typical, and with a 62 Ω bus the modeled optimum was between 400 and 700 Ω. Five hundred ohms was selected as a standard available value near the middle of that band, giving 1.62 pu against 1.59 pu at the theoretical optimum.
It will produce circulating power-frequency current in the shield, which is the reason the single-end practice exists. The correct solution is not to accept high-frequency exposure but to give the low-frequency current a better path: a parallel ground continuity conductor, typically 4/0 AWG or larger, run alongside the cable between the same two bonding points. It carries the power-frequency current at far lower impedance than the shield, reducing shield current to a small fraction, while the shield remains bonded at both ends and free to carry the high-frequency return current that cancels the induced core voltage. IEEE Std 525 supports this arrangement. In this station it took induced voltage from 2.2 kV to 640 V, and rerouting took it to 280 V.
With difficulty and with discipline. A 4.6 ns rise time requires roughly 80 MHz of bandwidth to reproduce faithfully and comfortably more to be sure. We used capacitive dividers mounted directly on the enclosure surface with the shortest possible low-voltage arm, wideband current transformers on bonding straps, and a 500 MHz digitizer at 2.5 GS/s. The measurement system is itself in the interference field, so the instrument was battery-powered inside a shielded enclosure with double-shielded signal runs, and a null channel with a shorted input was recorded on every shot to confirm the instrument was not measuring its own pickup. Any campaign without a null channel should be treated with suspicion.
Set it in writing before the measurement, and set it separately for magnitude, frequency and rise time, because they validate different parts of the model. We used ±15 percent on peak values, ±10 percent on dominant frequency and ±20 percent on rise time, agreed with the Owner at kickoff. Frequency is the tightest because it validates geometry, which should be nearly exact if the survey was done properly; a frequency error above 10 percent means a dimension is wrong. Rise time is the loosest because it depends on assumed spark parameters and on measurement bandwidth. Peak sits between. The client should agree these before any data is taken, otherwise the criterion becomes negotiable after the fact and the validation is worthless.
Fourteen to twenty-two weeks, driven by outage access rather than by analysis. We need GIS general arrangement drawings with dimensions, and expect to survey them anyway. We need conductor and enclosure diameters for every section type, disconnector contact speed and stroke, transformer test reports with terminal capacitance data if it exists, bushing capacitance, the enclosure bonding arrangement as installed rather than as drawn, secondary cable routing and shield bonding practice, and protection misoperation records. We need an outage to measure transformer terminal impedance and to install dividers at a spare flange, and we need to record a set of disconnector operations. Assume your bonding drawings are wrong until surveyed; in this study fourteen of ninety-six bonds were not as drawn.
Five things, none of which appear in most US GIS specifications. First, require the supplier to state guaranteed VFTO limits in per unit at defined locations, particularly any transformer terminal. Second, require the section geometry data needed for an independent VFTO study to be delivered as part of the design submittal. Third, require damping-resistor disconnectors to be offered as a priced option so the decision is commercial rather than technical-by-default. Fourth, state maximum bonding strap length as a numerical design constraint on the drawings, not as a field practice. Fifth, require demonstration of TEV below a stated limit at all accessible surfaces during site testing. Adding these at tender costs nothing. Retrofitting them, as this study shows, is a seven-figure exercise.
No standard names VFTO or TEV, and none requires the study directly. The obligations are indirect and real. NERC PRC-004 requires misoperations to be identified and corrected, and a misoperation whose cause is electromagnetic interference is not corrected by replacing the relay; closing those events honestly requires finding the mechanism. NERC FAC-008 requires facility ratings consistent with equipment ratings, which is difficult to assert for equipment repeatedly stressed outside the waveform envelope in which its rating was demonstrated. NERC TPL-001 planning performance presumes equipment survives. On the safety side, OSHA 1910.269 and NFPA 70E carry general obligations that a documented, repeatable shock hazard engages. The compliance case for the study is built from those, not from a clause naming the phenomenon.
16. Glossary of Terms and Abbreviations
| Term | Definition |
|---|---|
| BIL | Basic lightning impulse insulation level, demonstrated with a 1.2/50 µs waveform |
| Bonding strap | Conductor connecting a GIS enclosure section to the station ground grid |
| Capacitive divider | High-bandwidth voltage measurement device using a capacitive ratio arm |
| Damping resistor | Resistor in series with an auxiliary disconnector contact, damping the wave at launch |
| Disconnector (DS) | Isolating switch with slow-moving contacts and limited interrupting capability |
| Distributed-parameter model | Transmission-line representation defined by surge impedance and travel time |
| EMT | Electromagnetic transient, and by extension the class of time-domain simulation tools |
| Enclosure | Grounded metallic outer conductor of a gas-insulated bus |
| Equipotential mesh | Bonded conductive grid under accessible surfaces, limiting voltage between contact points |
| Ferrite ring | Magnetic core fitted around an enclosure or cable, adding high-frequency series impedance |
| GCC | Ground continuity conductor, run parallel to a cable to carry low-frequency return current |
| GIS | Gas-insulated substation, SF6-insulated coaxial metal-enclosed equipment |
| Initial voltage distribution | Capacitively determined voltage profile along a winding immediately after a step |
| Part-winding resonance | Resonance of a section of a transformer winding, excited by specific frequency content |
| Prestrike | Breakdown of a closing contact gap before the contacts touch |
| Restrike | Reignition of an opening contact gap after current interruption |
| RRRV | Rate of rise of recovery voltage across a circuit breaker after interruption |
| Spark model | Time-varying resistance representation of an arc, with nanosecond-scale collapse |
| Surge impedance | Ratio of voltage to current for a traveling wave on a transmission structure |
| SWC | Surge withstand capability, the immunity qualification of IEEE Std C37.90.1 |
| TEV | Transient enclosure voltage, high-frequency voltage on an enclosure exterior to remote earth |
| Trapped charge | Residual voltage remaining on an isolated section after a strike extinguishes |
| Travel time | Time for a wave to traverse a section, 3.40 ns per meter in gas-insulated bus |
| TRV | Transient recovery voltage appearing across breaker contacts after interruption |
| VFTO | Very fast transient overvoltage, internal to a GIS, with a nanosecond-scale front |
| Very-fast-front class | Overvoltage class of IEEE Std 1313.1 not covered by standard impulse test waveforms |
17. Confidentiality and Use Statement
This case study has been prepared for informational purposes. All client identities, project locations, contract details, and proprietary data have been withheld or generalized. Technical parameters, study results, and figures presented are representative of work performed by Keentel Engineering Solutions and have been adapted so that no individual project, owner, or facility can be identified. Nothing in this document constitutes a design recommendation for any specific installation. Any reuse of the methodologies described requires project-specific engineering analysis by a qualified professional engineer.