Part A — Power Plant Controllers at a Glance
A modern solar, wind or battery plant is not one machine. It is dozens or hundreds of inverters spread across a site, tied together by a 34.5 kV collector system and connected to the transmission grid through one or more main power transformers. Each inverter can control its own current very quickly, but none of them can see the point of interconnection (POI), where the transmission owner and the independent system operator (ISO) measure the plant's performance.
The power plant controller (PPC) closes that gap. It measures voltage, current, power and frequency at the POI, compares them with setpoints from the transmission owner, the ISO or the owner's energy management system, and sends commands to every inverter, battery, capacitor bank, reactor and static compensator in the plant, so that the plant behaves like a single, well-controlled generator.
In the United States, that controller has to satisfy a layered set of requirements:
• FERC rules that every new non-synchronous generator must provide reactive power (Order No. 827) and primary frequency response (Order No. 842).
• IEEE Std 2800-2022 for transmission-connected inverter-based resources (IBRs), which many transmission owners and ISOs now reference in their interconnection requirements, with IEEE Std 2800.2-2026 setting out how conformity is tested and verified.
• IEEE Std 1547-2018 and UL 1741 SB for distribution-connected resources.
• NERC Reliability Standards for model verification (MOD-026-2, MOD-027, MOD-025, MOD-032), voltage control (VAR-002), ride-through (PRC-029-1), disturbance monitoring (PRC-028-1) and cybersecurity (the CIP standards).
• ISO tariffs and business practices for telemetry, dispatch, automatic generation control (AGC), ramp limits and testing.
The transmission owner will ask for proof that the plant meets these requirements, and it will ask early: models with the interconnection request, settings and test plans before energization, and test results before commercial operation. Plants that design the controller around that proof from the start avoid months of delay at the end.
The plant used in this guide
Keentel Engineering uses one illustrative hybrid plant throughout, so that the worked examples connect.
| Item | Value |
|---|---|
| Generation | 200 MW (AC) solar PV, 220 MVA of inverters |
| Storage | 100 MW / 400 MWh battery energy storage system (BESS), 110 MVA of inverters |
| Interconnection service | 200 MW export at the POI (hybrid with a shared export limit) |
| Collector system | 34.5 kV, eight feeders, underground cable |
| Main power transformer (MPT) | 230/34.5 kV, 210 MVA top rating, 10% impedance, on-load tap changer (LTC) |
| POI | 230 kV, three-phase short-circuit strength 2,000 MVA (short-circuit ratio 10) |
| Reactive requirement | 0.95 power factor leading and lagging at the POI (±65.7 Mvar at 200 MW) |
| Frequency response | 5% droop, ±0.036 Hz deadband |
| Ramp-rate limit | 10% of rated output per minute (20 MW/min) |
| Telemetry | DNP3 to the transmission owner's RTU and the ISO's telemetry gateway |
What Keentel's analysis shows

| Result | Value |
|---|---|
| Reactive power required at the POI at 200 MW | ±65.7 Mvar |
| Reactive power the inverters must supply to deliver +65.7 Mvar at the POI | about 96 Mvar (collector, transformer losses outweigh cable charging by about 30 Mvar) |
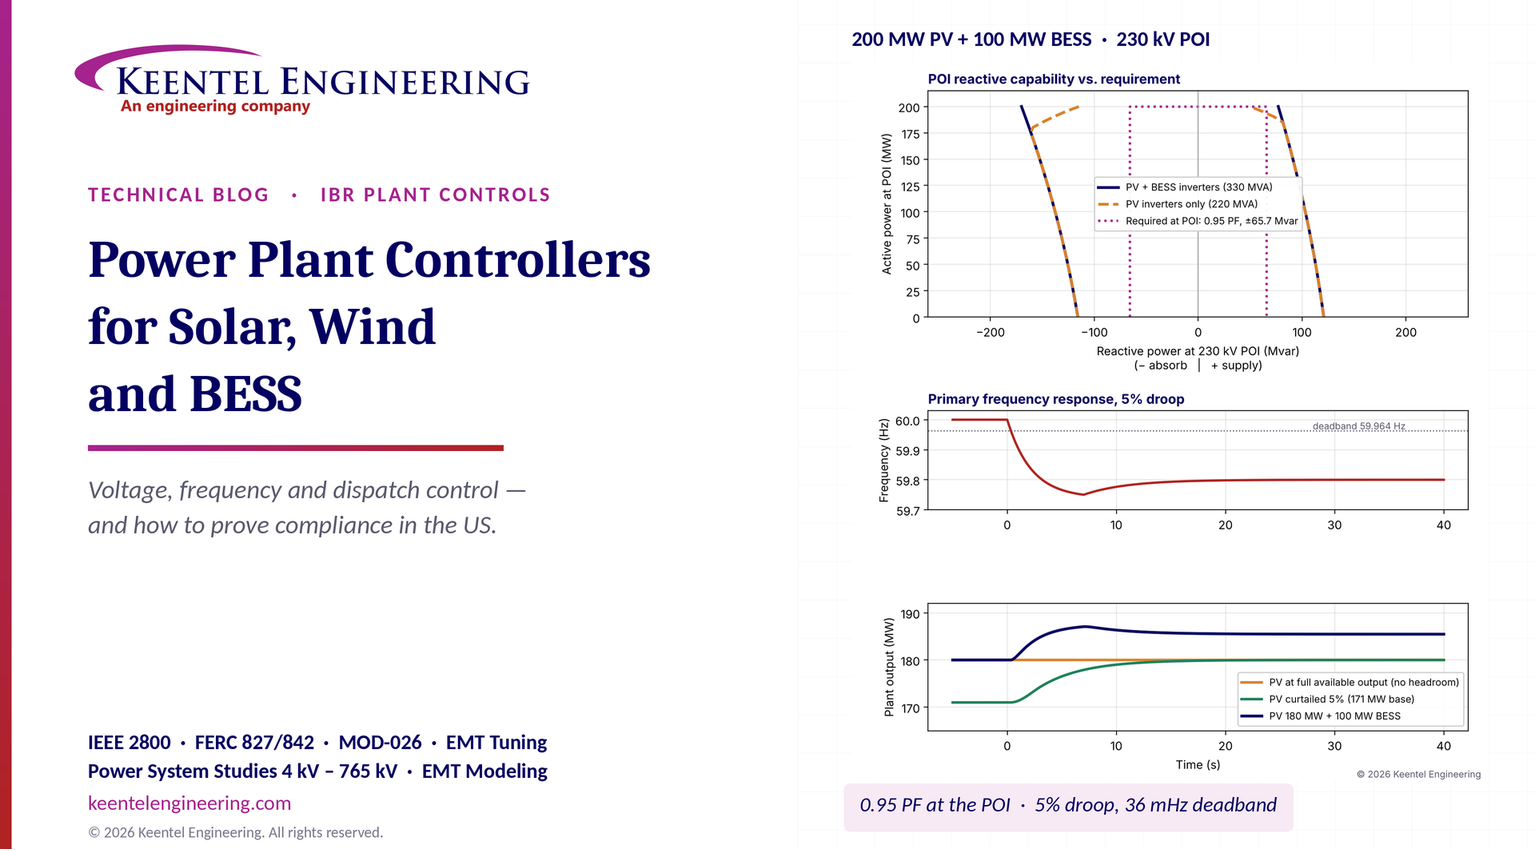
| PV inverters alone, at 200 MW | +50 Mvar at the POI: short by about 16 Mvar |
| PV plus BESS inverters, at 200 MW | +77 Mvar at the POI: meets the requirement |
| Inverter terminal voltage when exporting 65.7 Mvar | 1.09 pu: inside a 1.10 pu limit with almost no margin, so the MPT tap position matters |
| Voltage droop response to a 1% voltage dip (4% droop) | +16.4 Mvar |
| PV-only response to 59.80 Hz at full output | 0 MW (no headroom) |
| PV plus 100 MW BESS response to 59.80 Hz | +5.5 MW sustained, +7.1 MW at the 59.75 Hz nadir |
| BESS energy to hold a 20 MW/min ramp limit through a 120 MW cloud drop | about 5.0 MWh |
| Voltage-control phase margin with a 0.5 s loop delay, tuned at SCR 10 | 76°; falls to 42° at SCR 3 and 18° at SCR 2 |
Five lessons
• Reactive power is measured at the POI, not at the inverters. Collector and transformer losses consume about a third of the plant's reactive output at full power. A plant whose inverters "meet 0.95 power factor" may fail at the POI.
• Voltage limits inside the plant are as important as MVA limits. Supplying reactive power raises the inverter terminal voltage. Without careful MPT tap selection and LTC coordination, the plant runs out of voltage margin before it runs out of current.
• Frequency response needs headroom. FERC Order No. 842 does not require a plant to hold back output, so a PV plant at full output cannot respond to low frequency. A co-located battery, or a deliberate curtailment, provides the response.
• Loop timing and grid strength decide stability. The same controller gains that are well damped on a strong grid can oscillate on a weak one. Latency, filtering and gain must be tuned for the actual short-circuit ratio and validated in EMT.
• Loop timing and
• Compliance is proved with models and tests, not certificates. US transmission owners rely on validated models, IEEE 2800.2 conformity evidence and commissioning tests. Plan the evidence package at the start of the project.
Engineering review of common statements about plant controllers
| Statement often heard | Keentel's check |
|---|---|
| "Plants on medium, high and extra-high voltage must support the grid." | True in spirit, but in the US the obligation depends on the connection. Transmission-connected IBRs follow the transmission owner's requirements, increasingly based on IEEE 2800-2022, plus FERC Orders No. 827 and 842 and NERC standards. Distribution-connected resources follow IEEE 1547-2018 and the utility's tariff. Some European grid codes, such as the German VDE-AR-N rules, are not US requirements. |
| "The controller is certified to the grid code, so the plant complies." | Component certificates are a European practice. US transmission owners judge the plant as built: a validated model, IEEE 2800.2 conformity evidence (design evaluation, as-built evaluation and commissioning tests) and NERC model verification. A pre-tested controller helps, but it does not replace plant-level proof. |
| "Active power control is for frequency; reactive power control is for voltage." | Broadly correct. In US practice the PPC also handles curtailment, ramp-rate limits, AGC regulation, BESS state-of-charge management, capacitor and reactor switching and LTC coordination. |
| "The telecontrol link uses IEC 60870-5-104." | Common in Europe, rare in the US. US transmission owners and ISOs use DNP3 (IEEE Std 1815) to remote terminal units, ICCP between control centers and IEC 61850 inside substations. |
| "The PPC makes the plant ride through faults." | No. Ride-through (NERC PRC-029-1, IEEE 2800 Clause 7) happens in milliseconds and is an inverter function. The PPC must not fight the inverters' fault response, and it must resume control smoothly afterwards. |
| "Have the compliance proof ready early." | Correct, and more important under FERC Order No. 2023. Interconnection studies need validated RMS and EMT models of the plant controller, and late model changes can trigger restudy. |
Part B — Technical Guide: Designing, Tuning and Proving a Power Plant Controller
1. What a power plant controller does — and what it does not
The easiest way to understand a PPC is to place it in a hierarchy of control layers, each with its own speed and purpose.
| Layer | Typical speed | What it controls | Who sets the target |
|---|---|---|---|
| Inverter current control | Microseconds to milliseconds | Phase currents, switching, fault current, ride-through | Inverter firmware and settings |
| Inverter local functions | Tens to hundreds of milliseconds | Momentary voltage and frequency response, protection, reactive current during faults | Inverter settings approved by the transmission owner |
| Power plant controller | Hundreds of milliseconds to seconds | POI voltage, reactive power, power factor, active power, ramp rate, frequency response | Transmission owner, ISO, plant owner |
| Plant SCADA and energy management | Seconds to minutes | Dispatch schedules, BESS state of charge, alarms, data | Plant owner, qualified scheduling entity |
| ISO dispatch and AGC | 4 seconds to 5 minutes | Basepoints, regulation signals, curtailment | ISO or balancing authority |
The PPC sits in the middle. It is fast enough to hold POI voltage steady through normal grid changes, but deliberately slower than the inverters, so that it does not interfere with their response to faults. During a fault, the inverters ride through on their own; the PPC freezes or limits its integrators, then resumes smoothly when voltage recovers.
A well-designed PPC therefore has four jobs:
• Measure the plant's output where it is judged: at the POI, or at the high side of the MPT, depending on the interconnection agreement.
• Regulate voltage, reactive power and active power to the requested values, within ramp and capability limits.
• Coordinate every controllable device in the plant: inverters, BESS, capacitor banks, reactors, static compensators and the MPT tap changer.
• Communicate with the transmission owner, the ISO and the owner's systems, securely and with known timing.
2. The US requirements map
The first engineering decision is which requirements apply. The answer depends on where the plant connects and which ISO or balancing authority it serves.
| Requirement source | Applies to | What it means for the PPC |
|---|---|---|
| FERC Order No. 827 (2016) | New non-synchronous generators under FERC-jurisdictional interconnection agreements | Dynamic reactive capability of 0.95 leading to 0.95 lagging at the high side of the generator substation, with no compensation for that capability as a condition of interconnection |
| FERC Order No. 842 (2018) | Newly interconnecting large and small generating facilities, including non-synchronous | Primary frequency response capability with a maximum ±0.036 Hz deadband and a maximum 5% droop, sustained response, no obligation to hold headroom |
| FERC Order No. 2023 (2023) | Interconnection queue process | Cluster studies, firm study timelines, readiness deposits, model requirements, consideration of grid-forming and advanced technologies |
| FERC Order No. 901 (2023) | NERC standards development for IBRs | Directed new standards for IBR data sharing, model validation, performance and ride-through |
| IEEE Std 2800-2022 | Transmission and sub-transmission connected IBRs, when adopted by the transmission owner or ISO | Reactive power capability, voltage and frequency control performance, ride-through, power quality, measurement location (reference point of applicability) |
| IEEE Std 2800.2-2026 | Conformity assessment for IEEE 2800 | Test and verification procedures: design evaluation, as-built installation evaluation, commissioning tests and post-commissioning monitoring |
| IEEE Std 1547-2018 and 1547.1-2020, UL 1741 SB | Distribution-connected DER | Volt-var, volt-watt, frequency-watt, ride-through and interoperability (IEEE 2030.5, SunSpec Modbus, DNP3) |
| NERC MOD-025-2 | Generator Owners of BES generators | Verification of real and reactive capability by test or operating data |
| NERC MOD-026-2 and MOD-027 | Generator Owners | Verification of models, including the plant-level controller, against test or disturbance data |
| NERC MOD-032 | Planning Coordinators and data providers | Submission of steady-state, dynamic and short-circuit modeling data |
| NERC VAR-002 | Generator Operators | Operate in automatic voltage control mode, follow the transmission operator's voltage schedule, report status changes |
| NERC PRC-028-1, PRC-029-1, PRC-030-1 | Generator Owners of IBRs | Disturbance monitoring, ride-through and analysis of unexpected output changes |
| NERC CIP-002 to CIP-015 | Registered entities with BES Cyber Systems | Cybersecurity of the PPC, SCADA and telemetry |
| ISO tariffs and manuals (ERCOT, CAISO, PJM, MISO, SPP, NYISO, ISO-NE) | Resources in each market | Telemetry points and scan rates, AGC and regulation, ramp limits, voltage schedules, testing |
Two notes save a lot of confusion later:
Measurement location matters. Order No. 827 measures reactive capability at the high side of the generator substation. IEEE 2800 uses the reference point of applicability (RPA), which is normally the POI but can be defined differently. Interconnection agreements sometimes specify yet another point. The PPC's metering must match the contractual point.
Requirements are not retroactive by default. Order No. 842 applies to newly interconnecting facilities, and IEEE 2800 applies where a transmission owner adopts it for new interconnections. Existing plants keep their original requirements unless they are materially modified.
3. Architecture of a power plant controller
3.1 Measurement at the POI
Everything the PPC does depends on its measurements. At a 230 kV POI the controller normally uses dedicated metering-class instrument transformers or a high-accuracy revenue or power-quality meter connected to them.
| Element | Typical US specification |
|---|---|
| Voltage transformers | IEEE Std C57.13 accuracy class 0.3 (metering) |
| Current transformers | IEEE Std C57.13 class 0.3 or better, sized so normal load is in the accurate range |
| Revenue meter | ANSI C12.20 accuracy class 0.2 |
| Measurement update | 50–100 ms RMS values, synchronized to GPS time |
| Redundancy | Second meter or relay-derived measurement as backup, with automatic changeover |
Measurement errors flow straight into compliance. A 0.5% voltage error looks small, but at 4% droop it shifts the reactive output by about 12% of the plant's range.
3.2 The controller itself
The PPC is usually an industrial controller or a substation-hardened computer running deterministic control loops at 20–100 ms. Good designs include:
• Hot-standby redundancy, with automatic changeover that does not bump the plant's output.
• A defined fallback mode. If the PPC fails, the inverters revert to a safe local setting, such as constant power factor or a fixed reactive setpoint agreed with the transmission owner.
• Time synchronization to GPS or a precision time protocol grandmaster, so that its logs line up with PRC-028-1 disturbance records.
• Event and trend logging of every setpoint change, mode change and limit hit.
3.3 The plant network
Inside the plant, the PPC sends commands to inverters and other devices over one or more networks:
• Inverter communications, often Modbus TCP with SunSpec information models, or a vendor protocol. Polling large fleets one inverter at a time adds delay, so faster designs use broadcast or multicast setpoints, or a deterministic industrial Ethernet fieldbus to field gateways.
• Substation devices, such as relays, capacitor bank controllers and the LTC controller, often over IEC 61850 (MMS and GOOSE) or DNP3.
• Fiber rings across the site, with managed switches and defined recovery times.
3.4 External interfaces
| Interface | Typical US protocol | Purpose |
|---|---|---|
| Transmission owner RTU | DNP3 (IEEE Std 1815), sometimes with Secure Authentication | Voltage schedule, breaker status, POI telemetry |
| ISO telemetry and AGC | DNP3 or ICCP through the qualified scheduling entity's control center | Basepoints, regulation, curtailment, telemetry at 2–4 second scan rates |
| Owner's operations center | DNP3, Modbus TCP or OPC UA over a secured WAN | Monitoring, dispatch, BESS scheduling, alarms |
| Market and trading systems | Secure application interfaces | Schedules and bids, never direct control of setpoints without the PPC's limits |
3.5 Other controllable devices
A PPC rarely controls only inverters. Most transmission-connected plants also coordinate:
• Switched capacitor banks and reactors on the 34.5 kV bus, used to shift the plant's reactive range or offset cable charging at night.
• A STATCOM or synchronous condenser, where the inverters cannot meet the dynamic requirement alone or where the grid is weak.
• The MPT on-load tap changer, which keeps the inverter terminal voltage inside its limits while the POI voltage follows the schedule.
The rule of thumb is that fast devices (inverters, STATCOM) regulate continuously, while slow devices (capacitor banks, reactors, LTC) are switched occasionally to bring the fast devices back toward the middle of their range, so that dynamic reserve is always available.
4. Voltage and reactive power control
4.1 Control modes
Transmission owners normally specify which mode the plant must run in and which setpoint it must follow. The PPC should support all of the common modes and switch between them without a bump in output.
| Mode | What is held constant | Typical use |
|---|---|---|
| Voltage control with droop | POI voltage, with reactive output proportional to voltage deviation | Default for transmission-connected plants under VAR-002 voltage schedules |
| Voltage control without droop (isochronous) | POI voltage exactly | Rare; can cause plants to fight each other on the same bus |
| Reactive power setpoint | Mvar at the POI | Studies, testing, or operator instruction |
| Power factor | Ratio of P to S at the POI | Common at distribution level and in some older agreements |
| Volt-var curve | Reactive output as a function of local voltage | IEEE 1547 distribution resources |
4.2 Why droop is used
Two plants on the same bus that both try to hold exactly the same voltage will fight, because their measurements are never identical. A droop (also called reactive current compensation or line-drop compensation) shares the reactive load in a predictable way. The PPC's reactive command is:

where D is the droop, expressed as the per-unit voltage change that moves the plant from zero to its full reactive capability Qmax. A 4% droop means a 4% voltage deviation produces the plant's full reactive output.
Worked example 1 — voltage droop response
The 200 MW plant has Qmax = 65.7 Mvar and a 4% droop. A nearby line trips and the POI voltage falls by 1% (from 1.000 to 0.990 pu).

The plant supplies an additional 16.4 Mvar, a quarter of its range. A 4% dip would call for the full 65.7 Mvar; anything larger is limited by capability. With 2% droop the same 1% dip would call for 32.9 Mvar, a stiffer response but less margin for sharing with neighbouring plants.
Practical guidance. Agree the droop value and the voltage reference source with the transmission owner. Some owners specify droop on the plant's capability; others specify it on its MW rating. A mismatch between the PPC's definition and the study model is one of the most common reasons MOD-026 verification fails.
4.3 Reactive capability at the POI, not at the inverters
FERC Order No. 827 requires 0.95 leading and lagging at the high side of the generator substation, so at 200 MW:

The inverters must also make up the reactive power consumed inside the plant. Current flowing through the MPT, the collector cables and the inverter step-up transformers absorbs reactive power, while the cable capacitance supplies some back:

Worked example 2 — reactive capability of the 200 MW plant
Keentel modeled the plant on a 100 MVA base with the MPT at 10% on 210 MVA (0.048 pu), an aggregated collector reactance of 0.012 pu, aggregated inverter transformers at 6% on 240 MVA (0.025 pu) and about 6 Mvar of cable charging.
At 200 MW and +65.7 Mvar at the POI, the current is about 2.1 pu, so:

| Quantity | Supplying 65.7 Mvar (lagging) | Absorbing 65.7 Mvar (leading) |
|---|---|---|
| Reactive power at the POI | +65.7 Mvar | −65.7 Mvar |
| Active power at inverters | 205.5 MW | 205.7 MW |
| Reactive power at inverters | +96.4 Mvar | −33.7 Mvar |
| Apparent power at inverters | 227 MVA | 209 MVA |
| 34.5 kV bus voltage | 1.038 pu | 0.976 pu |
| Inverter terminal voltage | 1.091 pu | 0.984 pu |
Three conclusions follow:
The MVA check. The PV inverters are rated 220 MVA, but the lagging case needs 227 MVA. On their own they deliver only about +50 Mvar at the POI at full output — 16 Mvar short. The plant meets the requirement only because the 110 MVA of BESS inverters can supply reactive power too. That must be designed into the PPC's dispatch logic and the interconnection agreement, including what happens when the BESS is out of service.
The voltage check. Supplying reactive power raises the inverter terminal voltage to 1.09 pu. Most inverters are rated for continuous operation up to 1.10 pu, so there is almost no margin. A one-step LTC adjustment on the MPT (typically 0.625% per step) restores margin, which is why the PPC should coordinate the tap changer.
The asymmetry. Absorbing reactive power is easier at full output, because the plant's own I²X losses help. At night, the situation reverses: cable charging pushes reactive power into the grid when the plant is idle, which is why many plants add a shunt reactor or keep inverters available for night-time reactive control.
4.4 Coordinating the tap changer, capacitor banks and reactors
A practical coordination scheme looks like this:
• Fast loop. The PPC regulates POI voltage with the inverters (and any STATCOM) every 50–200 ms.
• Slow loop. If the inverter reactive output stays above, say, 60% of its range for longer than 30–60 seconds, the PPC switches in a capacitor bank or out a reactor to restore dynamic reserve.
• Tap changer. The LTC keeps the 34.5 kV bus inside a band that protects inverter terminal voltage. Its time delay (often 30–60 s) is set longer than the PPC's response so that the two do not hunt.
• Interlocks. Capacitor switching is blocked during voltage disturbances and ramp events, and minimum discharge times are respected.
4.5 Response time expectations
IEEE 2800-2022 requires transmission-connected IBR plants to provide voltage, reactive power and power-factor control at the reference point of applicability, with dynamic performance characterized by step response and settling times that the transmission owner selects from ranges in the standard. Many transmission owners ask for a closed-loop response in the order of one to a few seconds for a voltage step at the POI, with little or no overshoot. Confirm the exact values, and the test method, with the transmission owner before tuning.
5. Active power control
5.1 Functions
• The PPC's active-power functions include:
• Curtailment and export limits. Holding POI output at or below the interconnection service limit or an ISO dispatch instruction. In hybrid plants the PPC must manage the shared limit, so that PV and BESS together never exceed it.
• Ramp-rate limits. Limiting the rate of change of output in both directions, both for normal starts and stops and for cloud or wind changes where the ISO or transmission owner requires it.
• AGC and regulation. Following ISO basepoints and regulation signals, typically every 2 to 4 seconds.
• BESS charge and discharge schedules, with state-of-charge limits.
5.2 Ramp-rate limits with storage
A PV plant can reduce output on its own (by curtailing), but it cannot increase output faster than the sun allows, and it cannot slow a cloud-driven drop without storage. A co-located BESS fills the gap.
Worked example 3 — holding a 10%-per-minute ramp limit through a cloud
The plant is exporting 200 MW from PV. A cloud bank cuts PV output by 120 MW over 60 seconds. The ramp limit is 10% of 200 MW per minute, or 20 MW/min.
Without storage, the POI output would fall at 120 MW/min — six times the limit. With storage, the PPC lets the POI output fall at 20 MW/min, and the battery makes up the difference:
At t = 60 s, PV is down 120 MW but the POI may be down only 20 MW, so the BESS is discharging 100 MW.
The POI output then continues down at 20 MW/min, so the BESS output falls linearly to zero over the next 5 minutes.

The energy is small (about 1.25% of a 400 MWh battery), but the power is large: the BESS must be able to deliver 100 MW in under a minute, and the PPC must reserve that power and state of charge. Upward ramps are handled by curtailing PV, which costs energy rather than storage.
6. Primary frequency response
6.1 The FERC requirement
• FERC Order No. 842 requires newly interconnecting generating facilities, including solar, wind and storage, to have equipment capable of primary frequency response with:
• a deadband no wider than ±0.036 Hz;
• a droop no greater than 5%, based on nameplate capacity;
• a timely and sustained response, without an obligation to hold back output (headroom) to provide upward response;
• response to both under-frequency and over-frequency, with storage responding within its operating range.
The droop response is calculated from the frequency deviation outside the deadband:

where fdb is the deadband (0.036 Hz), f0 is 60 Hz and R is the droop (0.05). The response is continuous from the edge of the deadband, with no step.
Worked example 4 — response to a frequency decline to 59.80 Hz
The frequency falls to 59.80 Hz, a deviation of 0.200 Hz, of which 0.164 Hz is outside the deadband.


| Plant condition | Response at 59.80 Hz | Why |
|---|---|---|
| PV at full available output | 0 MW | No headroom; Order No. 842 does not require any |
| PV curtailed 5% (171 MW with 180 MW available) | up to 9 MW | Limited by the 9 MW of headroom, and by the inverter and PPC response time |
| PV at full output plus 100 MW BESS | +5.5 MW sustained, about 7.1 MW at the 59.75 Hz nadir | The battery responds within its operating range |
| Any IBR during over-frequency (60.20 Hz) | −10.9 MW for the PV plant | Over-frequency response reduces output and needs no headroom |
The right-hand panels of Figure 1 show these responses. The BESS also responds faster: inverters can change output in a few hundred milliseconds, while a PPC-mediated PV response often takes several seconds, set by the controller's ramp and the inverters' power ramp limits.
6.2 Fast frequency response and regional rules
Some regions go further. ERCOT's BAL-001-TRE-2 regional standard sets primary frequency response performance measures for generating units, and its ancillary-service markets include fast frequency response products that batteries commonly provide. Other ISOs are developing similar requirements as inertia declines. The PPC must implement whichever droop, deadband and response time the region requires, and it must not undo the inverter's local frequency response with a slow plant-level correction.
Practical guidance. Decide where frequency response is implemented: in the inverters (fast, but harder to coordinate at plant level), in the PPC (coordinated, but slower) or in both, with the PPC adding a slow trim. Test it with a simulated frequency offset during commissioning, because real grid frequency rarely moves enough during a test window.
7. Dynamics, timing and stability
7.1 The latency budget
A PPC is a feedback controller with delays in the loop: measurement filtering, the controller's own cycle, communication to the inverters, and the inverters' response. The total delay sets how fast the loop can be tuned before it becomes oscillatory.
Worked example 5 — two communication designs
The plant has about 50 PV inverters and 25 BESS inverters. Keentel compared two designs for sending reactive-power setpoints.
| Delay component | Design A: polled Modbus TCP, one inverter at a time | Design B: broadcast setpoints over a deterministic fieldbus to field gateways |
|---|---|---|
| POI measurement and filtering | 100 ms | 100 ms |
| PPC control cycle | 100 ms | 100 ms |
| Setpoint distribution | 75 × 15 ms = 1,125 ms | about 20 ms |
| Inverter response to new setpoint | 200 ms | 200 ms |
| Total, last inverter | about 1.5 s | about 0.4 s |
In Design A the last inverter receives its command more than a second after the first, so the plant's response is staggered and the effective loop delay is long. If the transmission owner expects a closed-loop response of around one second, Design A cannot meet it however the gains are set. Design B leaves room for tuning. The lesson is to specify the communication architecture as part of the performance requirement, not as an afterthought.
7.2 Grid strength and controller gain
The sensitivity of POI voltage to the plant's reactive output depends on grid strength. A simple approximation is:

where Ssc is the three-phase short-circuit capacity at the POI in MVA, and ΔV is in per unit. The short-circuit ratio is SCR = Ssc / Prated.
| POI strength | SCR | ΔV per Mvar | ΔV for the full ±65.7 Mvar |
|---|---|---|---|
| 2,000 MVA | 10 | 0.05% | 3.3% |
| 600 MVA | 3 | 0.17% | 11.0% |
| 400 MVA | 2 | 0.25% | 16.4% |
The same controller therefore has three to five times more loop gain on a weak grid than on a strong one.
Worked example 6 — phase margin versus grid strength
Treat the voltage loop as an integrating controller with a pure delay Td. Its open-loop transfer function is approximately:

The crossover frequency is about ωc = K, and the phase margin is:

The gain is tuned to K = 0.5 rad/s at SCR 10, with a total loop delay of 0.5 s.
| Grid condition | Effective gain K | Phase margin |
|---|---|---|
| SCR 10 (as tuned) | 0.50 rad/s | 76° |
| SCR 3 (outage of a nearby line) | 1.67 rad/s | 42° |
| SCR 2 (weak contingency) | 2.50 rad/s | 18° |
At 18° the voltage loop rings badly and can interact with neighbouring plants and with the inverters' own controls. Real tuning should use EMT simulation, but the trend is reliable. The remedies are to tune for the weakest credible grid, use adaptive gain scheduling based on measured or estimated short-circuit strength, reduce loop delay, and coordinate with other plants on the same bus.
7.3 Oscillations seen in the field
NERC and ISO event reviews have documented sustained voltage and power oscillations at IBR plants, often in the 0.1 Hz to several hertz range, traced to plant controller tuning, weak grid conditions or interaction between nearby plants. Common causes include:
• PPC voltage-loop gains too high for the actual short-circuit ratio;
• inverters running a fast local volt-var function while the PPC also regulates voltage, so the two loops fight;
• slow, polled communications that add delay;
• capacitor or tap changer switching without proper deadbands.
The fix starts with the data. PRC-028-1 dynamic disturbance recordings at 60 records per second, plus PPC logs, show whether the oscillation originates inside the plant.
8. Battery state-of-charge management
A battery can only provide a service in a given direction if it has energy available in that direction. The PPC's energy management function must reserve state of charge (SOC) for each committed service.
Worked example 7 — SOC reserve for the 100 MW / 400 MWh BESS
Assume the battery's usable window is 10% to 90% SOC (320 MWh) and the plant is committed to:
• regulation of ±30 MW, with a worst-case one-directional energy of about 30% of the band for one hour (9 MWh);
• primary frequency response to a sustained 59.50 Hz event for 30 minutes;
• ramp-rate support of 5 MWh (Worked example 3).
The frequency response at 59.50 Hz is:

which for 30 minutes is 7.7 MWh.
| Direction | Services | Energy reserved | SOC limit |
|---|---|---|---|
| Discharge (upward) | Regulation 9 MWh + frequency response 7.7 MWh + ramp support 5 MWh | 21.7 MWh | Do not schedule below about 15.4% |
| Charge (downward) | Regulation 9 MWh + over-frequency response 7.7 MWh | 16.7 MWh | Do not schedule above about 85.8% |
The usable window for energy arbitrage shrinks from 80% to about 70% of the battery. The PPC (or the energy management system above it) must enforce these limits automatically, because a battery that hits 10% SOC during an event provides no response at all.
9. Cybersecurity and network architecture
The PPC is a control system that can change a plant's output in seconds, so it is a cybersecurity asset.
NERC CIP-002 categorizes BES Cyber Systems. Most individual IBR plants are low impact; a site whose aggregate generation meets the medium-impact criteria (for example, 1,500 MW or more at a single site within one interconnection) is medium impact. Transmission owner control centers and some substation assets may be medium or high impact.
• Low-impact obligations (CIP-003) include cybersecurity plans, security awareness, electronic access controls for routable and dial-up access, physical security, incident response, transient cyber asset controls and vendor electronic remote access controls.
• Medium and high-impact obligations add electronic security perimeters (CIP-005), system security management (CIP-007), configuration change management (CIP-010), supply chain risk management (CIP-013) and, where applicable, internal network security monitoring (CIP-015).
Good practice for every plant, regardless of category: segment the control network from business systems, allow no direct internet access to the PPC, use multi-factor authentication for remote access, manage firmware and settings under change control, and log every setpoint change with time and source.
Market and trading systems deserve special care. Schedules and bids can pass through to the plant, but the PPC must always enforce physical limits — export limit, ramp rate, SOC reserve and voltage limits — so that no external instruction can push the plant outside its approved operating envelope.
10. Models: what the transmission owner will ask for
10.1 RMS models
Planning studies use positive-sequence (RMS) models. For IBRs, the standard generic library uses three linked models: a generator/converter model (REGC), an electrical control model (REEC) and a plant controller model (REPC). The plant controller model represents the PPC's voltage or reactive control, active power and frequency response functions, with its gains, deadbands, droops, limits and time constants.
10.2 EMT models
Many transmission owners and ISOs now require electromagnetic transient (EMT) models, typically in PSCAD, for weak-grid, oscillation and ride-through studies. A usable EMT model must include the actual PPC algorithm, its sampling and communication delays, and the exact firmware versions of the inverters.
10.3 Model verification
• MOD-026-2 and MOD-027 require the Generator Owner to verify that the models, including the plant-level controller, match the plant's actual response, using staged tests or recorded disturbances.
• MOD-025 requires verification of real and reactive capability.
• MOD-032 requires submission of the data to the planning coordinator.
The most common reasons for failed verification are wrong droop definitions, wrong measurement location, missing communication delays, a different deadband in the field than in the model, and PPC firmware updates that were never reflected in the model.
11. Wind plants, hybrids and grid-forming resources
The same principles apply to wind plants, with a few differences:
Wind turbines have their own turbine controllers and pitch systems. The PPC sends active and reactive setpoints to each turbine; active-power response is limited by rotor speed and pitch rates, and headroom for frequency response comes from operating below available power. Type 3 (doubly fed) turbines also have tighter reactive limits at low output than full-converter Type 4 turbines.
Hybrid and co-located plants share a POI and an export limit. The PPC must decide which resource provides each service — for example, PV for energy, BESS for frequency response and ramp support, and both for reactive power — and enforce the shared limit at every instant.
Grid-forming (GFM) inverters, increasingly specified for batteries in weak areas, behave like voltage sources behind an impedance and respond to grid changes inherently, before the PPC acts. The PPC then sets slower references (voltage magnitude, power and frequency setpoints) rather than direct current commands. Tuning must ensure the PPC does not cancel the GFM inverters' fast response, and models must represent both layers.
12. Testing and proving compliance
12.1 The test sequence
| Stage | What is tested | Evidence produced |
|---|---|---|
| Factory acceptance test (FAT) | PPC hardware, software, logic, interfaces, failover | FAT report, settings file, software version record |
| Hardware-in-the-loop (HIL) | PPC connected to a real-time simulation of the plant and grid, including weak-grid and fault cases | HIL report comparing response with study models |
| Site acceptance test (SAT) | Wiring, communications to every inverter and device, metering accuracy, interlocks | SAT report, point-to-point checklists |
| Commissioning tests | Live voltage steps, reactive capability, power factor and Q setpoint tests, ramp tests, frequency response using an injected frequency offset, AGC tests, mode transfers | Test recordings at the POI, compared with model predictions |
| Post-commissioning monitoring | Response to real grid events using PRC-028-1 recordings | Event comparisons, model updates |
12.2 IEEE 2800.2-2026 conformity assessment
IEEE Std 2800.2-2026 sets out how conformity with IEEE 2800-2022 is verified. It combines evidence from several sources rather than relying on a single certificate:
• Type tests of inverters and other equipment;
• Design evaluation of the plant, using validated models and studies;
• As-built installation evaluation, confirming that the installed equipment, settings and firmware match the design;
• Commissioning tests at the plant;
• Post-commissioning monitoring using recorded disturbances.
Transmission owners decide which parts they require and when. Ask early, because the design evaluation depends on models that must exist at the interconnection-study stage.
12.3 The documentation package
| Document | Typical timing |
|---|---|
| PPC functional description and control block diagram | With interconnection request or facilities study |
| RMS model (generic library) and parameter list | Interconnection request; updated before energization |
| EMT model with matching firmware versions, model quality test report | Interconnection request or system impact study |
| Reactive capability curves at the POI, with losses and voltage limits | Facilities study |
| Settings files and protection coordination | Before energization |
| Telemetry and communication point lists | Before energization |
| Commissioning test plan and results | Before and after commercial operation |
| MOD-025, MOD-026 and MOD-027 verification reports | Within the timelines set by the standards and the transmission owner |
12.4 Why "early" matters under Order No. 2023
FERC Order No. 2023 moved most ISOs to cluster studies with firm deadlines, readiness requirements and penalties for withdrawal. Models submitted with the request are used for the cluster study. If the plant's controller, inverters or firmware change later, the transmission provider may require restudy, and late changes can affect cost allocation and schedule. Choosing the PPC architecture, settings philosophy and model early is a schedule decision as much as an engineering one.
13. A practical PPC specification checklist
Before the controller is ordered, Keentel recommends that the owner's specification answer these questions in writing:
• Measurement point. Where is the plant judged (POI, MPT high side, or another point), and which instrument transformers and meter feed the PPC?
• Control modes and setpoint sources. Which modes must be supported, who may change setpoints, and how are mode transfers made bumpless?
• Performance. Required voltage-step response and settling times, ramp-rate limits, frequency droop and deadband, AGC response, and how each will be tested.
• Capability. POI reactive capability across the full active-power range, with losses, cable charging, voltage limits and BESS availability included.
• Coordination. Rules for capacitor banks, reactors, STATCOMs and the LTC, including deadbands, time delays and interlocks.
• Communications. Architecture and latency to every inverter, fallback behaviour on communication loss, and telemetry to the transmission owner and ISO.
• Redundancy. Hot standby, failover time and fallback inverter settings.
• Cybersecurity. CIP categorization, network segmentation, remote access, logging and supply chain controls.
• Models. RMS and EMT models of the exact PPC algorithm and firmware, with model quality tests, delivered on a defined schedule.
• Testing. FAT, HIL, SAT and commissioning test plans aligned with IEEE 2800.2 and the transmission owner's procedures.
Part C — Three Anonymous Case Studies
These composite case studies are based on the kinds of problems Keentel Engineering sees on US projects. Names, locations and details have been changed or combined.
Case study 1 — A hybrid plant that could not prove its reactive capability
Situation. A 150 MW solar plant with a 75 MW battery, connected at 138 kV in the Mid-Atlantic, reached its commissioning reactive capability test. The interconnection agreement required 0.95 leading and lagging at the high side of the MPT at full output. During the lagging test at 148 MW, the plant reached only +38 Mvar at the POI against a requirement of about 49 Mvar, and several inverters alarmed on high terminal voltage.
Analysis. Keentel rebuilt the plant's reactive capability calculation using the as-built cable data, transformer test reports and tap positions. Three problems emerged:
• The original capability curve had been calculated at the inverter terminals and assumed unity voltage; the I²X losses of the MPT and collectors had been neglected.
• The MPT tap had been left at the position chosen for energization, which put the 34.5 kV bus at 1.04 pu before any reactive output was requested.
• The PPC's dispatch logic used only the PV inverters for reactive power. The battery inverters were idle during the test because the battery was in a charging schedule that locked out reactive commands.
Engineered solution. Keentel recommended a two-step tap change on the MPT, revised the PPC dispatch so that BESS inverters share reactive power in every operating mode (including charging and standby), and added an LTC coordination rule that holds the 34.5 kV bus inside a band protecting inverter terminal voltage. The reactive capability curve was recalculated at the POI with voltage limits and submitted as a revised facilities document.
Outcome. The repeat test reached +52 Mvar and −55 Mvar at full output with all inverter terminals below 1.08 pu. The revised curve and test records were accepted for MOD-025 verification.
Case study 2 — Voltage oscillations at a weak-grid solar plant
Situation. A 250 MW solar plant in Texas, connected at 345 kV through a long radial line, began showing sustained voltage oscillations of about 1.5 Hz at the POI whenever a parallel line was out of service. The transmission operator asked the owner to explain the oscillations and reduce output until they were fixed.
Analysis. Keentel reviewed PRC-028 dynamic disturbance recordings and PPC logs. With the parallel line out, the short-circuit ratio fell from about 4.5 to about 2.2. The PPC's voltage loop had been tuned on the system-intact case, and its integral gain combined with about 0.6 s of effective delay from polled inverter communications left a very small phase margin at the outage condition. The inverters also had a fast local volt-var function enabled, so the plant had two voltage loops working against each other.
Engineered solution. Keentel built an EMT model of the plant, including the PPC algorithm and communication delays, and benchmarked it against the recordings. The solution combined:
• disabling the inverters' local volt-var function while the PPC was in service, with automatic re-enabling on PPC communication loss;
• moving reactive setpoints from sequential polling to broadcast, cutting effective delay to about 0.25 s;
• gain scheduling based on a breaker-status signal from the transmission operator, with a lower gain at the weak condition;
• updated RMS and EMT models submitted for MOD-026 verification.
Outcome. With the parallel line out, the plant's voltage step response settled in under three seconds with no sustained oscillation. The output restriction was lifted, and the updated model became the basis for the transmission operator's weak-grid operating guide.
Case study 3 — A battery that missed its frequency-response obligation
Situation. A 100 MW / 400 MWh battery in the West was committed to frequency response and regulation. During a real under-frequency event, its measured response was about half of what the ISO expected, and the owner received a performance notice.
Analysis. Keentel compared the ISO's event data with the PPC logs. Three issues combined:
• The PPC implemented frequency response at plant level using an ISO frequency signal received over a 4-second scan, so the plant reacted several seconds late.
• The battery's energy management system had scheduled it close to its lower SOC limit for an evening arbitrage discharge, leaving too little energy in reserve for the committed response.
• The droop was calculated on discharge power available at that moment rather than on nameplate, so the response shrank as the battery discharged.
Engineered solution. Keentel moved primary frequency response into the inverters, using local frequency measurement with the required droop and deadband, and left the PPC with a slow trim and coordination role. The energy management system was given hard SOC reserves for each committed service, calculated as in Worked example 7, and the droop basis was corrected to nameplate. A commissioning-style test using an injected frequency offset confirmed the response before the battery returned to service.
Outcome. In the next two qualifying events, the battery delivered its full expected response within about one second. The owner's market performance scores recovered, and the test procedure was adopted for the owner's other storage sites.