A Coordinated Electric System Interconnection Review—the utility’s deep-dive on technical and cost impacts of your project.
Challenge: Frequent false tripping using conventional electromechanical relays
Solution: SEL-487E integration with multi-terminal differential protection and dynamic inrush restraint
Result: 90% reduction in false trips, saving over $250,000 in downtime
The three operating regions you have to design to
| Device | Output vs voltage | Response | Best suited to | Main limitations |
|---|---|---|---|---|
| Mechanically switched capacitor or reactor | Proportional to voltage squared | Seconds; discrete steps; limited switching operations per day | Steady-state reactive supply, voltage profile, loss reduction | No dynamic capability; step voltage change on switching; capability collapses when most needed |
| Static var compensator | Capacitive branches proportional to voltage squared | A few cycles; continuously controllable | Continuous control where cost matters and deep voltage support is not the driver | Square-law capability loss; harmonic filters are part of the plant and interact with the network |
| STATCOM | Approximately proportional to voltage — constant current capability | One to two cycles closed loop; converter response faster still | Voltage stability margin, weak interconnections, fast disturbance recovery, flicker and unbalance compensation | Higher capital cost; converter losses; adds a converter and its control dynamics to the network |
| Synchronous condenser | Governed by machine capability and excitation | Excitation response in the hundreds of milliseconds; inherent inertial response instantaneous | System strength and inertia, short-circuit contribution, black start support | Rotating plant with maintenance and losses; slower controlled response than a converter |
| STATCOM with energy storage | Reactive as a STATCOM, plus real power within the storage rating | As STATCOM for reactive; real power limited by storage | Where a real power deficiency is part of the problem | Cost and complexity of the storage; different failure and maintenance profile |
| Service area | What we do for SST campuses | Typical deliverables |
|---|---|---|
| Grid interconnection | Site screening, large-load applications, independent studies, utility and RTO coordination in ERCOT, NYISO, PJM and other markets | Screening reports, application data packages, load flow, contingency and stability studies, study review memos |
| EMT modeling | Model requirements, vendor model review, campus aggregation, ride-through, weak-grid, control interaction and load-oscillation studies | EMT model specifications, model acceptance reports, PSCAD study reports, SCR screening |
| MV/MVDC system studies | AC and DC short-circuit, DC protection philosophy, AC protection, arc flash, grounding, insulation coordination | Study reports, protection philosophy documents, settings files, arc flash labels, interface control documents |
| Power quality | Emission requirements, frequency scans, IEEE 519-2022 compliance, filter sizing, flicker assessment | Harmonic study reports, filter specifications, monitoring plans |
| Substation and transmission design | HV/EHV substations, MV collectors, transmission lines, utility interface protection | Physical and electrical drawing packages, specifications, bills of material, protection and control design |
| NERC compliance | Registration and applicability, ride-through requirements, model validation, monitoring, compliance programs | Applicability assessments, compliance programs, evidence packages, model validation reports |
| Owner's engineer and QA/QC | SST, storage and substation specifications, design reviews, FAT and SAT plans and witnessing, multi-unit QA | Specifications, review comments, test plans, witness reports, due diligence reports |
| Onsite generation and BESS | Role definition and sizing, DC bus control architecture, fire and code compliance coordination, performance testing | Sizing studies, control architecture documents, specifications, test procedures |
Storage and generation
| Term | Meaning |
|---|---|
| AFE | Active front end. The actively switched AC/DC stage of an SST that connects to the MV grid and sets its grid behavior. |
| Aggregated model | A model in which many converters are represented by a smaller number of equivalent converters to make campus-scale simulation practical. |
| Arc flash | The release of energy from an electric arc fault, assessed as incident energy at a working distance to set PPE and safe work practices. |
| BESS | Battery energy storage system. |
| Blocking | Turning off all converter switches so the converter stops feeding current, used to limit DC faults. |
| Composite load model | A positive-sequence load model that combines several load types, such as motors, electronics and static loads. |
| DAB | Dual active bridge. An isolated DC/DC converter topology with active bridges on both sides of a high-frequency transformer. |
| DC-link | The internal DC capacitor bank between converter stages. |
| EMT | Electromagnetic transient simulation. Time-domain simulation with microsecond time steps, used to study fast converter and network behavior. |
| FAT | Factory acceptance test. |
| Grid-forming | A converter control mode that sets its own voltage and frequency reference rather than following the grid's, providing support to weak grids. |
| HIL | Hardware-in-the-loop testing, in which a real controller is tested against a real-time simulation. |
| IBR | Inverter-based resource. Generation or storage connected to the grid through power electronics. |
| Insulation coordination | Matching the insulation strength of equipment to the voltage stresses the system produces, with surge protection where needed. |
| ISC/IL | The ratio of available short-circuit current to maximum demand load current at the point of common coupling, used to set IEEE 519 limits. |
| ISOP | Input-series, output-parallel. A modular converter arrangement that shares a high input voltage across cells in series and combines their outputs in parallel. |
| Large load | A load large enough to affect transmission system reliability. Definitions vary, for example 75 MW and above under Texas SB 6, or loads above 20 MW in the federal rulemaking proposal. |
| LVDC | Low-voltage DC, such as 800 VDC or ±400 VDC rack distribution. |
| MFT | Medium-frequency transformer. The compact isolation transformer inside an SST, operating at kilohertz frequencies. |
| MMC | Modular multilevel converter. A converter built from many submodules with their own capacitors, producing a stepped multilevel waveform. |
| MVDC | Medium-voltage DC distribution, roughly 1 kV to 35 kV DC in common usage. |
| OE | Owner's engineer. An independent engineer representing the owner's technical interests. |
| PCC / POI | Point of common coupling / point of interconnection, where the campus connects to the utility system and where compliance is usually assessed. |
| PLL | Phase-locked loop. The control element that tracks grid voltage phase and frequency. |
| Positive-sequence model | A fundamental-frequency, balanced dynamic model used in PSS®E, PSLF and similar tools. |
| Ride-through | The ability to stay connected and keep operating during and after a grid disturbance within defined limits. |
| SAT | Site acceptance test. |
| SCR | Short-circuit ratio. Available short-circuit power divided by converter rating, a measure of grid strength. |
| SiC | Silicon carbide, a wide-bandgap semiconductor material that allows higher voltage, higher frequency switching. |
| SST | Solid-state transformer. A power electronic converter with a high-frequency isolation stage that replaces a 60 Hz transformer and rectifier chain. |
| Supraharmonics | Emissions in the 2 kHz to 150 kHz range, above the range covered by most harmonic limits. |
| TDD | Total demand distortion. Harmonic current distortion relative to maximum demand current, used in IEEE 519. |
| WSCR | Weighted short-circuit ratio. An SCR screen that accounts for several inverter-based plants sharing a network area. |
Links were current at publication (November 2026). Large-load rules, NERC actions and standards editions are changing quickly, so confirm current versions before relying on them.
Large-load reliability and NERC
- NERC Publishes Incident Review and Guidance on Voltage-Sensitive Large Load Integration, NERC
- Reliability Insights: Large Computational Load Risks Due to Voltage Sensitivity, NERC, September 2026
- NERC Seeks to Address Reliability Impacts from Large Load Integration, NERC presentation to FERC, April 2025
- NERC issues Level 3 Alert to address immediate risks data center loads pose to the grid, Renewable Energy World, May 2026
- NERC Voltage-Sensitive Loads, Keentel Engineering
Federal and state large-load rules
- FERC Docket RM26-4, Interconnection of Large Loads, FERC
- FERC Establishes Proceeding to Consider DOE Directive on Large Load Transmission Interconnection Rulemaking, McGuireWoods, October 2025
- Texas Senate Bill 6 Ushers in Major Overhaul of Large Load Interconnection and Grid Access Rules, Bracewell, July 2025
- Public Utility Commission of Texas Issues Proposed Rules for Large Load Interconnections, Foley & Lardner, March 2026
Solid-state transformers and DC data center power
- Solid State Transformer project, Open Compute Project
- Novel Solid-State Transformer Supports 800-V DC Power in AI Data Centers, Electronic Design
- How SSTs are Reshaping Data Center Infrastructure, Microchip Technology
Standards referenced (consult the publisher for the current edition)
Step 5 — options. Replacing or retrofitting the drives with active-front-end or 18-pulse units at about 5% THDi gives a TDD of about 1.5%. An active harmonic filter sized for the 5th and 7th could achieve a similar result at the facility level. A passive 5th-harmonic tuned filter would also work but must be checked for resonance with the utility system and with any future capacitors.
What this means for you.
The same drives can be compliant on a strong system and non-compliant on a weak one. Ask your utility for the maximum short-circuit current at the PCC early in design. If the ratio is below 50, plan for low-harmonic drives or filtering from the start; it is much cheaper than retrofitting.
9. Inverter-based resources: solar, storage and wind
Solar PV, battery energy storage and full-converter wind turbines use pulse-width-modulated inverters with output filters. They are generally low-distortion sources. IEEE Std 1547-2018 (distribution-connected resources) and IEEE Std 2800-2022 (transmission-connected resources) limit their current distortion — total rated-current distortion (TRD) of 5% with individual limits by order, measured against rated current rather than present output. In practice, quality inverters measure 1–3% at rated output.
Three cautions apply:
- Percentages rise at low output. At 10% of rated output a 2% distortion (of rated current) looks like 20% THD. Limits referenced to rated current, like TDD, avoid this trap.
- Inverters change the system's impedance. Plant collector cables, inverter output filters and capacitor banks add capacitance. They can create resonances near the 5th to 13th harmonics on the 34.5 kV collector or at a 138 kV, 230 kV or 345 kV point of interconnection, amplifying background distortion that the plant did not create.
- Background distortion matters. Inverters can absorb or amplify existing voltage distortion depending on their control design. Utilities increasingly require harmonic impedance studies for new plants, sometimes using electromagnetic transient (EMT) simulation.
Keentel's articles on harmonic resonance and on
weak-grid inverter stability cover these interactions in depth.
10. Data centers and other electronic facilities
Data centers are a special case because almost all their load is electronic. Points to check:
- UPS rectifiers. Double-conversion UPS units with IGBT rectifiers typically draw less than 5% THDi at rated load, rising at low load. Older six-pulse or 12-pulse thyristor UPS rectifiers may need input filters.
- Server and network power supplies. Modern units with active power factor correction have low 3rd harmonic. Legacy equipment does not. Measure a representative panel rather than assuming.
- 208Y/120 V and 415Y/240 V distribution. Check neutral current and transformer K-factor as in Sections 4 and 7.
- Generator operation. Test UPS and generator compatibility at the actual load level. Generator THDv can be three to four times the utility THDv for the same load.
- Cooling plant. Chiller, pump, fan and cooling distribution unit drives often contribute more low-order harmonics than the IT load. Specify low-harmonic drives where the facility is large relative to the utility source.
- Large-load interconnection. Utilities and grid operators now treat large data centers as high-impact loads. Harmonic studies and power quality monitoring are increasingly part of interconnection requirements, alongside ride-through and dynamic studies.
11. How a harmonic study is done
A harmonic study answers four questions: How much harmonic current will the facility inject? What voltage distortion will it cause? Will any resonance amplify it? What is the cheapest reliable fix? Keentel's typical workflow:
- Gather data. Single-line diagram; utility short-circuit data (maximum and minimum) at the PCC; utility background distortion if known; transformer impedances; cable lengths; capacitor banks and filters; drive, UPS and inverter data sheets with harmonic spectra.
- Measure existing conditions. For existing facilities, install class-compliant power quality meters at the PCC and key buses for at least one week, capturing 10-minute and 3-second data up to the 50th harmonic.
- Build the model. Represent sources as harmonic current injections and the network as frequency-dependent impedances, including transformer phase shifts that can cancel 5th and 7th harmonics between delta-delta and delta-wye units.
- Run a frequency scan. Plot driving-point impedance versus frequency at each important bus to find resonances, for all credible system configurations (tie breakers open/closed, capacitor steps in/out, generator versus utility).
- Run harmonic load flow. Calculate harmonic currents and voltages and compare them with IEEE 519 at the PCC and with equipment limits (IEEE 18 for capacitors, C57.110 for transformers) inside the facility.
- Design mitigation. Compare options for performance, cost, losses, footprint and future flexibility.
- Verify. Measure again after installation and document compliance with the statistical criteria.
12. Fixing harmonics: options compared
800 VDC AI Data Centers: Rethinking UPS, Battery Storage, DC Protection and Cooling Resilience
November 05, 2026 | Blog
Part A — 800 VDC AI Data Centers at a Glance
Artificial intelligence has changed the electrical design of the data center faster than any technology since the server itself. A conventional enterprise rack drew 5 to 15 kW. Today's AI training racks draw 100 to 150 kW, and published industry roadmaps describe racks of several hundred kilowatts and, eventually, about 1 MW. At those densities, the familiar chain of AC power — utility, transformer, double-conversion UPS, power distribution unit, server power supply — starts to break down. The currents become too large, the copper too heavy, the conversion losses too costly and the floor space too valuable.
The industry's answer is high-voltage direct-current distribution to the rack, most often at 800 VDC. That raises an obvious question for owners and designers: if the rack is fed from a DC bus with batteries on it, do we still need a UPS?
Keentel Engineering's answer is yes — but not the UPS you are used to. The functions a UPS performs do not go away. Something must still:
- ride through utility disturbances and outages until the standby generators carry the load;
- isolate the critical load from the grid's voltage sags, swells and harmonics;
- provide redundancy, so a single failure does not drop the compute hall;
- and, new with AI, absorb the fast, synchronized power swings that GPU training jobs create, so the utility and the generators do not see them.
What changes is where those functions live and how they are built. In an 800 VDC architecture the rectifier, the battery and the regulating converter become parts of a DC power system instead of a self-contained AC UPS cabinet. Fewer conversion stages mean higher efficiency. Batteries sized only for "five minutes of runtime" can turn out to be too small in power, too large in energy or wrong in chemistry. Protection, grounding and arc-flash practice must move from AC to DC thinking. And cooling must be powered through the same disturbances as the GPUs, because a liquid-cooled rack can overheat in seconds.
This guide explains each of those changes in US engineering terms, with worked examples, and corrects several simplifications that appear frequently in industry discussions of 800 VDC.
The architecture used in this guide
Keentel Engineering uses one illustrative AI facility throughout this guide.
What Keentel's analysis shows
| Item | Value |
|---|---|
| Utility service | 230 kV, stepped down to 34.5 kV and 13.8 kV on site |
| Compute hall | 50 MW of IT load, liquid cooled |
| Rack size used in examples | 1 MW (forward-looking; today's racks are typically 100–150 kW) |
| Low-voltage supply to the power system | 13.8 kV–480Y/277 V unit substations, or medium-voltage-fed solid-state conversion |
| DC distribution | 800 V pole-to-pole, arranged as ±400 V with a high-resistance grounded midpoint |
| Rack power conversion | 800 V to about 50 V rack bus, then node-level DC/DC to the GPU voltage rails |
| Ride-through storage | Lithium-ion batteries on the DC bus, plus fast capacitive buffering |
| Standby power | Diesel or natural-gas generators at 13.8 kV, NFPA 110 Type 10 |
| Redundancy | N+1 or 2N, depending on the availability target |
What Keentel's analysis shows
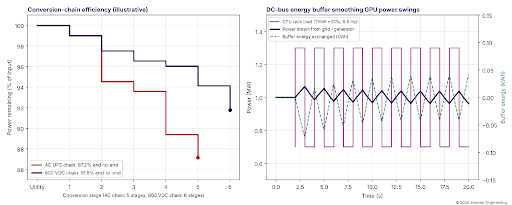
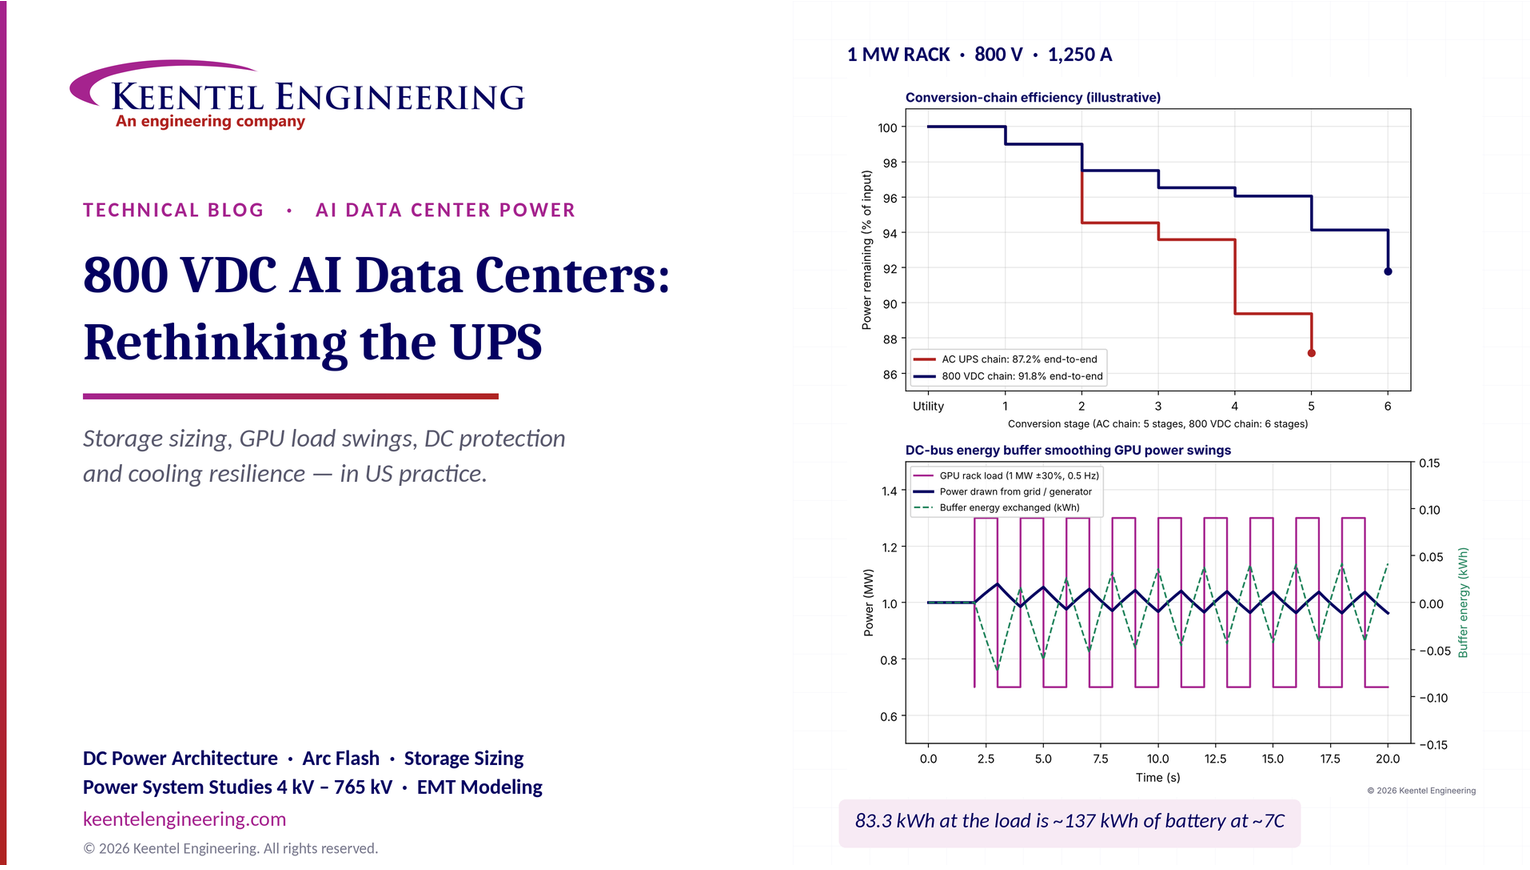
Figure 1. Left: illustrative end-to-end efficiency of a conventional AC UPS chain (87.2%) and an 800 VDC chain (91.8%), stage by stage. Right: a 1 MW AI rack load swinging ±30% at 0.5 Hz, and the much smoother power drawn from the grid or generator when a DC-bus energy buffer absorbs the swings. The buffer exchanges less than 0.1 kWh per cycle, but it cycles every two seconds.
| Result | Value |
|---|---|
| DC current for a 1 MW rack at 800 V pole-to-pole | 1,250 A |
| Liquid heat at 95% capture | 950 kW (270 tons) |
| TCS flow, pure water, 10 K rise | about 1,370 L/min (362 gpm) |
| TCS flow, PG25, 10 K rise | about 1,430 L/min (379 gpm) — 5% more than water |
| TCS flow, PG25, 8 K rise | about 1,790 L/min (473 gpm) |
| Residual air-side heat at 95% capture | 50 kW, about 7,900 CFM at a 20 °F air rise |
| Residual air-side heat at 80% capture | 200 kW, about 31,600 CFM |
| CDU pump power at 2.5 bar (36 psi), PG25 flow | about 6 kW hydraulic, 9 kW electrical |
| Chiller duty for one rack | about 272 tons; 163 kW at 0.6 kW/ton, 95 kW at 0.35 kW/ton |
| DC-link energy in a 10 mF bank at 800 V | 3.2 kJ |
| Bleeder resistor to discharge 10 mF from 800 V to 50 V in 5 s | 180 Ω — which wastes 3.5 kW continuously |
| Time to the power-cap threshold after a chiller trip, 10 MW, system water only | about 40 s |
| Water volume to ride through a 7-minute chiller restart at 10 MW within 5 K | about 53,000 gallons, plus ramp margin |
Five lessons
- The UPS function stays; the UPS cabinet may not. Ride-through, power conditioning, redundancy and transient buffering are still required. In an 800 VDC design they are delivered by a rectifier, DC storage and DC/DC converters working as one system.
- Size the battery for power and cycling, not just minutes. Five minutes at 1 MW is 83.3 kWh at the load, but losses, aging and margin push the nameplate to roughly 137 kWh, and the discharge rate is about 7C. GPU power swings add millions of shallow cycles a year that most batteries are not designed for.
- GPU training loads are a grid problem as well as a facility problem. Synchronized swings of tens of percent at sub-second to few-second periods can excite generator governors and stress the transmission system. A DC-bus energy buffer is one of the most effective places to absorb them.
- DC fault energy is a design driver. Battery-fed DC buses can deliver tens of kiloamperes with no current zero to help interruption. Clearing time, not just voltage, decides arc-flash energy, which is why fast solid-state and hybrid breakers matter.
- Cooling must ride through with the compute. Chillers can stay on generator-backed AC, but coolant distribution unit pumps and controls must be on the uninterruptible system. A liquid-cooled loop may have only tens of seconds of bulk thermal buffer, and the GPUs themselves far less.
Engineering review of common statements about 800 VDC and UPS
| Statement often heard | Keentel's check |
|---|---|
| "A 1 MW rack at 800 VDC draws 1,250 A." | Correct if 800 V is the pole-to-pole voltage. Diagrams that label the rack input "+800 VDC / −800 VDC" imply 1,600 V pole-to-pole and 625 A, which is not what is usually meant. Most 800 V proposals use ±400 V about a grounded midpoint, giving 800 V pole-to-pole. Label the system clearly. |
| "Five-minute backup for a 1 MW rack is 83.3 kWh." | Correct as load-side energy only. Converter losses, usable depth of discharge, end-of-life capacity fade, temperature derating and design margin raise the nameplate to roughly 130–150 kWh. Power capability (C-rate) and cycle life often govern the selection more than energy. |
| "TX 13.8 kV / 480 V (or 416 V)." | US low-voltage systems are 480Y/277 V or 415Y/240 V; 416 V is not a standard US voltage. Medium-voltage-fed solid-state transformers that convert directly from 13.8 or 34.5 kV to 800 VDC are also emerging. |
| "Rack densities are moving toward 1 MW." | Forward-looking. Today's AI racks are typically 100–150 kW; published industry roadmaps describe several hundred kilowatts per rack later this decade and about 1 MW beyond that. Design the infrastructure to scale, but size equipment for confirmed loads. |
| "The rectifier stage is a PFC." | At megawatt scale the front end is an active front end or a multi-pulse rectifier, and the facility must meet IEEE Std 519-2022 harmonic limits at the point of common coupling with the utility. "PFC" describes a server power supply, not a facility rectifier. |
| "Rack PDU at 48 VDC." | Many designs now step 800 V to about 50 V at the rack or power shelf, and some deliver 800 V directly to node-level converters. The intermediate bus voltage is a design choice that trades copper against converter count. |
| "Chillers can remain on conventional AC power." | Correct, provided they are on generator-backed AC with a known restart time and enough chilled-water or coolant thermal storage to bridge the gap. CDU pumps, controls and valves must be on the uninterruptible supply. |
| "DC protection needs DC-rated breakers." | Correct and incomplete. DC interruption has no natural current zero; selectivity, fault current from batteries and converters, grounding and insulation monitoring must be designed together. Arc-flash analysis uses NFPA 70E DC methods, not IEEE 1584, which covers AC only. |
Part B — Technical Guide: UPS, Storage, Protection and Cooling for 800 VDC AI Facilities
1. Why AI racks are moving to 800 VDC
1.1 The current problem
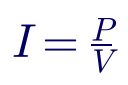
Every conductor, busbar, connector and breaker in a power system is sized by current. For a given power, current falls in direct proportion to voltage:
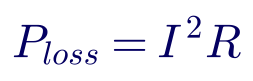
and resistive loss in a conductor of resistance R rises with the square of current:
A 15 kW enterprise rack at 54 V draws about 280 A, which a rack busbar handles easily. A 1 MW rack at 54 V would draw more than 18,000 A. No practical rack busbar, connector or protective device carries that current in the space of a rack, and the copper alone would weigh more than the compute.
Worked example 1 — current and loss for a 1 MW rack
Assume the same busway, with a loop resistance of 0.2 mΩ, feeding a 1 MW rack at three voltages.
| Distribution voltage | Current | Loss in a 0.2 mΩ loop | Relative loss | Copper at 2 A/mm² |
|---|---|---|---|---|
| 54 V | 18,519 A | 68.6 kW | 220× | about 9,260 mm² |
| 400 V | 2,500 A | 1.25 kW | 4× | about 1,250 mm² |
| 800 V | 1,250 A | 0.31 kW | 1× | about 625 mm² |
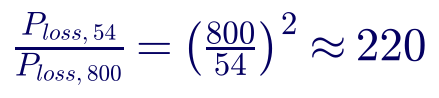
Raising the distribution voltage from 54 V to 800 V reduces current by a factor of about 15 and conductor loss, for the same conductor, by a factor of about 220. In practice designers take part of the benefit as lower loss and part as less copper. Either way, the economics at hundreds of kilowatts per rack favor high-voltage DC.
1.2 Why DC rather than higher-voltage AC
AC distribution at 415Y/240 V or 480Y/277 V to the rack is possible and is used today for racks up to roughly 100–200 kW. DC has three further advantages at higher densities:
- Fewer conversion stages. Every GPU ultimately runs on low-voltage DC. An AC chain rectifies, inverts and rectifies again; a DC chain rectifies once.
- Simpler integration of storage. Batteries and capacitors are DC devices. On a DC bus they can be connected through a single converter, or in some designs directly.
- No reactive power or phase balancing at the rack. DC distribution avoids power-factor and three-phase balance considerations inside the hall.
The price is new engineering challenges: interrupting DC fault current, grounding and insulation monitoring, DC arc flash, and a less mature code and product base. Those are covered later in this guide and in Keentel's companion article on 800 VDC rack fault protection.
1.3 What "800 VDC" actually means
Three arrangements are described as "800 V":
| Arrangement | Pole-to-pole | Pole-to-ground | Notes |
|---|---|---|---|
| Unipolar 0/800 V | 800 V | 800 V on one pole, 0 V on the other (if grounded) | Simple; full voltage to ground on one pole |
| Bipolar ±400 V, midpoint grounded | 800 V | 400 V | Lower voltage to ground; the most common proposal |
| Bipolar ±800 V | 1,600 V | 800 V | Exceeds most low-voltage DC product ratings; rarely what is meant |
A 1 MW rack draws 1,250 A only if 800 V is the pole-to-pole voltage. If the rack input is genuinely ±800 V, the current is 625 A but the system is a 1,600 V DC system with very different equipment ratings, clearances and code requirements. Always state the pole-to-pole voltage, the pole-to-ground voltage and the grounding method on the single-line diagram.
2. What a UPS does — and which functions survive in a DC architecture
A conventional double-conversion UPS performs five functions. All five are still needed in an 800 VDC facility.
| Function | Conventional AC UPS | 800 VDC architecture |
|---|---|---|
| Ride-through of outages until generators carry the load | Battery behind the UPS rectifier and inverter | Battery on the DC bus, through a DC/DC converter or directly |
| Isolation from grid sags, swells, transients and harmonics | Double conversion | Rectifier plus regulated DC/DC stage; the DC bus is decoupled from the AC grid |
| Redundancy and maintainability | N+1 or 2N UPS modules, static bypass, maintenance bypass | N+1 or 2N rectifier and converter modules, DC tie and isolation devices; there is no static bypass to raw AC |
| Fault clearing and selectivity | Inverter current limit, static bypass to clear downstream faults | DC breakers, fuses and solid-state devices coordinated with converter current limits and battery fault current |
| Load-transient buffering | Inverter and DC-link capacitors, with limited headroom | Purpose-designed energy buffer on the DC bus (capacitors, supercapacitors or high-power batteries) |
The last row is new. A conventional UPS was never designed to absorb repeated swings of hundreds of kilowatts every few seconds. In an AI facility, that duty may set the size of the storage system more than ride-through does.
One function disappears: the static bypass. A conventional UPS can transfer the load directly to the utility if the inverter fails. A DC load cannot be fed from raw AC, so redundancy must come from multiple rectifier and converter paths instead. That makes the redundancy architecture more important, not less.
3. Four 800 VDC power architectures
3.1 Architecture A — AC UPS with rack-level AC/DC conversion
The facility keeps a conventional AC UPS (often at 415Y/240 V or 480Y/277 V), and each rack contains power shelves that convert AC to 800 V or directly to about 50 V. This is the least disruptive path and uses mature, listed equipment. It keeps the losses of double conversion plus rack rectification and puts significant heat and weight in the rack.
3.2 Architecture B — Centralized rectifier, DC-bus battery and regulated 800 V
A medium-voltage or 480 V supply feeds large rectifiers with active front ends. The rectifier output forms a DC bus with lithium-ion storage. A regulated DC/DC stage produces a stiff 800 V distribution bus to DC switchboards and rack feeds. This is the arrangement most often drawn for 800 VDC AI halls. Its strengths are fewer conversion stages, centralized storage and a regulated rack voltage. Its challenges are DC protection at high fault currents, large DC switchboards and a less mature listing landscape.
3.3 Architecture C — Medium-voltage solid-state transformer to 800 VDC
A solid-state transformer (SST) converts directly from 13.8 kV or 34.5 kV AC to 800 VDC, replacing the 60 Hz transformer, the low-voltage switchgear and the rectifier with one power-electronic system. SSTs promise the highest efficiency and smallest footprint. They are emerging technology at data center scale, with limited field history, and they move the medium-voltage interface, harmonic performance and protection into a single vendor's power electronics. Owners should treat them as a pilot technology with careful protection and reliability studies.
3.4 Architecture D — Distributed battery backup units
Battery backup units (BBUs) in each rack or row, as promoted in open hardware specifications, provide short ride-through close to the load, while the facility relies on generators for longer outages. BBUs remove a central UPS but distribute lithium-ion batteries throughout the white space, which affects fire protection, maintenance and code compliance under NFPA 855 and the local fire code.
3.5 Choosing among them
| Criterion | A: AC UPS + rack AC/DC | B: Central rectifier + DC battery | C: MV SST to DC | D: Rack/row BBU |
|---|---|---|---|---|
| Maturity and listings | High | Medium | Low–medium | Medium |
| End-to-end efficiency | Lowest | High | Highest | High |
| Conversion stages | Most | Fewer | Fewest | Fewer |
| Fault current at the DC bus | Low (converter-limited) | High (battery-fed) | Converter-limited | Moderate, local |
| Transient buffering | Limited | Central, large | Depends on design | Local, small |
| Fire-code and battery placement | Central battery room | Central battery room | Separate storage needed | Batteries in the white space |
| Best fit | Retrofits, 100–200 kW racks | New AI halls at 200 kW+ per rack | Greenfield pilots | Hyperscale designs with standard racks |
4. Conversion-chain efficiency
4.1 Why stages matter
The efficiency of a power chain is the product of the efficiencies of its stages:
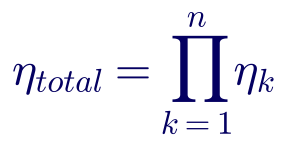
Removing one stage at 96% efficiency is worth as much as improving every other stage by several tenths of a percent. That is the core efficiency argument for 800 VDC.
Worked example 2 — AC UPS chain vs 800 VDC chain for a 50 MW hall
Keentel used illustrative full-load stage efficiencies. Actual values depend on equipment, loading and operating mode, and must come from manufacturer data and tests.
| Stage | AC UPS chain | 800 VDC chain |
|---|---|---|
| MV/LV transformer | 99.0% | 99.0% |
| Double-conversion UPS | 95.5% | — |
| Rectifier (active front end) | — | 98.5% |
| DC/DC to regulated 800 V | — | 99.0% |
| PDU, remote power panels and cabling | 99.0% | 99.5% (800 V distribution) |
| Server or rack power supply | 95.5% (AC to 54 V) | 98.0% (800 V to 50 V) |
| Node-level DC/DC | 97.5% | 97.5% |
| End-to-end | 87.2% | 91.8% |
For 50 MW delivered to the nodes:

The 800 VDC chain saves about 2.9 MW of input power. At continuous operation:

At $70/MWh that is about $1.8 million per year. Every megawatt of conversion loss also becomes heat that the cooling plant must remove, so the total saving is larger once cooling energy is included. Two cautions apply. First, modern AC UPS systems offer high-efficiency modes above 98% that narrow the gap, at the cost of less conditioning. Second, part-load efficiency matters: a 2N system often runs each side below 50% load, where converter efficiency falls.
4.2 The front end and harmonics
Whatever the architecture, the facility presents a large power-electronic load to the utility. Active front-end rectifiers keep current distortion low and can provide reactive power support; multi-pulse rectifiers with phase-shifting transformers are an alternative. The facility must meet IEEE Std 519-2022 at the point of common coupling, and large-load interconnection requirements increasingly ask for documented harmonic and ride-through performance. See Keentel's companion articles on harmonics and IEEE 519 for the method.
5. Redundancy architectures for DC power
Redundancy in a DC power system follows the same logic as in an AC UPS system, with one difference: there is no static bypass to fall back on.
| Architecture | Description | Typical module loading | Strengths | Watch-outs |
|---|---|---|---|---|
| N+1 | One spare rectifier/converter module per group | Up to N/(N+1), e.g., 83% with 5+1 | Lowest cost | Shared DC bus is a single point of failure unless sectionalized |
| 2N | Two independent DC systems, each able to carry the full load; racks dual-fed | Below 50% each | Concurrent maintenance and fault tolerance | Highest cost; low converter loading reduces efficiency |
| Distributed redundant (e.g., 4-to-make-3) | Several systems, each loaded to (N−1)/N; loads spread across pairs | Up to 75% | High utilization with fault tolerance | Complex load assignment and failure analysis |
| Block redundant (catcher) | Active blocks with a shared reserve block | Active blocks high; reserve idle | Efficient at scale | Transfer scheme and reserve-block protection are critical |
For dual-fed DC racks, the two feeds are usually combined in the rack through diodes or active OR-ing, and each feed must be able to carry the full rack load after a failure. Apply the same loading rules used for A/B AC feeds: each feed carries about half the load normally and the full load after a failure, within the continuous rating of its protective device.
Sectionalize the DC bus. A single, solidly tied 800 V bus with all batteries and rectifiers connected can deliver very high fault current and can be taken down by a single bus fault. Splitting the bus into sections with fast tie devices limits fault current, contains failures and allows maintenance.
6. Sizing energy storage on the DC bus
6.1 Energy is only the starting point
The simplest sizing statement is runtime: "five minutes at full load." For a 1 MW rack that is:

That number is correct, but it is the energy the load consumes, not the battery nameplate. The battery must also cover converter losses, cannot be discharged to zero, loses capacity as it ages, delivers less at low temperature, and needs design margin.

Worked example 3 — battery nameplate and C-rate for a 1 MW rack
| Factor | Value | Reason |
|---|---|---|
| Load energy | 83.3 kWh | 1 MW for 5 minutes |
| DC/DC converter efficiency, η | 0.98 | Battery to 800 V bus |
| Usable depth of discharge, DoD | 0.90 | Manufacturer's usable window |
| End-of-life capacity, k(EOL) | 0.80 | Battery replaced at 80% of initial capacity |
| Temperature factor, k(T) | 0.95 | Room held at the low end of the design range |
| Design margin, k(margin) | 1.10 | Load growth, measurement uncertainty |

The battery must also deliver 1 MW, plus losses, from about 137 kWh of nameplate energy:

A discharge rate above 7C is far beyond typical energy-optimized lithium-ion cells used in grid storage (often 0.25C to 1C). The application needs high-power cells designed for UPS duty, with the thermal design, internal resistance and cycle-life ratings to match. In practice, the power requirement, not the energy requirement, frequently decides the battery.
6.2 Runtime must match the generator plan
Five minutes is a convention, not a requirement. The real requirement is the time needed to start, synchronize and load the generators, plus margin for a failed start and a retry or manual intervention. Section 8 develops a timeline. Many AI designs settle between 2 and 5 minutes at full load, but the decision should come from the generator plan and the owner's risk tolerance.
6.3 Chemistry and listing
| Chemistry | Strengths | Concerns for 800 VDC UPS duty |
|---|---|---|
| Lithium iron phosphate (LFP) | Thermal stability, long cycle life | Lower power density than some alternatives |
| Nickel manganese cobalt (NMC) | High power and energy density | Thermal runaway behavior requires strong fire design |
| Lithium titanate (LTO) | Very high power, very long cycle life | High cost, lower energy density |
| Valve-regulated lead-acid (VRLA) | Familiar, low cost | Weight, footprint, short life at high discharge rates |
| Supercapacitors | Millions of cycles, very fast | Seconds of energy, not minutes |
Whatever the chemistry, the energy storage system should be listed to UL 9540, its cells and modules to UL 1973, and its fire behavior characterized by UL 9540A testing to support NFPA 855 and the local fire code. UPS equipment is listed to UL 1778.
7. GPU load transients and the grid
7.1 What the grid sees
Large AI training jobs run thousands of GPUs in lockstep. When the GPUs move between compute and communication phases, the whole cluster's power can swing by tens of percent within milliseconds and repeat at periods from fractions of a second to several seconds. A traditional data center load is almost flat; an AI training hall can look like a large, oscillating industrial load.
These swings matter in three places:
- Inside the facility, they stress converters and DC-bus voltage regulation.
- At the generators, during an outage, they can exceed the step-load capability of the engines and excite governor oscillations.
- At the grid, multi-hundred-megawatt campuses swinging together can create forced oscillations, voltage flicker and frequency disturbances. NERC's large-load work, ERCOT and SPP have all raised concerns about large computational loads, including their ride-through behavior and their fluctuations.
7.2 Buffering on the DC bus
A DC power system is a natural place to absorb these swings. A fast energy buffer — capacitors, supercapacitors or a high-power battery under a dedicated controller — supplies the rapid component of the load, while the rectifier draws a smoothed average from the AC system.
Figure 1 (right) shows a 1 MW rack swinging ±30% at 0.5 Hz. With a 4-second smoothing time constant on the rectifier, the AC-side swing falls from 600 kW peak-to-peak to about 80 kW, and the buffer exchanges well under 0.1 kWh per cycle.
Worked example 4 — why battery cycle life is the hidden constraint
Assume the buffer exchanges about 0.05 kWh every 2-second cycle and the battery is the 137 kWh system from Worked example 3.
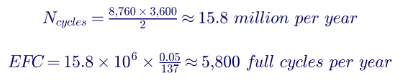
Five to six thousand equivalent full cycles a year would consume the rated life of many lithium-ion products in one to two years. That is why designs pair batteries for ride-through with capacitive or supercapacitor buffers for transients, or select chemistries rated for very high cycle counts. The control system decides which device carries which frequency band.
8. Generator coordination
8.1 The transfer timeline
The ride-through storage must cover the full time from loss of utility to stable generator operation, with margin.
Worked example 5 — outage timeline for a 13.8 kV paralleled generator plant
| Step | Typical time | Cumulative |
|---|---|---|
| Utility disturbance confirmed (avoid nuisance starts on short sags) | 1–3 s | 3 s |
| Generators crank, start and reach rated voltage and frequency (NFPA 110 Type 10) | ≤ 10 s | 13 s |
| First generator closes to dead bus; others synchronize and parallel | 3–10 s | 23 s |
| Load blocks transferred; rectifiers walk in gradually | 10–20 s | 43 s |
| Stable operation on generators | — | about 45 s |
| Margin for a failed start, retry or manual action | 1–3 min | 2–4 min |
On this timeline, two to five minutes of storage provides a reasonable margin. Less than one minute leaves no room for a failed start. Far more than five minutes adds cost and fire load without much benefit if the generator plant is reliable.
8.2 Step loading and rectifier walk-in
Diesel generators commonly accept large single steps; natural-gas engines often accept much smaller steps. A hall of power-electronic loads cannot be dropped onto generators all at once without large frequency and voltage dips. Rectifiers should "walk in," ramping their input power over several seconds while the DC storage carries the balance. The ramp rate must be coordinated with each generator's step-load acceptance and governor response.
Generators also see the GPU power swings described in Section 7. During extended generator operation, the DC-bus buffer must keep those swings away from the engines, or the governor and voltage regulator must be shown, by test or simulation, to tolerate them.
8.3 Returning to utility
Retransfer to utility after an outage should be a closed transition where the utility allows it, or a controlled open transition carried by the DC storage. Either way, the storage state of charge must be sufficient at the moment of retransfer, and recharge current must be limited so the recharging batteries do not add a large step load to the generators or the utility.
9. DC bus voltage regulation and transients
9.1 Steady-state voltage drop
DC voltage drop is simply current times resistance:

At 1,250 A, a loop resistance of 0.2 mΩ causes a 0.25 V drop — negligible at 800 V. At 54 V and 18,500 A, the same conductor would drop 3.7 V, almost 7% of the supply. Again, the higher voltage makes the problem disappear.
9.2 Holding the bus through a load step
When the load steps faster than the regulating converter can respond, the bus capacitance supplies the difference. The energy drawn from the capacitor during the step must keep the voltage within its limit:

For small deviations this simplifies to:
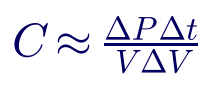
Worked example 6 — capacitance for a 300 kW step
A 1 MW rack steps up 30% (300 kW). The regulating converter needs 50 ms to respond. The bus must stay within 2% of 800 V (16 V).

The exact energy calculation gives about 1.18 F. That capacitance stores only about 0.1 kWh at 800 V — trivial as energy, but a large bank in film or electrolytic capacitors and a significant source of fault current. Supercapacitor modules behind a DC/DC converter can provide the same effect with smaller physical size, at the cost of another converter. The converter control bandwidth is the real lever: halving the response time halves the capacitance.
10. DC protection, grounding and arc flash (summary)
Keentel's companion article on 800 VDC rack fault protection covers solid-state circuit breakers, selectivity and fault detection in depth. This section summarizes what changes when the UPS becomes a DC system.
10.1 Fault current from the storage
A battery-fed DC bus can deliver very large fault currents, limited only by internal resistance and cable resistance:

Worked example 7 — bolted fault current on an 800 V bus
Four battery strings, each with 25 mΩ internal resistance, are connected in parallel to the bus through cables totaling 5 mΩ.

Seventy kiloamperes of DC, with no current zero to help interruption, exceeds the interrupting rating of many low-voltage DC devices. The bus capacitance adds a very fast discharge peak on top. Fault current, not just load current, must set the interrupting ratings of every device on the bus — and is the strongest argument for sectionalizing the bus and for current-limiting fuses or solid-state breakers near the storage.
10.2 Grounding and ground-fault detection
The most common 800 VDC arrangement is ±400 V with the midpoint grounded through a high resistance. A first ground fault on either pole then causes only a small current, the system keeps running, and an insulation monitoring device (IMD) or ground-fault detector raises an alarm. A second ground fault on the opposite pole is a pole-to-pole fault, so the first fault must be located and cleared promptly. Ungrounded and solidly grounded DC systems are also possible; each changes fault current, touch voltage and detection. Document the choice and follow NEC Article 250 provisions for DC systems.
10.3 DC arc flash
IEEE Std 1584-2018 covers three-phase AC systems only. For DC, NFPA 70E-2024 Informative Annex D provides calculation methods, including the maximum-power method, which assumes the arc voltage is half the system voltage:
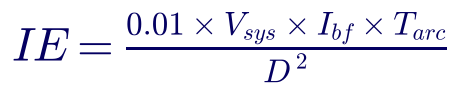
where IE is in cal/cm², V(sys) in volts, I(bf) is the bolted fault current in amperes, T(arc) is the arcing time in seconds and D is the working distance in centimeters. Annex D notes that arcs in enclosures can produce up to about three times the open-air value.
Worked example 8 — DC incident energy at 800 V
Using the 71 kA bolted fault current and a working distance of 45.7 cm (18 in.):
| Clearing time | Open air | In an enclosure (×3) |
|---|---|---|
| 100 ms (conventional DC breaker) | 27.2 cal/cm² | about 82 cal/cm² |
| 10 ms (fast fuse) | 2.7 cal/cm² | about 8 cal/cm² |
| 2 ms (solid-state breaker) | 0.5 cal/cm² | about 1.6 cal/cm² |
The maximum-power method is deliberately conservative, but the lesson is robust: on a battery-fed DC bus, clearing time decides the hazard. Fast interruption near the storage turns a potentially lethal arc flash into a manageable one. Labels, PPE and energized-work procedures must follow NFPA 70E.
11. Cooling resilience
11.1 What must stay on
A liquid-cooled AI rack has very little thermal buffer. If coolant stops flowing, GPU junction temperatures can reach throttling limits in seconds. The cooling system must therefore be split by how fast each component matters:
| Load | Time to consequence | Recommended supply |
|---|---|---|
| CDU pumps, valves and controls | Seconds | Uninterruptible (DC bus or UPS-backed AC) |
| Rack and row fans for residual air cooling | Seconds to tens of seconds | Uninterruptible |
| Facility-water pumps | Tens of seconds to minutes | Uninterruptible or generator with thermal buffer |
| Chillers, dry coolers, cooling towers | Minutes | Generator-backed AC, with restart logic |
| Building HVAC | Many minutes | Generator-backed AC |
11.2 Thermal ride-through
The bulk thermal buffer of a coolant loop is:

Worked example 9 — coolant-loop ride-through for a 1 MW rack
Assume the secondary loop for one rack holds about 400 kg of 25% propylene glycol (c(p) ≈ 3,900 J/kg·K), the allowable coolant temperature rise is 10 K, and 85% of the rack's 1 MW goes into the liquid.

Eighteen seconds is the bulk average, and only if the coolant keeps circulating. If the pumps stop, the coolant at the cold plates heats almost immediately and GPUs can throttle within a few seconds. Pumps on the uninterruptible supply are not optional. Chillers can ride through on generators only if chilled-water or coolant thermal storage covers their restart time, which for large chillers can be several minutes. Keentel's companion articles on CDU liquid cooling and digital-twin pump-failure analysis develop these transients in detail.
12. Codes, standards and listings
| Topic | US reference | What it means for 800 VDC |
|---|---|---|
| Information technology equipment rooms | NEC Article 645 | Disconnects, wiring and power-off requirements for ITE areas |
| DC microgrids | NEC Article 712 | Requirements for DC power systems and their sources; confirm applicability and voltage limits in the adopted edition |
| Energy storage systems | NEC Article 706, NFPA 855, UL 9540, UL 9540A, UL 1973 | Listing, siting, spacing, fire testing and detection for lithium-ion storage |
| Batteries | NEC Article 480 | Battery installation, ventilation and disconnecting means |
| Grounding of DC systems | NEC Article 250 | DC system grounding and ground-fault detection |
| UPS equipment | UL 1778 | Listing of UPS equipment |
| Electrical safety and arc flash | NFPA 70E-2024 | DC arc-flash methods (Annex D), shock protection, energized work |
| Maintenance | NFPA 70B-2023 | Maintenance program for electrical equipment, including batteries and DC gear |
| Standby generators | NFPA 110 | Type 10 start time, testing and maintenance |
| Harmonics at the utility interface | IEEE Std 519-2022 | Current and voltage distortion limits at the point of common coupling |
| Large-load interconnection | Utility and ISO requirements; NERC large-load activities | Emerging requirements for ride-through, fluctuation and modeling of large computational loads |
DC provisions in US codes are evolving quickly. Code editions after 2023 expand coverage of higher-voltage DC systems, and local adoption varies. Confirm the edition adopted by the authority having jurisdiction and engage the AHJ early, because many 800 VDC products are new and some listings are still in progress.
13. A practical design checklist
- Define the voltage system on the single-line diagram: pole-to-pole voltage, pole-to-ground voltage, grounding method and insulation monitoring.
- Choose the architecture (A, B, C or D) based on rack density, maturity, footprint and the owner's risk tolerance.
- Calculate conversion-chain efficiency at realistic part loads, not just at full load.
- Set the redundancy architecture and verify each feed and module can carry its post-failure load.
- Size storage for power, energy and cycling, separately for ride-through and for transient buffering.
- Build the generator timeline, including detection, start, synchronization, walk-in and retry margin.
- Study GPU load transients with the facility's actual workload profile, and specify what the utility and generators may see.
- Calculate DC fault currents from storage, capacitance and converters, and set interrupting ratings and sectionalizing accordingly.
- Perform DC arc-flash analysis using NFPA 70E methods and specify clearing times that keep incident energy manageable.
- Put CDU pumps and controls on the uninterruptible supply, and verify thermal ride-through for chillers on generators.
- Coordinate with the utility and the ISO on harmonics, ride-through and fluctuation requirements for large loads.
- Engage the AHJ early on listings, battery siting and DC code provisions.
Part C — Three Anonymous Case Studies
These composite case studies are based on the kinds of problems Keentel Engineering sees on US projects. Names, locations and details have been changed or combined.
Case study 1 — A "five-minute" battery that could not deliver the power
Situation. A developer in the Southeast was converting part of an existing data center into a 12 MW AI training hall with 200 kW racks. The design used a centralized rectifier, lithium-ion storage on the DC bus and regulated DC distribution to the racks. The battery had been specified as "five minutes at full load," and the vendor offered an energy-optimized product sized at exactly the load-side energy plus a small margin.
Analysis. Keentel's review recalculated the requirement using converter efficiency, usable depth of discharge, end-of-life capacity and temperature. The required nameplate was about 65% higher than offered. More importantly, the discharge rate at full load was above 6C, while the offered cells were rated for continuous discharge near 1C. The vendor's datasheet showed that, at the required power, the battery would reach its voltage cutoff in under a minute and its cells would overheat. Keentel also found that the training workload profile supplied by the owner showed power swings of about 25% every one to three seconds, which the battery controller had not been asked to handle.
Engineered solution. Keentel specified a high-power UPS-grade lithium iron phosphate system sized for the corrected power and energy, with a separate supercapacitor buffer and controller to absorb the training-load swings. The rectifiers were set to a slow power ramp so the utility and the generators would see a smoothed load. The generator timeline was documented and the storage runtime set at three minutes based on it.
Outcome. Commissioning tests with simulated outages and recorded workload profiles showed the bus held within its voltage limits, the generators carried the hall after a 40-second transfer, and the AC-side power swing was reduced by more than 80%. The owner avoided a storage system that would have failed its first full-load test.
Case study 2 — An 800 VDC bus with arc-flash energy nobody had calculated
Situation. An AI campus in Texas installed 800 V DC switchboards fed by rectifiers and a large battery system, with all battery strings tied to a single bus. The electrical contractor asked for arc-flash labels before energization. The design team had performed an IEEE 1584 study for the AC system but had no DC study.
Analysis. Keentel modeled the DC system, including the battery strings, the DC bus capacitance and the converter contributions. The bolted fault current on the tied bus exceeded 80 kA, and the main DC breakers had a clearing time near 100 ms. Using the NFPA 70E Annex D maximum-power method, incident energy at the main switchboard exceeded 80 cal/cm² for an arc in an enclosure — beyond any practical PPE category. Several branch devices were also applied above their DC interrupting ratings.
Engineered solution. Keentel recommended splitting the battery into four sections, each connected to the bus through current-limiting DC fuses and a fast tie arrangement, and replacing the branch devices with properly rated DC breakers. Maintenance procedures were changed so that energized work on the main bus required the battery sections to be isolated. Insulation monitoring was added to the high-resistance grounded midpoint.
Outcome. Available fault current at the switchboard fell to about a quarter of its original value and clearing times dropped by an order of magnitude. Incident energy fell to levels where labeled PPE and energized-work procedures were practical. The authority having jurisdiction accepted the revised design and the study.
Case study 3 — Chillers on generators, pumps not on anything
Situation. A liquid-cooled AI facility in the Mid-Atlantic tested its emergency transfer. The compute load rode through on the DC storage exactly as designed, but within seconds of the utility outage, dozens of racks throttled and several shut down on high temperature.
Analysis. Keentel reviewed the electrical drawings and event logs. The CDU pumps had been connected to the generator-backed mechanical distribution, not to the uninterruptible system, on the assumption that "cooling is on the generators." During the 30-second generator start and transfer, coolant flow to the racks stopped completely. The bulk coolant-loop buffer was about 20 seconds, but with no flow, the cold plates heated much faster, and GPU temperatures reached their protective limits in under ten seconds.
Engineered solution. Keentel moved the CDU pumps, valve actuators and cooling controls to the uninterruptible DC system through dedicated DC/DC converters, with selective protection so a pump fault could not affect the compute bus. The chiller plant stayed on generator-backed AC, and a chilled-water storage tank was sized to cover the chillers' restart time with margin.
Outcome. A repeat transfer test showed uninterrupted coolant flow, no GPU throttling and stable coolant temperatures through the full generator start and chiller restart. The owner adopted the change as a standard for all subsequent halls.
Part D — 20-Question Technical FAQ
1. Do 800 VDC AI data centers still need a UPS?
Yes. The functions of a UPS — ride-through until generators carry the load, isolation from grid disturbances, redundancy and load-transient buffering — are still required. In an 800 VDC design they are delivered by rectifiers, DC storage and DC/DC converters working as one power system, rather than by a self-contained AC UPS cabinet.
2. Why 800 V and not 400 V or 1,500 V?
800 V pole-to-pole cuts current to manageable levels for racks of several hundred kilowatts while staying below 1,000 V DC, where low-voltage DC equipment, component ratings and clearances are well established. 400 V doubles the current. Voltages above 1,000 V DC move into equipment classes and code provisions that are much less developed for the white space.
3. Is "800 VDC" measured pole-to-pole or pole-to-ground?
It should be stated explicitly. Most proposals mean 800 V pole-to-pole, arranged as ±400 V with a high-resistance grounded midpoint, so neither pole is more than 400 V from ground. A system labeled "+800 V / −800 V" would be 1,600 V pole-to-pole. Put the pole-to-pole voltage, pole-to-ground voltage and grounding method on the single-line diagram.
4. How much current does a 1 MW rack draw at 800 V?
About 1,250 A at 800 V pole-to-pole. At 54 V the same rack would draw more than 18,500 A, which is why low-voltage rack busbars cannot scale to megawatt racks.
5. How efficient is an 800 VDC chain compared with a conventional AC UPS?
With illustrative stage efficiencies, Keentel's comparison shows about 91.8% end to end for an 800 VDC chain against 87.2% for a double-conversion AC chain. For a 50 MW IT hall, that difference is about 2.9 MW of input power and roughly $1.8 million a year in energy at $70/MWh, before cooling savings. Actual results depend on equipment, loading and operating modes.
6. Is five minutes of battery runtime the right target?
Five minutes is a convention. The real requirement comes from the generator timeline: detection, start, synchronization, load transfer and margin for a failed start. Many AI designs settle between two and five minutes. Document the timeline and choose the runtime from it.
7. Why is the battery nameplate so much larger than the load energy?
Because the battery must cover converter losses, cannot be fully discharged, loses capacity with age, delivers less at low temperature and needs design margin. In Keentel's example, 83.3 kWh at the load becomes about 137 kWh of nameplate.
8. What is C-rate and why does it matter here?
C-rate is discharge power divided by battery energy. Delivering 1 MW from about 137 kWh is about 7.3C, far above energy-optimized cells. UPS duty needs high-power cells with low internal resistance and adequate thermal design. Power capability often decides the battery more than energy does.
9. Should batteries connect directly to the 800 V bus?
They can, but a DC/DC converter between the battery and the bus is more common. The converter lets battery voltage vary with state of charge while the bus stays regulated, limits fault current from the battery and controls charging. Direct connection removes a conversion stage but makes the bus voltage float with the battery and raises fault current.
10. What are GPU load transients?
Large training jobs run thousands of GPUs in step. As they alternate between computing and communicating, cluster power can swing by tens of percent in milliseconds and repeat at periods from fractions of a second to several seconds. These swings stress the DC bus, the generators during outages and, for large campuses, the transmission grid.
11. Can the battery absorb those swings?
It can, but the cycle count is the problem. Swings every two seconds add up to about 15.8 million cycles a year. Even shallow cycles can accumulate several thousand equivalent full cycles a year, consuming a typical lithium-ion battery's rated life in one to two years. Capacitive or supercapacitor buffers, or chemistries rated for very high cycle counts, usually carry the fast swings.
12. How much capacitance does an 800 V bus need?
Enough to hold voltage until the regulating converter responds. To hold a 300 kW step for 50 ms within 2% at 800 V takes about 1.2 F. Faster converter response reduces the capacitance proportionally.
13. What is a solid-state transformer and should we use one?
A solid-state transformer converts medium-voltage AC (for example 13.8 kV or 34.5 kV) directly to DC with power electronics, replacing the 60 Hz transformer, low-voltage switchgear and rectifier. It promises the highest efficiency and smallest footprint but is emerging technology at data center scale. Keentel recommends pilots with thorough protection, harmonic and reliability studies before fleet deployment.
14. Do we still need a static bypass?
There is no static bypass in a DC system, because a DC load cannot be fed from raw AC. Redundancy must come from multiple rectifier and converter paths, dual-fed racks and a sectionalized DC bus.
15. How much fault current can a DC bus deliver?
A battery-fed bus can deliver tens of kiloamperes. Keentel's example with four parallel strings gives about 71 kA, plus a fast discharge peak from bus capacitance. Every device on the bus must be rated to interrupt the available DC fault current.
16. How is DC arc flash calculated?
IEEE Std 1584 covers AC only. NFPA 70E-2024 Informative Annex D gives DC methods, including the conservative maximum-power method. At 800 V and 71 kA, incident energy at 18 in. is about 27 cal/cm² in open air with 100 ms clearing and about 0.5 cal/cm² with 2 ms clearing. Fast interruption is the most effective mitigation.
17. How should an 800 V DC system be grounded?
The common choice is ±400 V with the midpoint grounded through a high resistance, plus an insulation monitoring device. A first ground fault causes only a small current and an alarm, so operation continues while the fault is located. The fault must be cleared promptly, because a second ground fault on the opposite pole is a pole-to-pole fault.
18. Can chillers stay on AC power?
Yes, provided they are on generator-backed AC with a known restart time and enough chilled-water or coolant thermal storage to bridge the gap. CDU pumps, valves and cooling controls must be on the uninterruptible supply, because liquid-cooled GPUs can overheat within seconds of losing coolant flow.
19. What does the utility care about?
Harmonics at the point of common coupling (IEEE Std 519-2022), the facility's behavior during grid faults (ride-through or trip), and load fluctuations from GPU workloads. NERC, ERCOT, SPP and other planners are developing requirements for large computational loads, including ride-through and modeling. Engage the utility early with documented performance.
20. Which codes apply to 800 VDC equipment?
NEC Articles 645 (ITE), 706 (energy storage), 712 (DC microgrids), 480 (batteries) and 250 (grounding), plus NFPA 855, NFPA 70E, NFPA 70B and NFPA 110, and UL 9540, UL 9540A, UL 1973 and UL 1778 listings. DC provisions are evolving; confirm the edition adopted by the authority having jurisdiction and engage it early.
Keentel Services, References and Contact
How Keentel Engineering Helps
Keentel Engineering supports AI data center developers, owners, operators and EPC contractors from concept to commissioning:
- Power architecture studies. Comparison of AC UPS, centralized DC, solid-state transformer and distributed battery architectures, with efficiency, reliability, footprint and cost analysis.
- Single-line diagrams and design. MV service, unit substations, rectifier and DC distribution design, with clearly defined voltage systems and grounding.
- Energy storage sizing. Ride-through and transient-buffer sizing for power, energy and cycle life, with generator timeline analysis.
- Generator integration. Paralleling, step-load and walk-in studies, transfer schemes and retransfer coordination.
- DC protection, grounding and arc flash. DC short-circuit studies, device ratings, selectivity, insulation monitoring and NFPA 70E DC arc-flash studies and labels.
- Cooling power resilience. Classification of cooling loads by time to consequence, uninterruptible supply design for CDUs and thermal ride-through analysis.
- Utility interconnection and large-load studies. Harmonic analysis to IEEE 519-2022, ride-through and fluctuation studies, and EMT modeling of large computational loads for utilities and ISOs.
- Code and AHJ support. NEC, NFPA and UL compliance strategies for new DC equipment.
Why Clients Choose Keentel
- Grid and facility expertise in one team. We design from the 230 kV substation to the 800 V rack feed.
- Power system studies from 4 kV to 765 kV, including EMT modeling of power-electronic loads.
- US codes and standards fluency. NEC, NFPA, UL, IEEE and NERC, applied to emerging DC technology.
- Evidence-based design. Calculations and simulations tied to equipment data and commissioning tests.
- Responsive senior engineers, with direct access to experienced professional engineers throughout the project.
Talk to Keentel Engineering
Planning an AI hall at 200 kW per rack or beyond? The power architecture decisions you make now — voltage, storage, protection and cooling resilience — will set your efficiency, reliability and safety for the life of the facility. Keentel Engineering can help you get them right.
- Phone: (813) 389-7871
- Email: contact@keentelengineering.com
- Book a 15-minute call: calendly.com/keentel-engineering/15min
- Web: keentelengineering.com
References
- NFPA 70, National Electrical Code, 2023 edition — Articles 250, 480, 645, 706 and 712.
- NFPA 70E-2024, Standard for Electrical Safety in the Workplace — Informative Annex D, DC arc-flash calculation methods.
- NFPA 70B-2023, Standard for Electrical Equipment Maintenance.
- NFPA 110, Standard for Emergency and Standby Power Systems.
- NFPA 855, Standard for the Installation of Stationary Energy Storage Systems.
- UL 9540, Energy Storage Systems and Equipment; UL 9540A, Test Method for Evaluating Thermal Runaway Fire Propagation in Battery Energy Storage Systems; UL 1973, Batteries for Use in Stationary Applications; UL 1778, Uninterruptible Power Systems.
- IEEE Std 519-2022, IEEE Standard for Harmonic Control in Electric Power Systems.
- IEEE Std 1584-2018, IEEE Guide for Performing Arc-Flash Hazard Calculations (AC systems).
- IEEE Std 946, IEEE Recommended Practice for the Design of DC Power Systems for Stationary Applications.
- IEEE Std 493, IEEE Recommended Practice for the Design of Reliable Industrial and Commercial Power Systems (Gold Book).
- Doan, D. R., "Arc Flash Calculations for Exposures to DC Systems," IEEE Transactions on Industry Applications, 2010.
- Stokes, A. D. and Oppenlander, W. T., "Electric Arcs in Open Air," Journal of Physics D: Applied Physics, 1991.
- NERC, Large Loads Task Force materials and white papers on large computational loads.
- Open Compute Project, specifications for rack power and battery backup units (general reference).
Disclaimer
This article is provided by Keentel Engineering for general technical education. It is not engineering advice for any specific project. Architectures, efficiencies, fault currents, incident energies and other results are illustrative and simplified; actual values depend on equipment, settings, operating conditions and project-specific studies. Codes, standards, listings and utility requirements change over time, and local adoption varies; always consult the current approved documents and the authority having jurisdiction. Keentel Engineering accepts no liability for decisions made on the basis of this article without a project-specific engineering review.
© 2026 Keentel Engineering. All rights reserved. Written by Keentel Engineering.
| Office | Address | Phone |
|---|---|---|
| Head Office — Tampa | 400 N Ashley Dr STE #2600, Tampa FL 33602 | (813) 389-7871 |
| Austin | 5900 Balcones Drive STE 100, Austin TX 78731 | (512) 591-0752 |
| Sacramento | 1401 21st St Ste R, Sacramento CA 95811 | (916) 913-4524 |
| Baltimore | 306 W Redwood St STE 200, Baltimore MD 21201 | (410) 225-2181 |

About the Author:
Sandip "Sonny" R. Patel, P.E.
IEEE Senior Member · Founder & CEO, Keentel Engineering
In 1995, Sonny Patel earned his Electrical Engineering degree from the University of Illinois. But degrees don't build legacies — action does.
For three decades, he has worked the power industry from every side of the table: 16 years as a utility engineer at Exelon/Commonwealth Edison; generation leadership across hydroelectric, industrial steam turbine, and a 9 GW renewable fleet; NERC Regional Entity Senior Compliance Engineer and Audit Team Lead, auditing some of the nation's largest utilities; and testing and commissioning lead on equipment up to 765 kV — the very top of the North American grid.Utility. Generator. Regulator. Consultant. Few engineers have seen all four seats. Fewer still have sat in them.
His experience spans nuclear, hydro, conventional generation, renewables, oil and gas, mining — and today's data centers, where he is authoring a three-book series on data center design. He is a Licensed Professional Engineer in six states and a Licensed Electrical Contractor in Florida (Unlimited EC) — he doesn't just design the work; he's qualified to stand behind its execution.Today, as Founder and CEO of Keentel Engineering, Sonny leads a nationwide team of engineers delivering substation design, power system studies, NERC compliance, and commissioning — done right, coast to coast.Three decades. Every side of the table. One standard: accountable engineering.
Services

Let's Discuss Your Project
Let's book a call to discuss your electrical engineering project that we can help you with.
About the Author:
Sandip "Sonny" R. Patel, P.E.
IEEE Senior Member · Founder & CEO, Keentel Engineering
In 1995, Sonny Patel earned his Electrical Engineering degree from the University of Illinois. But degrees don't build legacies — action does.
For three decades, he has worked the power industry from every side of the table: 16 years as a utility engineer at Exelon/Commonwealth Edison; generation leadership across hydroelectric, industrial steam turbine, and a 9 GW renewable fleet; NERC Regional Entity Senior Compliance Engineer and Audit Team Lead, auditing some of the nation's largest utilities; and testing and commissioning lead on equipment up to 765 kV — the very top of the North American grid.
Utility. Generator. Regulator. Consultant. Few engineers have seen all four seats. Fewer still have sat in them.
His experience spans nuclear, hydro, conventional generation, renewables, oil and gas, mining — and today's data centers, where he is authoring a three-book series on data center design. He is a Licensed Professional Engineer in six states and a Licensed Electrical Contractor in Florida (Unlimited EC) — he doesn't just design the work; he's qualified to stand behind its execution.
Today, as Founder and CEO of Keentel Engineering, Sonny leads a nationwide team of engineers delivering substation design, power system studies, NERC compliance, and commissioning — done right, coast to coast.Three decades. Every side of the table. One standard: accountable engineering.
Leave a Comment
Thank you for contacting us.
We will get back to you as soon as possible.
We will get back to you as soon as possible.
Oops, there was an error sending your message.
Please try again later.
Please try again later.
Related Posts
By SANDIP R PATEL
•
November 5, 2026
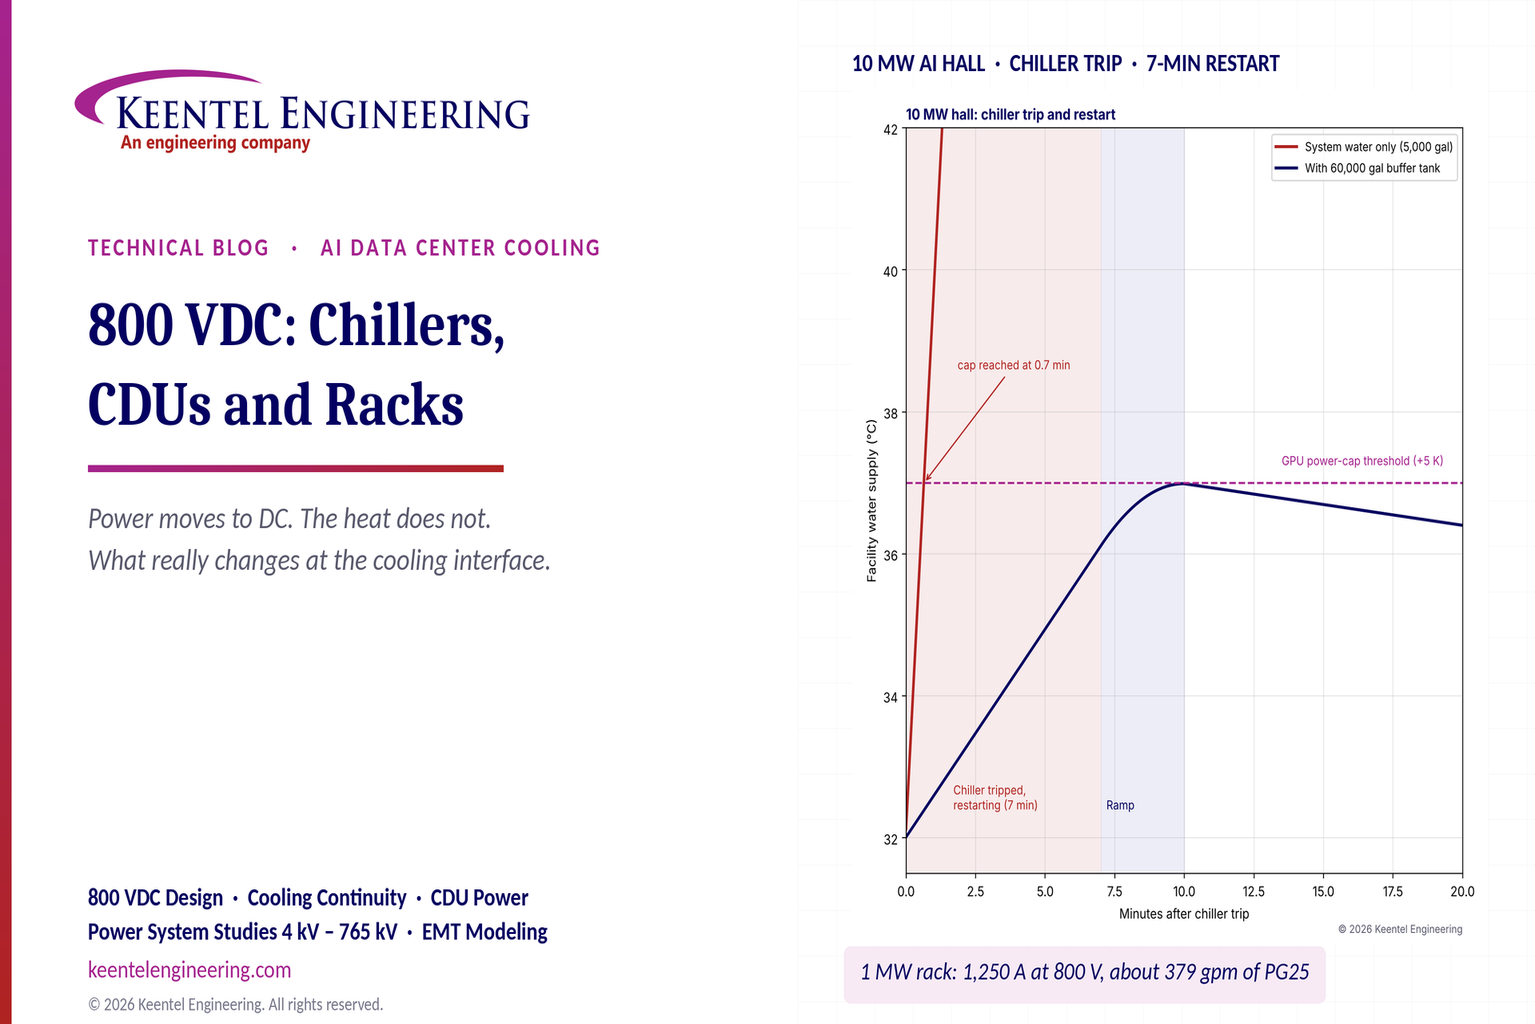
Learn how 800 VDC affects AI data center cooling, including chillers, CDUs, liquid-cooled racks, pump backup and DC safety. Keentel Engineering, USA.
By SANDIP R PATEL
•
November 5, 2026
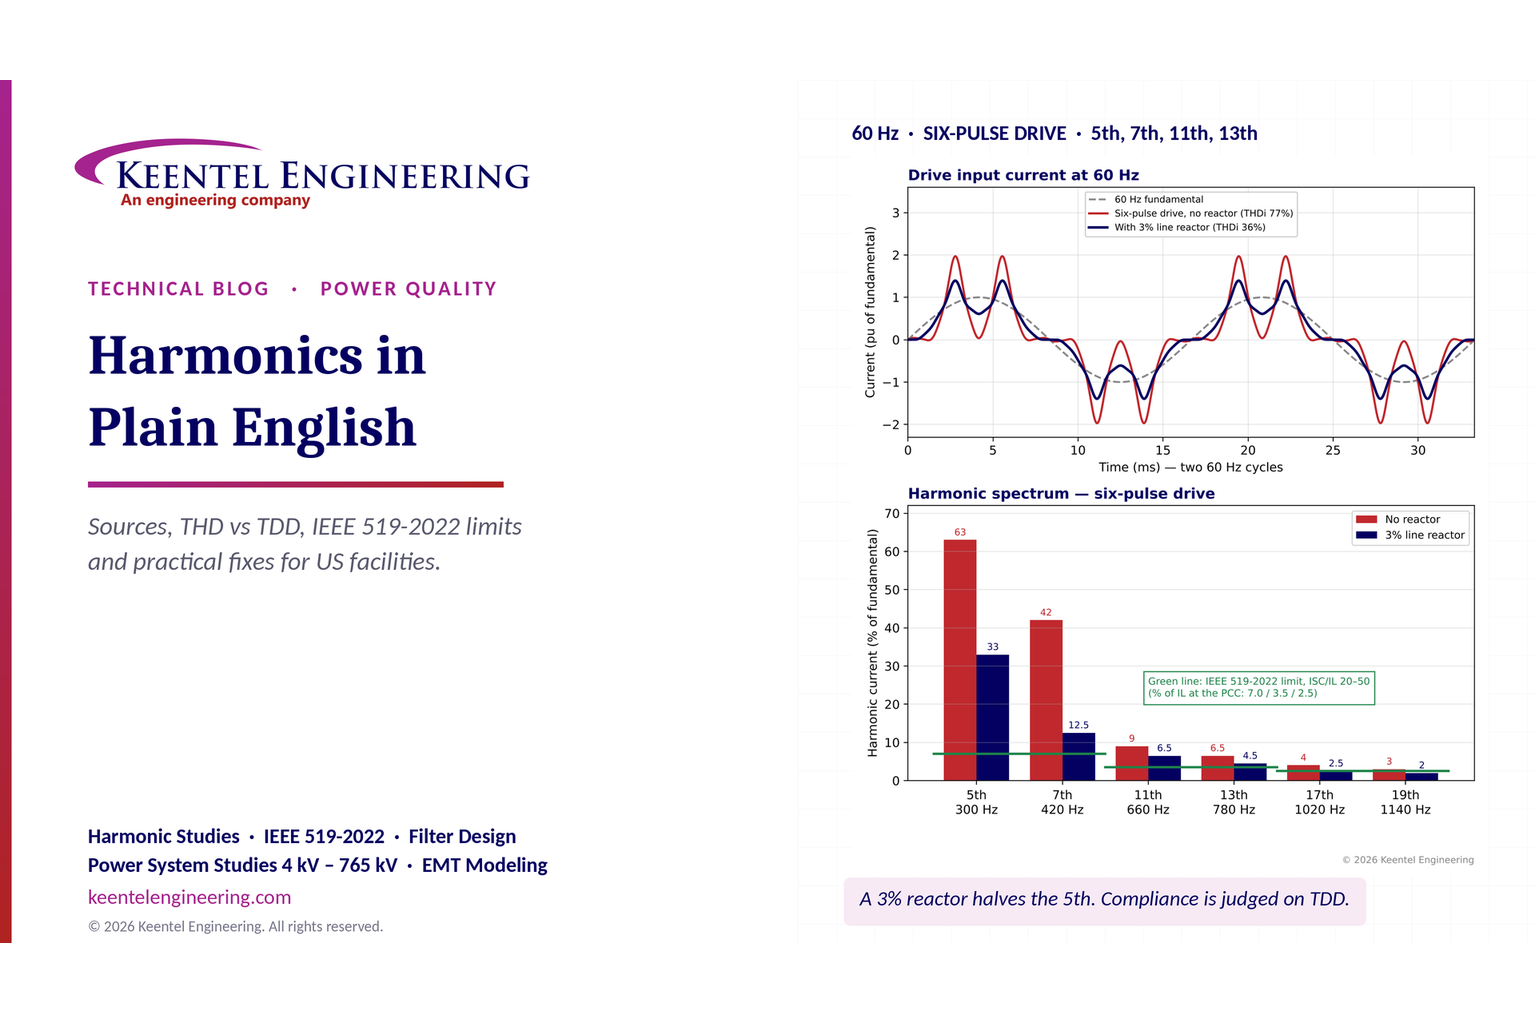
Understand electrical harmonics, THD vs TDD and IEEE 519-2022 limits. Keentel Engineering explains US harmonic studies, equipment risks and mitigation.
By SANDIP R PATEL
•
November 5, 2026
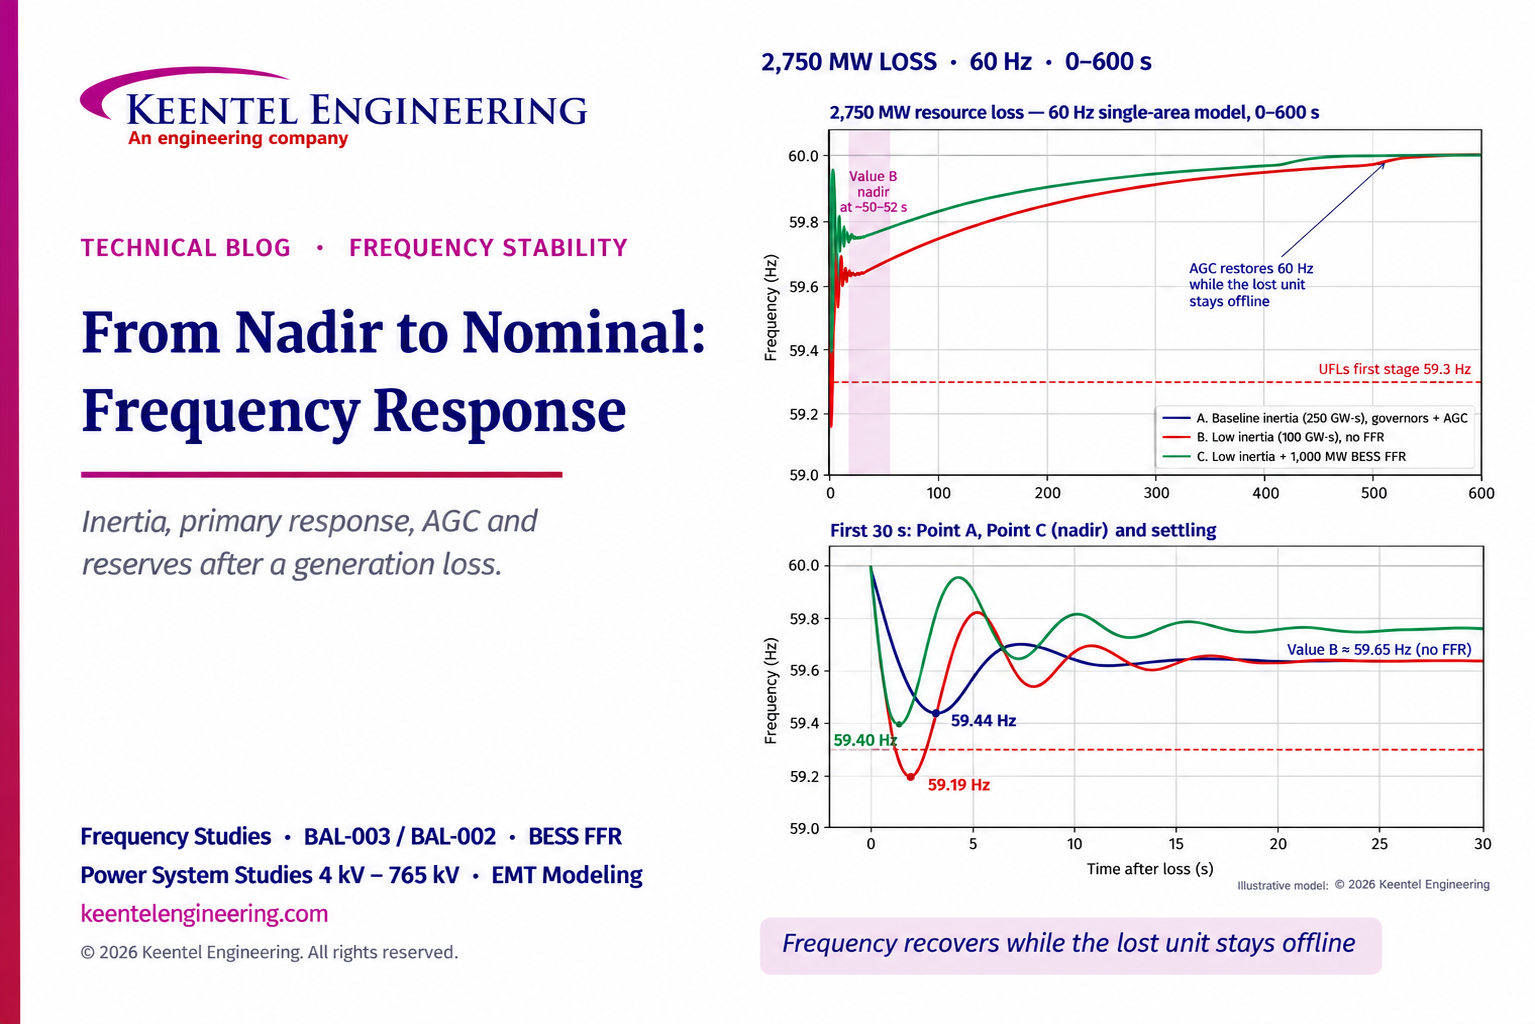
Explore four stages of US grid frequency recovery after generation loss, from inertia and primary response to AGC and reserves, with Keentel Engineering.
By SANDIP R PATEL
•
November 5, 2026
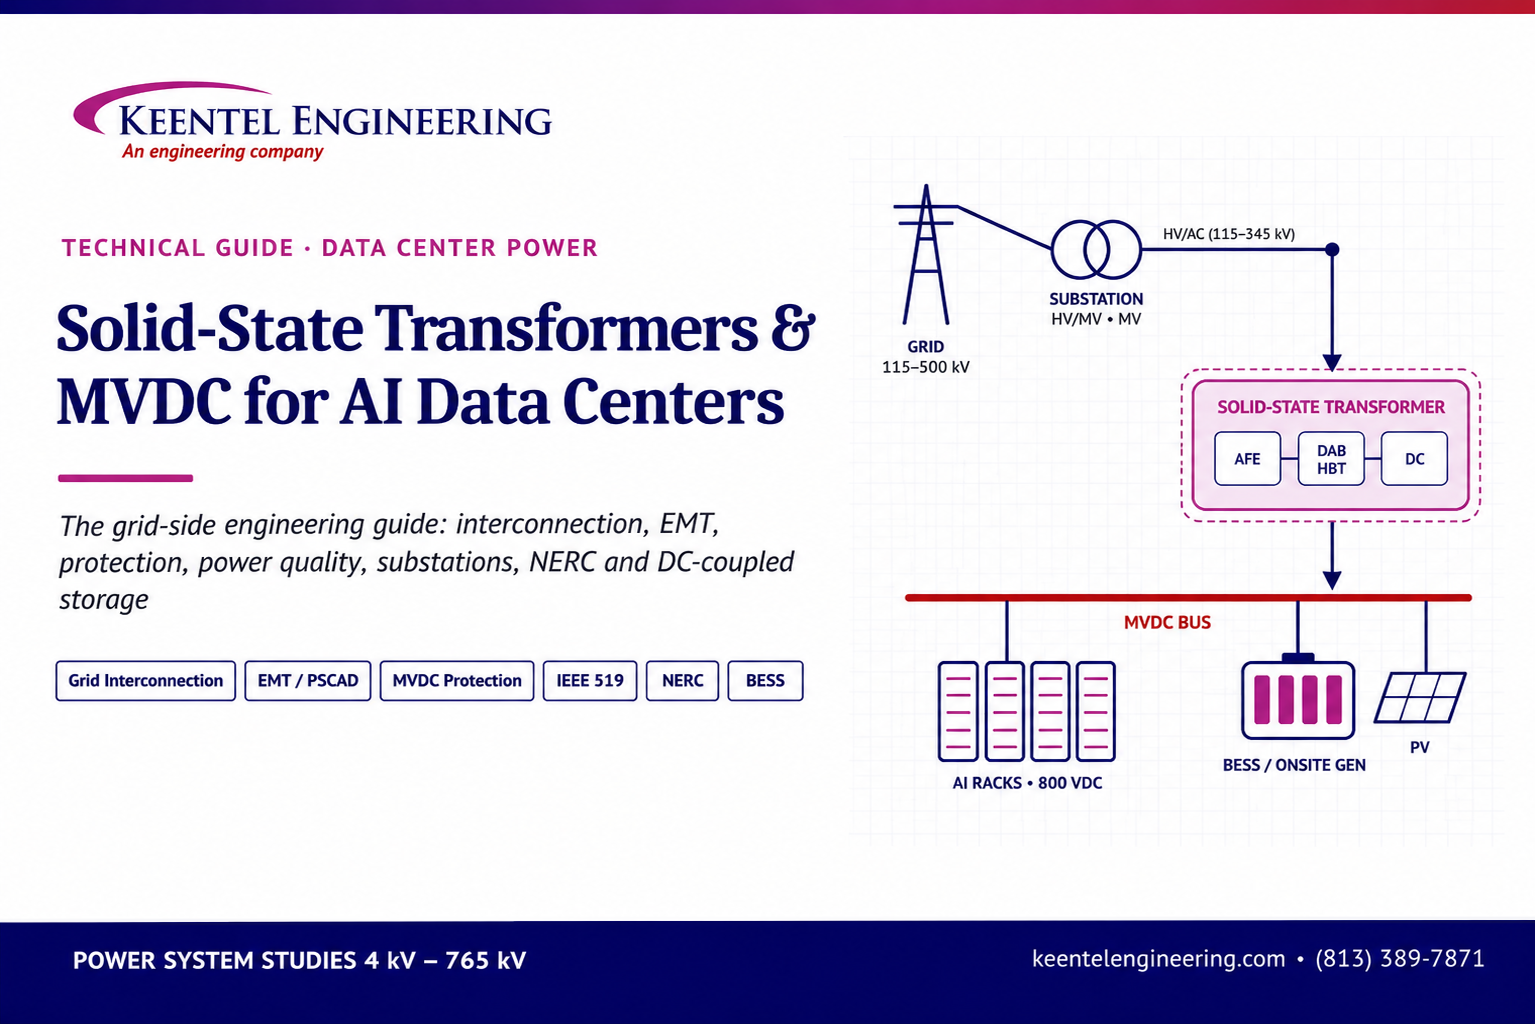
Explore solid-state transformers and MVDC for AI data centers. Keentel Engineering covers US grid interconnection, EMT modeling and protection studies.
By SANDIP R PATEL
•
November 5, 2026
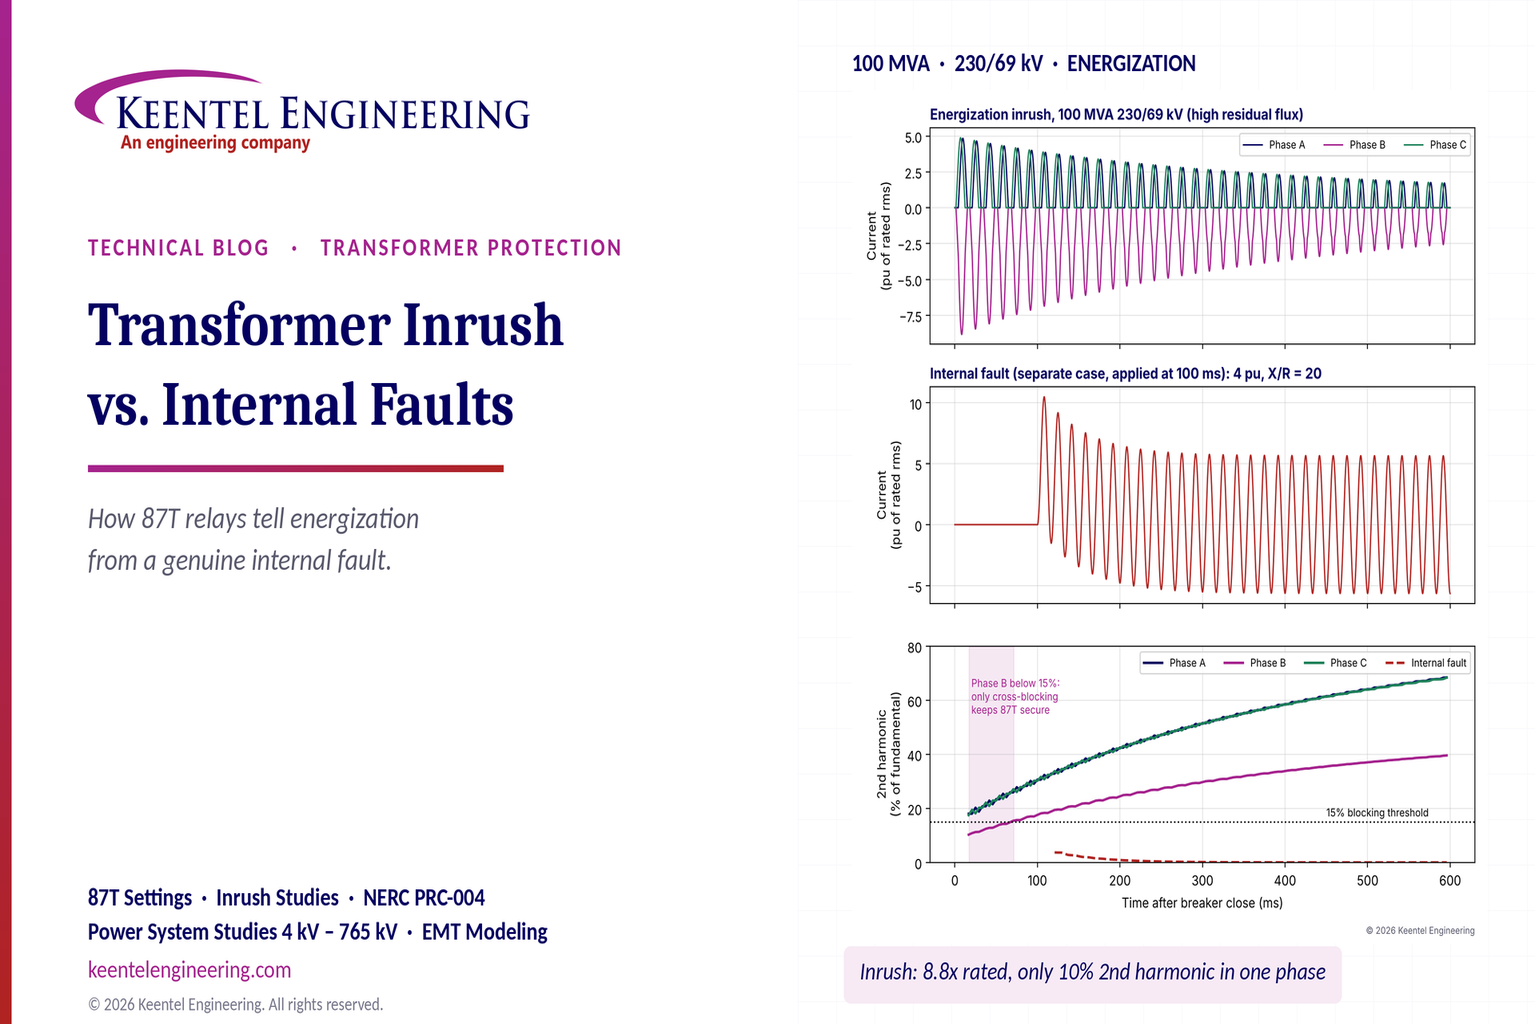
Learn how 87T relays distinguish transformer inrush from internal faults, with harmonic blocking, EMT studies and US examples from Keentel Engineering.
By SANDIP R PATEL
•
November 5, 2026
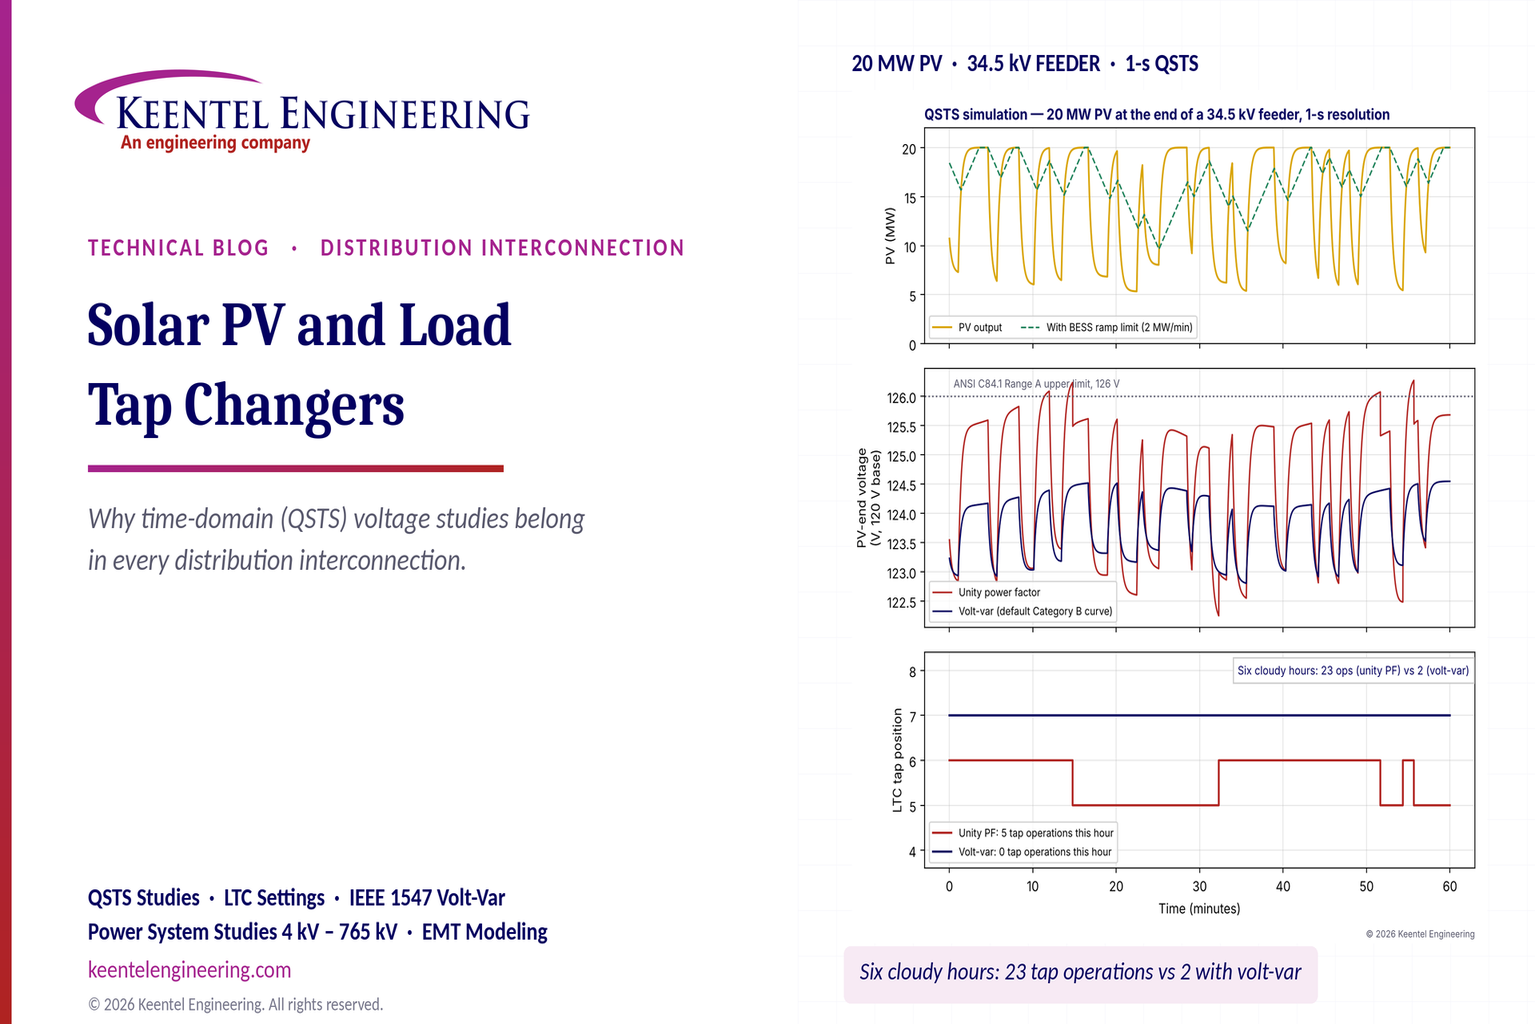
Learn why US solar PV interconnections need QSTS voltage studies for load tap changers, feeder voltage and smart inverter controls. By Keentel Engineering.
By SANDIP R PATEL
•
October 31, 2026
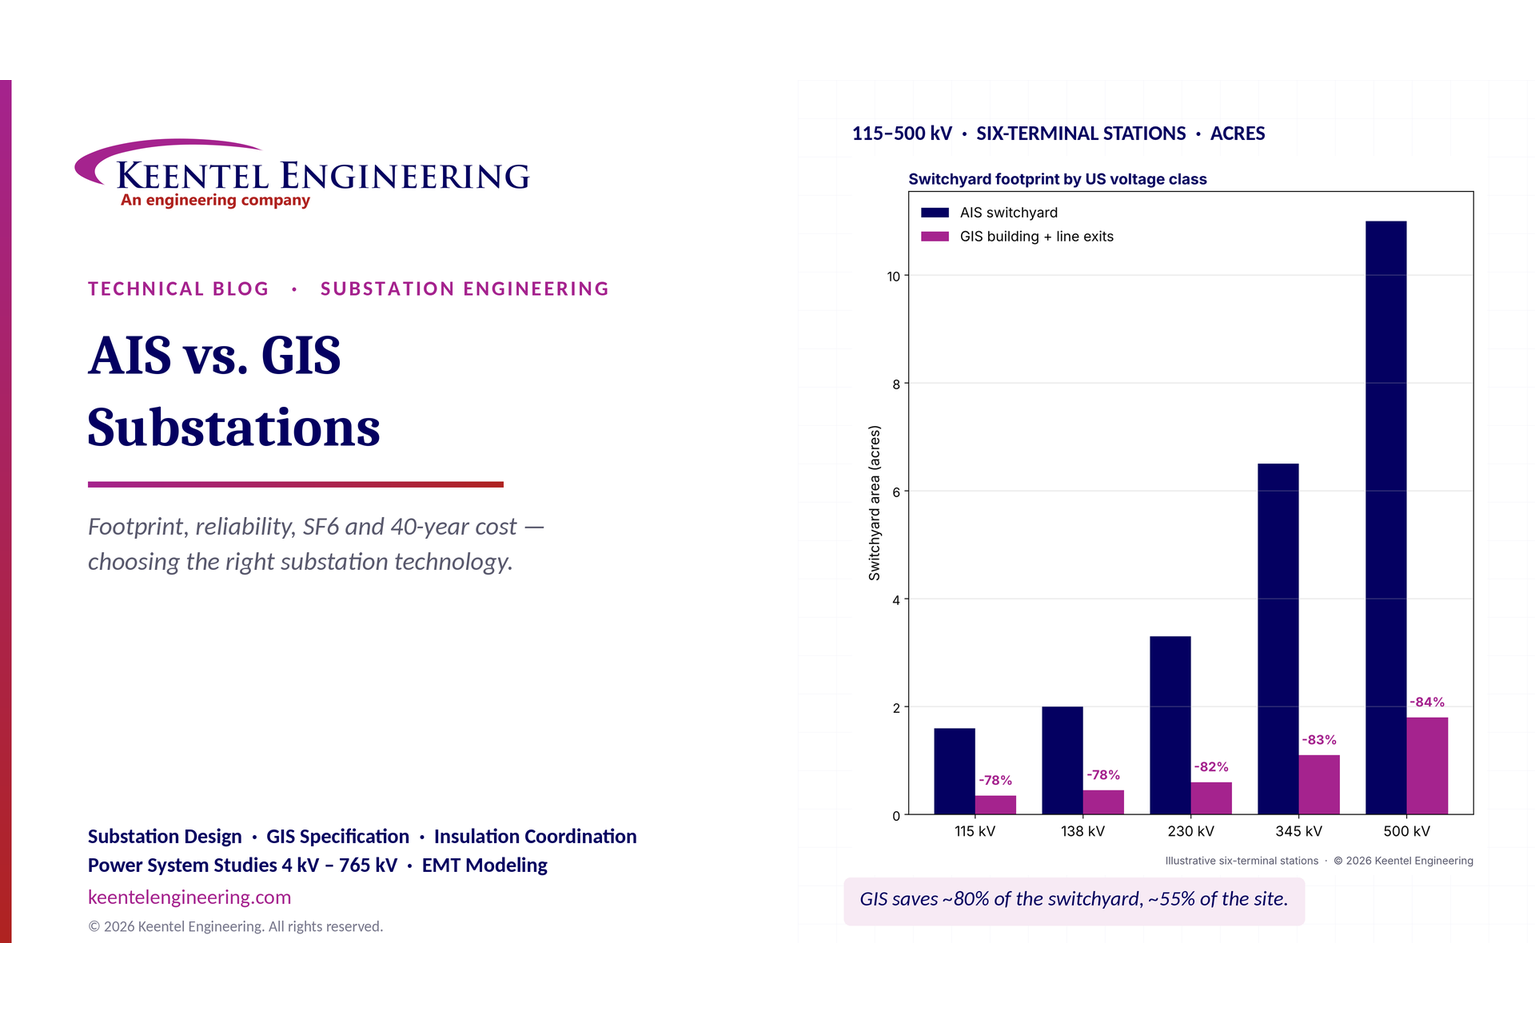
Compare AIS vs GIS substations by cost, footprint, reliability, maintenance and SF6 impact. Explore design differences and life-cycle costs for US substations.
By SANDIP R PATEL
•
October 30, 2026
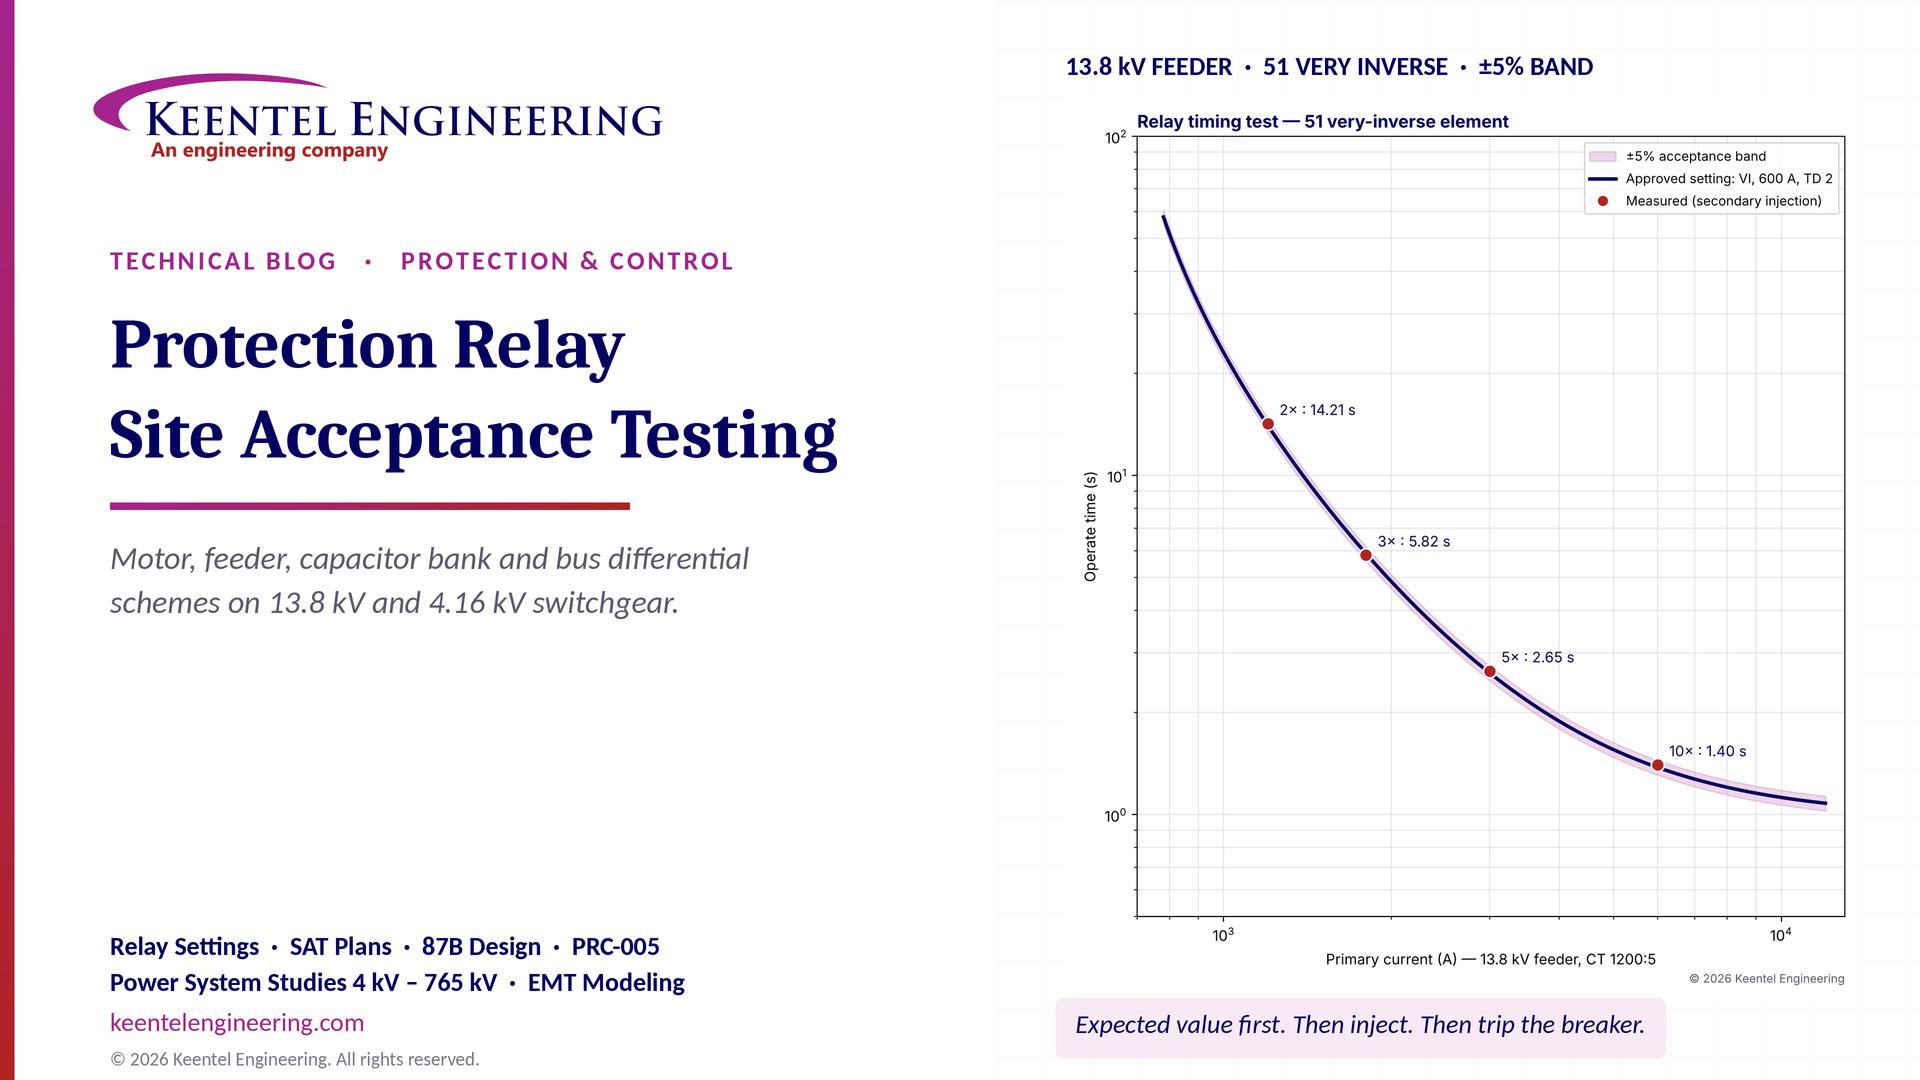
Protection relay site acceptance testing (SAT) guide covering CT/VT checks, secondary injection, motor relays, 87B bus differential and IEEE/NETA standards.

By SANDIP R PATEL
•
October 30, 2026
Understand SPP HILL requirements, HDPS interconnection studies, voltage and frequency ride-through, EMT modeling, weak-grid screening, and compliance.