
A Coordinated Electric System Interconnection Review—the utility’s deep-dive on technical and cost impacts of your project.
Challenge: Frequent false tripping using conventional electromechanical relays
Solution: SEL-487E integration with multi-terminal differential protection and dynamic inrush restraint
Result: 90% reduction in false trips, saving over $250,000 in downtime
The three operating regions you have to design to
| Device | Output vs voltage | Response | Best suited to | Main limitations |
|---|---|---|---|---|
| Mechanically switched capacitor or reactor | Proportional to voltage squared | Seconds; discrete steps; limited switching operations per day | Steady-state reactive supply, voltage profile, loss reduction | No dynamic capability; step voltage change on switching; capability collapses when most needed |
| Static var compensator | Capacitive branches proportional to voltage squared | A few cycles; continuously controllable | Continuous control where cost matters and deep voltage support is not the driver | Square-law capability loss; harmonic filters are part of the plant and interact with the network |
| STATCOM | Approximately proportional to voltage — constant current capability | One to two cycles closed loop; converter response faster still | Voltage stability margin, weak interconnections, fast disturbance recovery, flicker and unbalance compensation | Higher capital cost; converter losses; adds a converter and its control dynamics to the network |
| Synchronous condenser | Governed by machine capability and excitation | Excitation response in the hundreds of milliseconds; inherent inertial response instantaneous | System strength and inertia, short-circuit contribution, black start support | Rotating plant with maintenance and losses; slower controlled response than a converter |
| STATCOM with energy storage | Reactive as a STATCOM, plus real power within the storage rating | As STATCOM for reactive; real power limited by storage | Where a real power deficiency is part of the problem | Cost and complexity of the storage; different failure and maintenance profile |
| Stage | Keentel scope | Outcome |
|---|---|---|
| Screening | Series-compensation proximity, radial contingency review, UIF and short-circuit ratio screening, frequency scans | Early identification of which SSO types apply |
| Detailed studies | PSCAD/EMTDC EMT studies with vendor real-code models, impedance-based and frequency-scan analysis | Clear evidence of stability margins or risk |
| Model quality | EMT model review, benchmarking against positive-sequence models, model acceptance support | Models that system operators accept |
| Mitigation | Control retuning recommendations with vendors, SSDC and bypass logic requirements, protection and monitoring specifications | Practical, coordinated solutions |
| Interconnection support | SSR and SSO study reports for ISO and utility requirements, response to reviewer comments | Fewer delays in the interconnection process |
Resilience: designing CDUs to the facility Tier objective
Liquid cooling makes heat removal more critical, not less. Cold plates hold only seconds of thermal buffer. If TCS flow stops, processors throttle or shut down very quickly. Resilience design must therefore cover:
- Pump redundancy: N+1 pumps at minimum, with automatic changeover.
- CDU redundancy: N+1 CDUs on a common TCS header, or 2N CDUs serving A and B manifolds for fault-tolerant designs.
- Power to CDUs: dual-corded CDUs fed from A and B sources, with pumps and controls on UPS power so coolant keeps flowing through a utility failure and generator start. This is the liquid-cooling equivalent of continuous cooling.
- Facility water continuity: chilled water or condenser water must also continue, through thermal storage, UPS-backed pumps or a high enough FWS temperature that the TCS can coast on stored thermal mass for the transfer period.
- Concurrent maintainability: isolation valves so any CDU, pump, filter or manifold section can be serviced without stopping the others.
- Leak management: leak detection, drip trays, automatic isolation valves and procedures for fluid spills.
Electrical engineering considerations
CDUs and liquid-cooling plants are electrical loads with their own design requirements:
- Pump motors and VFDs. Large CDUs use variable-frequency drives on their pump motors. These introduce harmonic current that must be included in the facility's harmonic study and IEEE 519 evaluation.
- Critical mechanical load on UPS. Putting CDU pumps on UPS increases UPS and battery sizing. The mechanical UPS load must be included in redundancy and ride-through calculations.
- Feeder and protection design. Dual feeds, automatic transfer, selective coordination and arc-flash labelling apply to CDU power distribution just as they do to IT power.
- Generator transient response. CDU pumps restarting together after a transfer create motor inrush on the generators. Staged restarts and soft acceleration reduce the step load.
- Load dynamics. AI training loads can swing rapidly between high and low power. Cooling controls must track those swings without temperature overshoot, and electrical systems must handle both the IT and the cooling load changes.
Commissioning a liquid-cooled data hall
- Flush and clean the TCS piping and manifolds to the specified cleanliness, using high-purity flush water.
- Fill and vent with the specified coolant, verifying glycol concentration and chemistry.
- Pressure test for leaks at design and test pressures, including quick-disconnect fittings.
- Verify sensors and controls: flow meters, temperature sensors, pressure transmitters, leak detection and BMS points.
- Load test with heat load banks connected through the cold-plate interfaces or rack manifolds, across the operating range.
- Prove the heat balance on both loops at several load steps, and the approach temperature against the design.
- Test failure scenarios: pump failure, CDU failure, power transfer to generator, valve failure and loss of facility water, confirming temperatures stay within the IT vendor's limits.
How Keentel Engineering helps
Keentel Engineering supports data center owners, developers and EPCs with the electrical engineering that liquid-cooled facilities depend on, and coordinates with the mechanical engineer of record and cooling vendors on the integrated design.
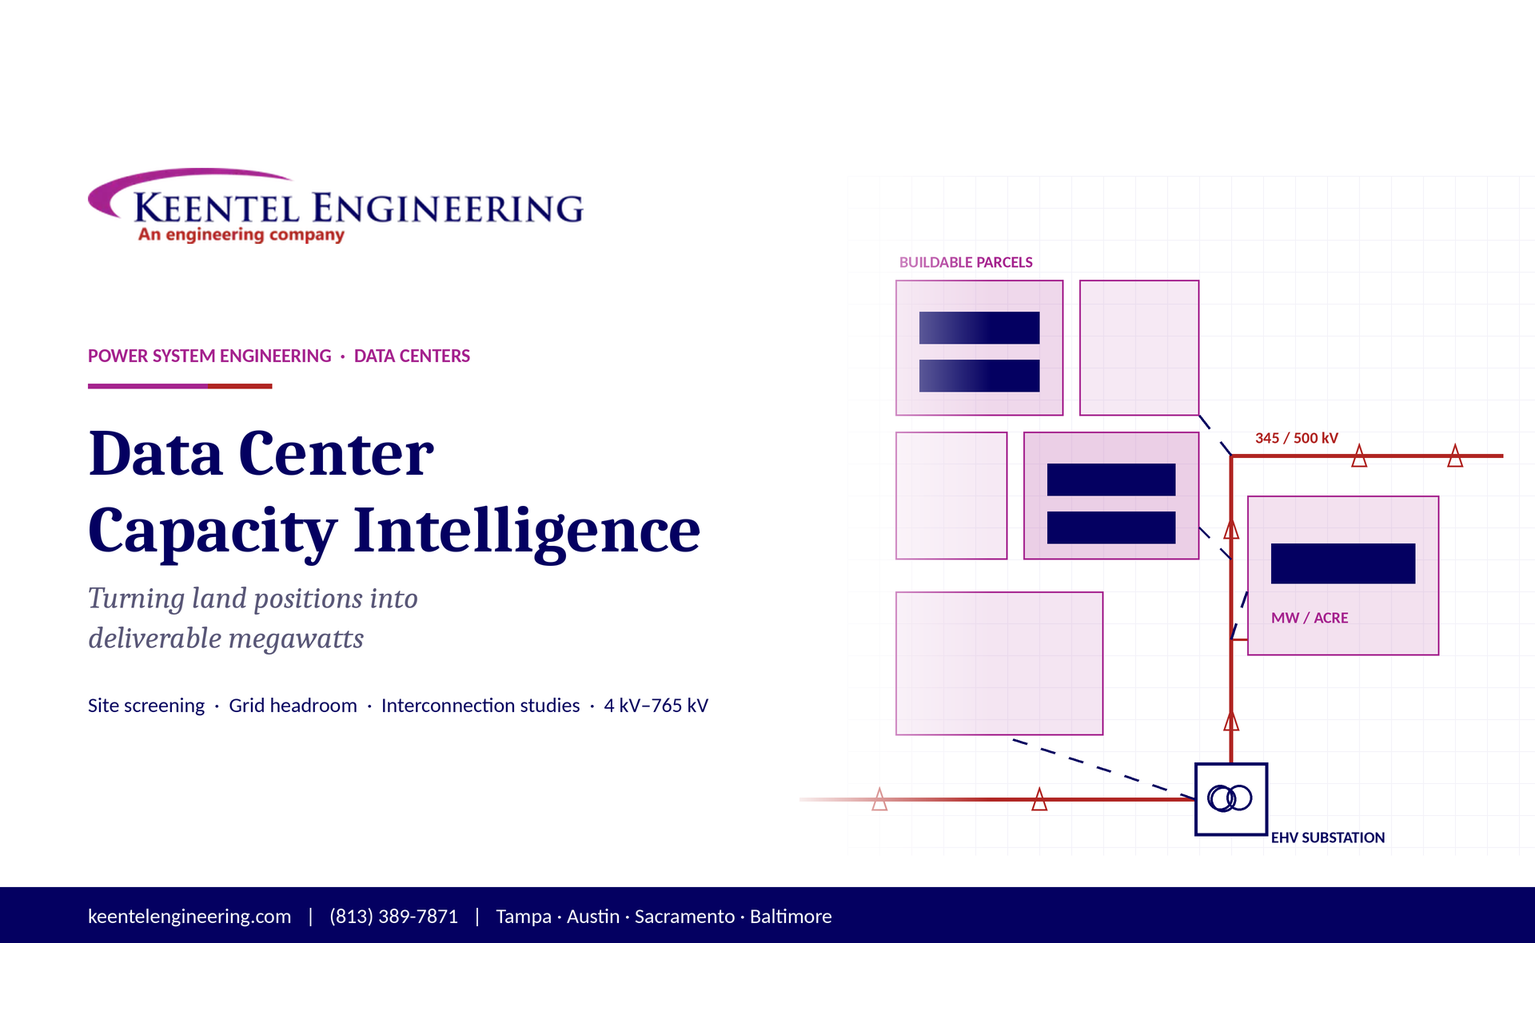
Data Center Capacity Intelligence: Turning Land Positions Into Deliverable Megawatts
October 13, 2026 | Blog
Know where the next gigawatt can land — and whether the grid can carry it. Keentel Engineering pairs land-position screening with transmission-grade power system engineering, so developers, utilities and investors can secure strategic sites, plan grid capacity with confidence, and move from parcel to energized campus faster.
Most market intelligence stops at the map. Keentel’s work starts there: we translate acreage into a defensible megawatt number, then test that number against the substations, lines and interconnection rules that decide whether it can be delivered. The result is a site and capacity picture you can take to a board, a lender or a utility.
Land Comes First: Why Parcels Predict Where Data Center Load Will Land
Before a hyperscale campus is announced, the land is usually already bought. Large technology companies and co-location developers routinely acquire parcels through subsidiaries and special-purpose entities, often years before a press release or a utility load request becomes public.
That creates a window. Teams that can link parcel ownership records to the developers behind them can see emerging load clusters early — while there is still time to plan transmission, secure interconnection positions and price land correctly.
The pattern is consistent across the market:
- Hyperscalers buy big. Large technology firms favor contiguous sites of several hundred acres that can host multi-building, multi-hundred-megawatt campuses.
- Co-location developers buy flexibly. Firms serving multiple tenants hold a wider spread of smaller sites sized for phased builds.
- Land is banked years ahead. Major developers commonly hold enough land to sustain many years of construction at their current pace, so today’s quiet parcel is tomorrow’s load request.
- New regions are emerging. Beyond the established hubs, large land positions are appearing in less traditional markets farther from population centers, where AI training facilities can trade latency for land and power.
For anyone planning the grid, that last point matters most. A load cluster that appears in a region with little historical data center development can outrun the local
transmission plan.
From Acres to Megawatts: How Capacity Potential Is Estimated
A site’s capacity potential is its buildable land multiplied by how much power that land can realistically host. Five terms carry the analysis:
| Term | What it measures |
|---|---|
| Buildability | Share of a parcel that can actually be developed after setbacks, wetlands, floodplain, slopes and easements |
| Parcel density | Share of buildable land covered by data center buildings |
| Building power density | Power consumed per acre of building footprint (MW/acre) |
| Land power density | Power consumed per acre of buildable land (MW/acre) — parcel density × building power density |
| Capacity potential | Total load a site could host if fully developed as planned |
Capacity potential (MW) = Total acres × Buildability × Land power density. Illustrative only: 1,000 total acres × 80% buildability × 1.5 MW/acre ≈ 1,200 MW of potential load.
The spread between developers is wide. Operators that pair dense building layouts with high-density, liquid-cooled AI halls extract far more megawatts per acre than those running older, lower-density designs. Two parcels of equal size can differ by several times in deliverable load — which is why a flat “MW per acre” rule of thumb is a starting point, not an answer.
The Regional Picture: Where Land and Grid Headroom Diverge
Buildable data center land is concentrated in PJM and the non-RTO West, but the fastest-changing markets are those with little legacy data center load. Each region presents a different engineering problem:
| Region | Land-position pattern | Engineering question Keentel tests |
|---|---|---|
| PJM | Largest hyperscaler land holdings; dense AI-ready designs in Northern Virginia and new clusters in rural Virginia, Ohio and Illinois | Can 500 kV / 230 kV backbone and load-serving substations absorb multi-GW additions on the developer's schedule? |
| West (non-RTO) | Large hyperscaler positions in the Pacific Northwest, Nevada and Arizona | Which utility planning process applies, and what transmission upgrades does a new campus trigger? |
| MISO | Emerging market; large tracts in Iowa, Illinois, Louisiana and beyond, far from population centers | Is there a nearby EHV source, and how do large-load studies interact with the generator queue? |
| ERCOT | Strong co-location and "powered land" activity | How do large-load interconnection and ride-through requirements shape the design? |
| SPP and Southeast | Strategic positions by co-location developers avoiding direct hyperscaler competition | What is the realistic substation and line build needed to serve the site? |
| CAISO, NYISO, ISO-NE | Mature, near saturation; limited new land | Can existing sites be upgraded or densified? |
Two lessons hold everywhere. First, most high-potential zones have developed only a fraction of the land already held, so long-term load growth is already “bought.” Second, land in hand does not guarantee megawatts — the grid decides that.
Why Acreage Is Not Capacity: The Grid Engineering Reality
A parcel’s theoretical megawatts become real only when a utility can deliver them reliably. That is where most site strategies stall, and where engineering-grade analysis changes the answer:
- Distance to EHV/HV transmission. A 1 GW campus typically needs a 230 kV, 345 kV or 500 kV source. Miles of new line, right-of-way and permitting can add years.
- Substation and transformer capacity. Existing stations rarely have spare bays or transformer headroom for hundreds of megawatts; large power transformer lead times remain long.
- Thermal and voltage limits. Load-flow and contingency analysis (N-1, N-1-1) shows whether the surrounding network can carry the new load without overloads or voltage collapse.
- Short-circuit and protection impacts. New stations and lines change fault duty and relay coordination across the area.
- Load behavior and ride-through. Large power-electronic loads can trip offline together during grid faults. Utilities, ISOs and NERC now scrutinize large-load modeling, voltage ride-through and dynamic performance.
- Interconnection process and timing. Large-load study queues, co-location rules and utility tariffs vary by market and set the real schedule.
- On-site and co-located generation. Gas turbines, solar, BESS or nuclear co-location can bridge capacity gaps but bring their own interconnection and compliance requirements.
The bottom line:
the gap between “capacity potential” and “deliverable capacity” is a power system engineering question — and it is the one Keentel answers.
How Keentel Delivers Data Center Capacity Intelligence
Keentel combines market screening with the same power system studies we perform for utility-scale interconnections, from 4 kV to 765 kV. Engagements run in five stages, each usable on its own:
- Land and load screening — Map candidate and competitor parcels, ownership clusters and announced or rumored large loads within a target region or utility territory.
- Capacity potential estimate — Convert buildable acreage into a megawatt range using developer-appropriate densities and phased build assumptions.
- Grid proximity and headroom review — Identify nearby EHV/HV lines and substations, available bays, transformer capacity and planned upgrades.
- Power system studies — Steady-state load flow, contingency, short-circuit and, where required, dynamic and EMT studies of the proposed load and any co-located generation or BESS.
- Interconnection and delivery roadmap — Utility and ISO process, required upgrades, realistic energization timeline, NERC considerations and owner’s engineer support through design and construction.
What You Receive
- Ranked site shortlist with megawatt range and grid-readiness score per site
- Interconnection feasibility memo per site: source options, upgrades and schedule risks
- Study reports suitable for utility discussions, investment committees and lenders
- Conceptual one-lines and substation / transmission scope for the preferred site
- Market brief for the target region: competing land positions and load clusters
Who It Serves
Data center developers and hyperscaler site teams, powered-land and real estate investors, utilities and cooperatives planning for large loads, IPPs pursuing co-location, and lenders needing independent technical review.
Frequently Asked Questions
It is the analysis of where large data center load is likely to appear, how many megawatts a site can host, and whether the grid can deliver that power on schedule. Keentel combines land and load screening with power system engineering to answer all three.
Market reports estimate potential from land and density assumptions. Keentel goes further and tests that potential against real transmission, substation and interconnection constraints, so the result is a deliverable capacity, not just a theoretical one.
We apply buildability, building coverage and power density assumptions suited to the developer type and cooling design, then present a range rather than a single number. The estimate is refined once grid studies identify the binding constraint.
Wetlands, floodplain, slopes, setbacks and easements can remove a large share of a parcel. Capacity follows the developable footprint, not the deed.
Yes. Our grid proximity review and feasibility studies identify the nearest viable EHV/HV source, required upgrades and a realistic energization window for that site.
Typically load flow, N-1 and N-1-1 contingency, short-circuit and protection impact analysis. Dynamic stability, voltage ride-through and EMT studies are added when the utility, ISO or load characteristics require them.
All major U.S. markets, including PJM, MISO, ERCOT, SPP, CAISO, NYISO, ISO-NE and non-RTO utilities in the West and Southeast.
A regional screening can be completed in a few weeks. Site-specific feasibility studies depend on data availability and utility coordination; we confirm the schedule at scoping.
Yes. We study on-site gas, solar, BESS and other co-located resources alongside the load, including interconnection and compliance implications.
Yes. Keentel provides substation and transmission line design, protection and control, NERC compliance support and owner’s engineer services through construction and energization.
Data center developers, hyperscaler site-selection teams, powered-land investors, utilities and cooperatives, IPPs and lenders.
We share results, assumptions and findings needed for decisions. Keentel’s study methodologies, workflows and tool configurations remain proprietary.
No. Capacity estimates are professional engineering opinions. Final service capacity and timing are set by the utility, ISO and regulators.
Start a Capacity Assessment
Holding land, evaluating a site or planning for a large-load cluster? Talk to Keentel’s power system team before the next acquisition or utility request.
Book a 15-minute scoping call: calendly.com/keentel-engineering/15min
Phone: (813) 389-7871 Email: contact@keentelengineering.com
Offices:
Tampa, FL (HQ) · Austin, TX · Sacramento, CA · Baltimore, MD
| Office | Address | Phone |
|---|---|---|
| Head Office — Tampa | 400 N Ashley Dr STE #2600, Tampa FL 33602 | (813) 389-7871 |
| Austin | 5900 Balcones Drive STE 100, Austin TX 78731 | (512) 591-0752 |
| Sacramento | 1401 21st St Ste R, Sacramento CA 95811 | (916) 913-4524 |
| Baltimore | 306 W Redwood St STE 200, Baltimore MD 21201 | (410) 225-2181 |

About the Author:
Sandip "Sonny" R. Patel, P.E.
IEEE Senior Member · Founder & CEO, Keentel Engineering
In 1995, Sonny Patel earned his Electrical Engineering degree from the University of Illinois. But degrees don't build legacies — action does.
For three decades, he has worked the power industry from every side of the table: 16 years as a utility engineer at Exelon/Commonwealth Edison; generation leadership across hydroelectric, industrial steam turbine, and a 9 GW renewable fleet; NERC Regional Entity Senior Compliance Engineer and Audit Team Lead, auditing some of the nation's largest utilities; and testing and commissioning lead on equipment up to 765 kV — the very top of the North American grid.Utility. Generator. Regulator. Consultant. Few engineers have seen all four seats. Fewer still have sat in them.
His experience spans nuclear, hydro, conventional generation, renewables, oil and gas, mining — and today's data centers, where he is authoring a three-book series on data center design. He is a Licensed Professional Engineer in six states and a Licensed Electrical Contractor in Florida (Unlimited EC) — he doesn't just design the work; he's qualified to stand behind its execution.Today, as Founder and CEO of Keentel Engineering, Sonny leads a nationwide team of engineers delivering substation design, power system studies, NERC compliance, and commissioning — done right, coast to coast.Three decades. Every side of the table. One standard: accountable engineering.
Services

Let's Discuss Your Project
Let's book a call to discuss your electrical engineering project that we can help you with.
About the Author:
Sandip "Sonny" R. Patel, P.E.
IEEE Senior Member · Founder & CEO, Keentel Engineering
In 1995, Sonny Patel earned his Electrical Engineering degree from the University of Illinois. But degrees don't build legacies — action does.
For three decades, he has worked the power industry from every side of the table: 16 years as a utility engineer at Exelon/Commonwealth Edison; generation leadership across hydroelectric, industrial steam turbine, and a 9 GW renewable fleet; NERC Regional Entity Senior Compliance Engineer and Audit Team Lead, auditing some of the nation's largest utilities; and testing and commissioning lead on equipment up to 765 kV — the very top of the North American grid.
Utility. Generator. Regulator. Consultant. Few engineers have seen all four seats. Fewer still have sat in them.
His experience spans nuclear, hydro, conventional generation, renewables, oil and gas, mining — and today's data centers, where he is authoring a three-book series on data center design. He is a Licensed Professional Engineer in six states and a Licensed Electrical Contractor in Florida (Unlimited EC) — he doesn't just design the work; he's qualified to stand behind its execution.
Today, as Founder and CEO of Keentel Engineering, Sonny leads a nationwide team of engineers delivering substation design, power system studies, NERC compliance, and commissioning — done right, coast to coast.Three decades. Every side of the table. One standard: accountable engineering.
Leave a Comment
Thank you for contacting us.
We will get back to you as soon as possible.
We will get back to you as soon as possible.
Oops, there was an error sending your message.
Please try again later.
Please try again later.
Related Posts
By SANDIP R PATEL
•
October 11, 2026
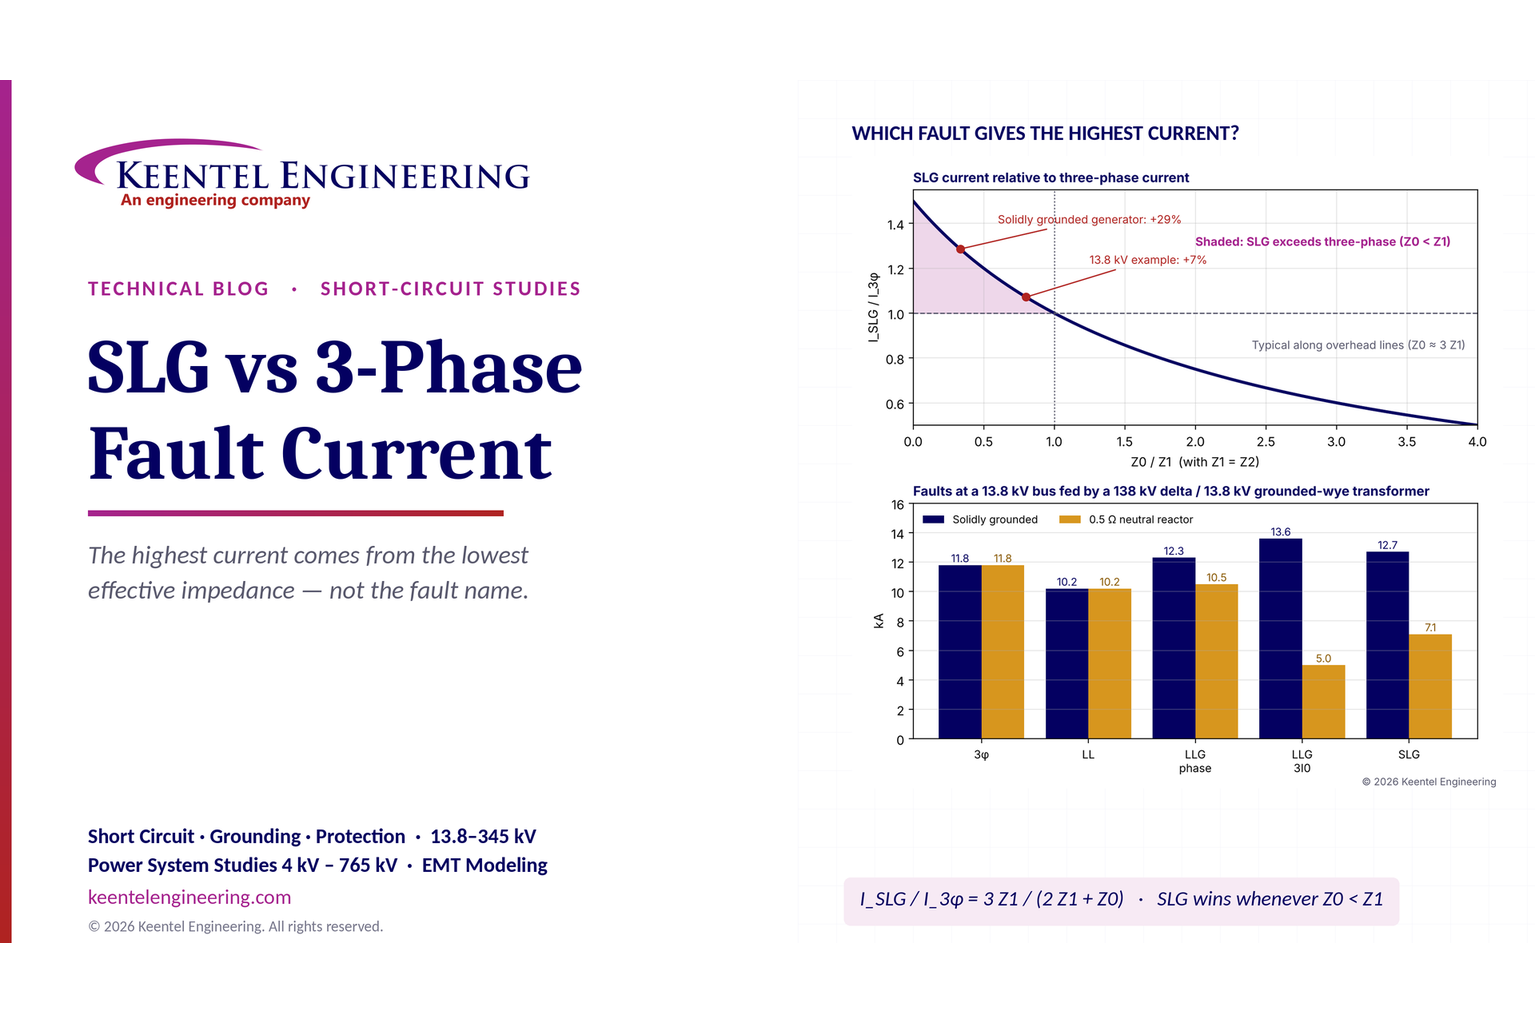
Learn which fault produces the highest current at a bus, why SLG faults can exceed three-phase faults, and how symmetrical components determine fault duty.
By SANDIP R PATEL
•
October 11, 2026
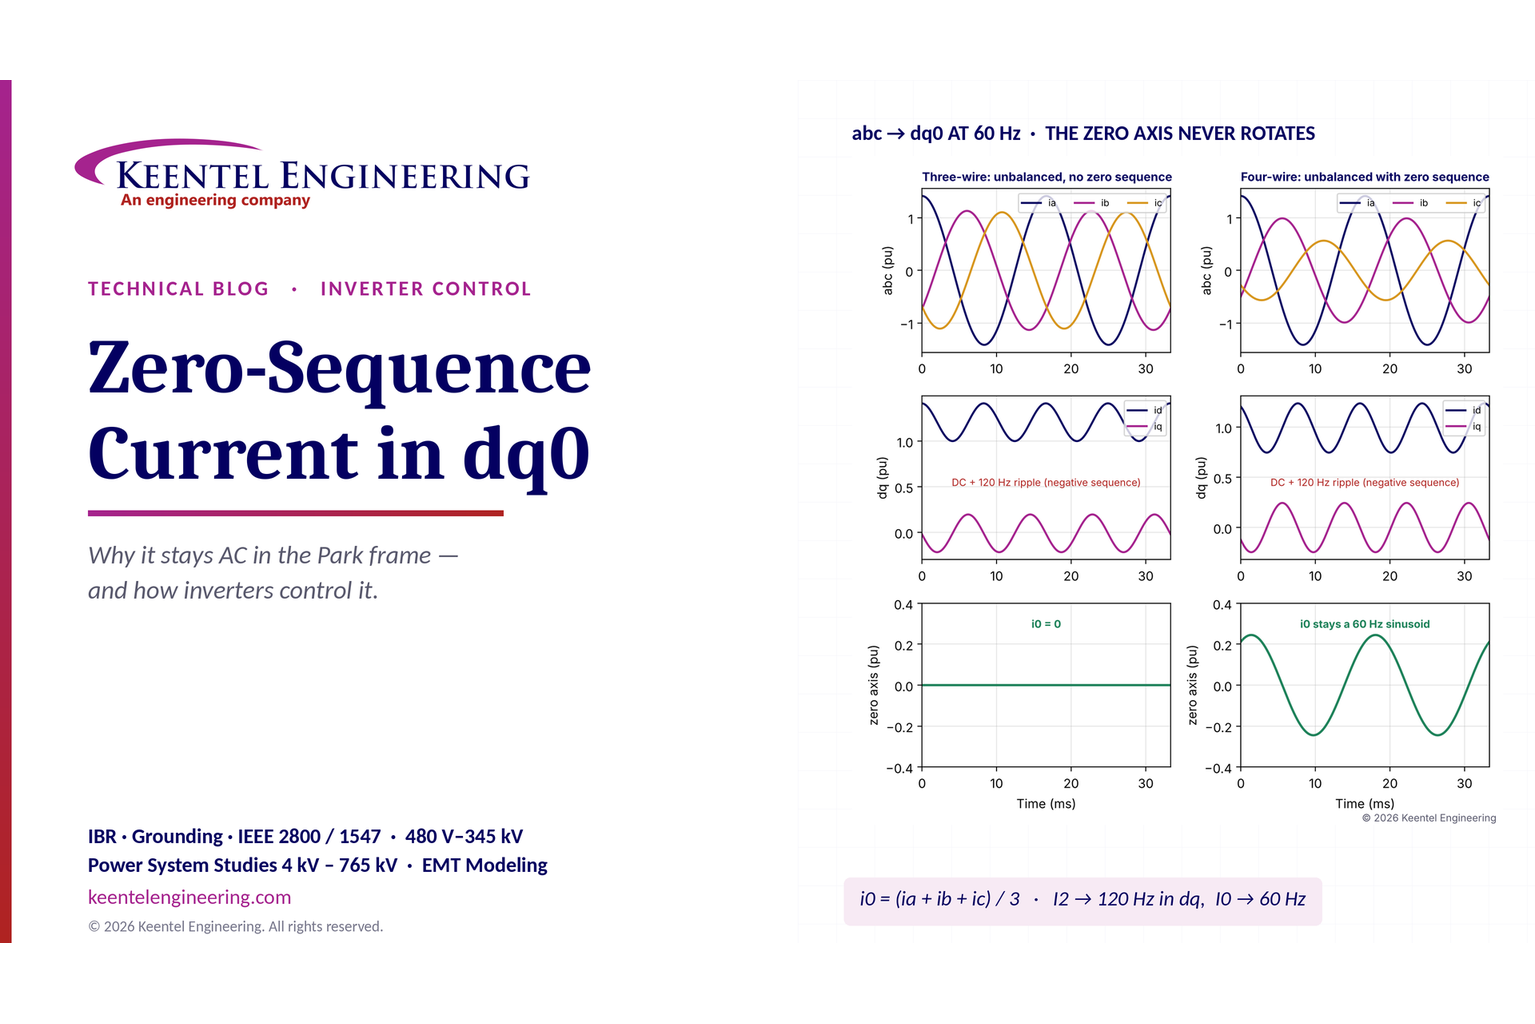
Learn why zero-sequence current pulsates in the dq0 frame, how Park's transformation works, and how inverter controls handle unbalance and ground faults.
By SANDIP R PATEL
•
October 11, 2026
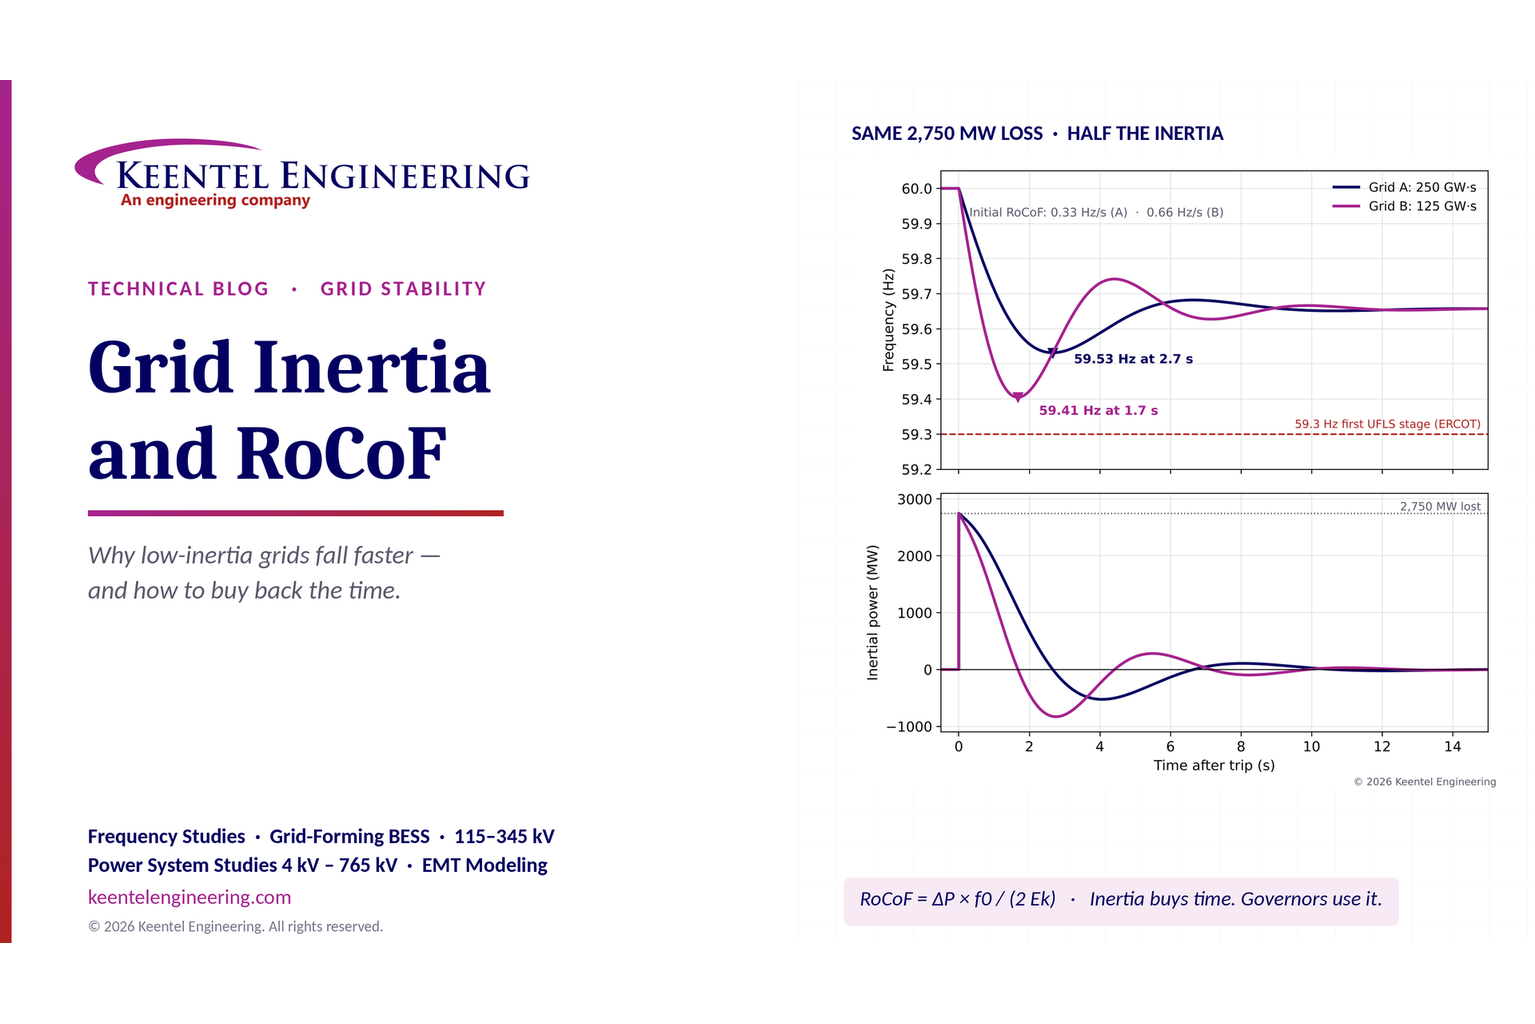
Explore grid inertia, RoCoF and frequency response, with swing equation calculations, frequency nadir analysis and US power system simulation examples.
By SANDIP R PATEL
•
October 11, 2026
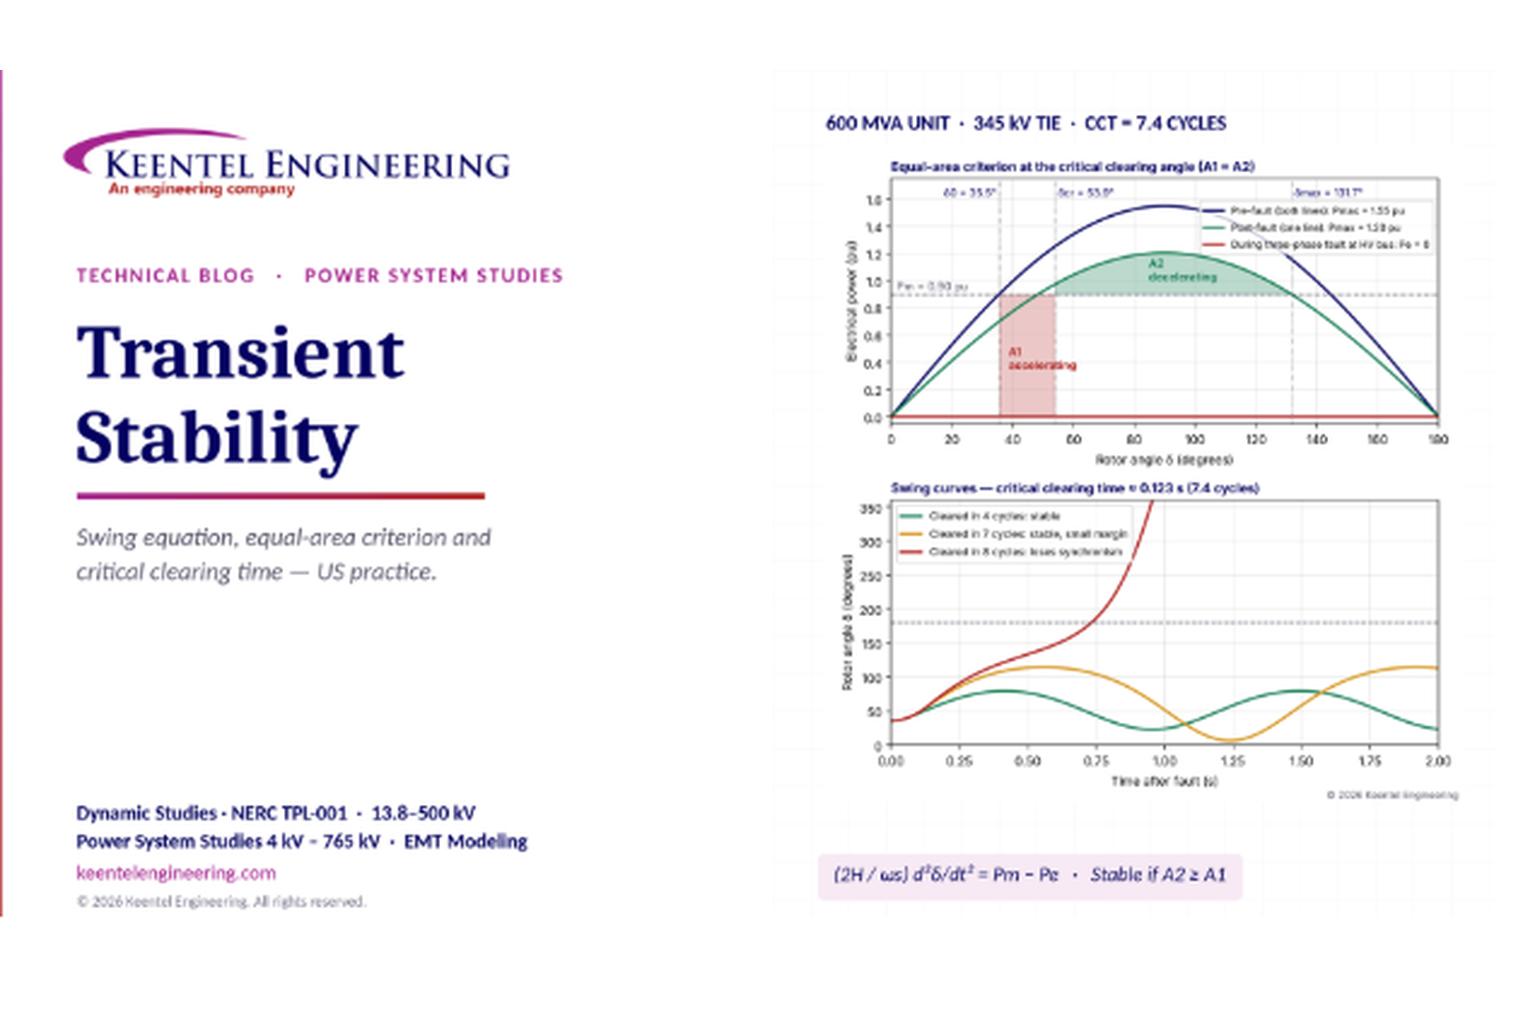
Learn transient stability analysis, swing equation, equal-area criterion and critical clearing time with a 345 kV worked example and NERC TPL-001 guidance.
By SANDIP R PATEL
•
October 11, 2026
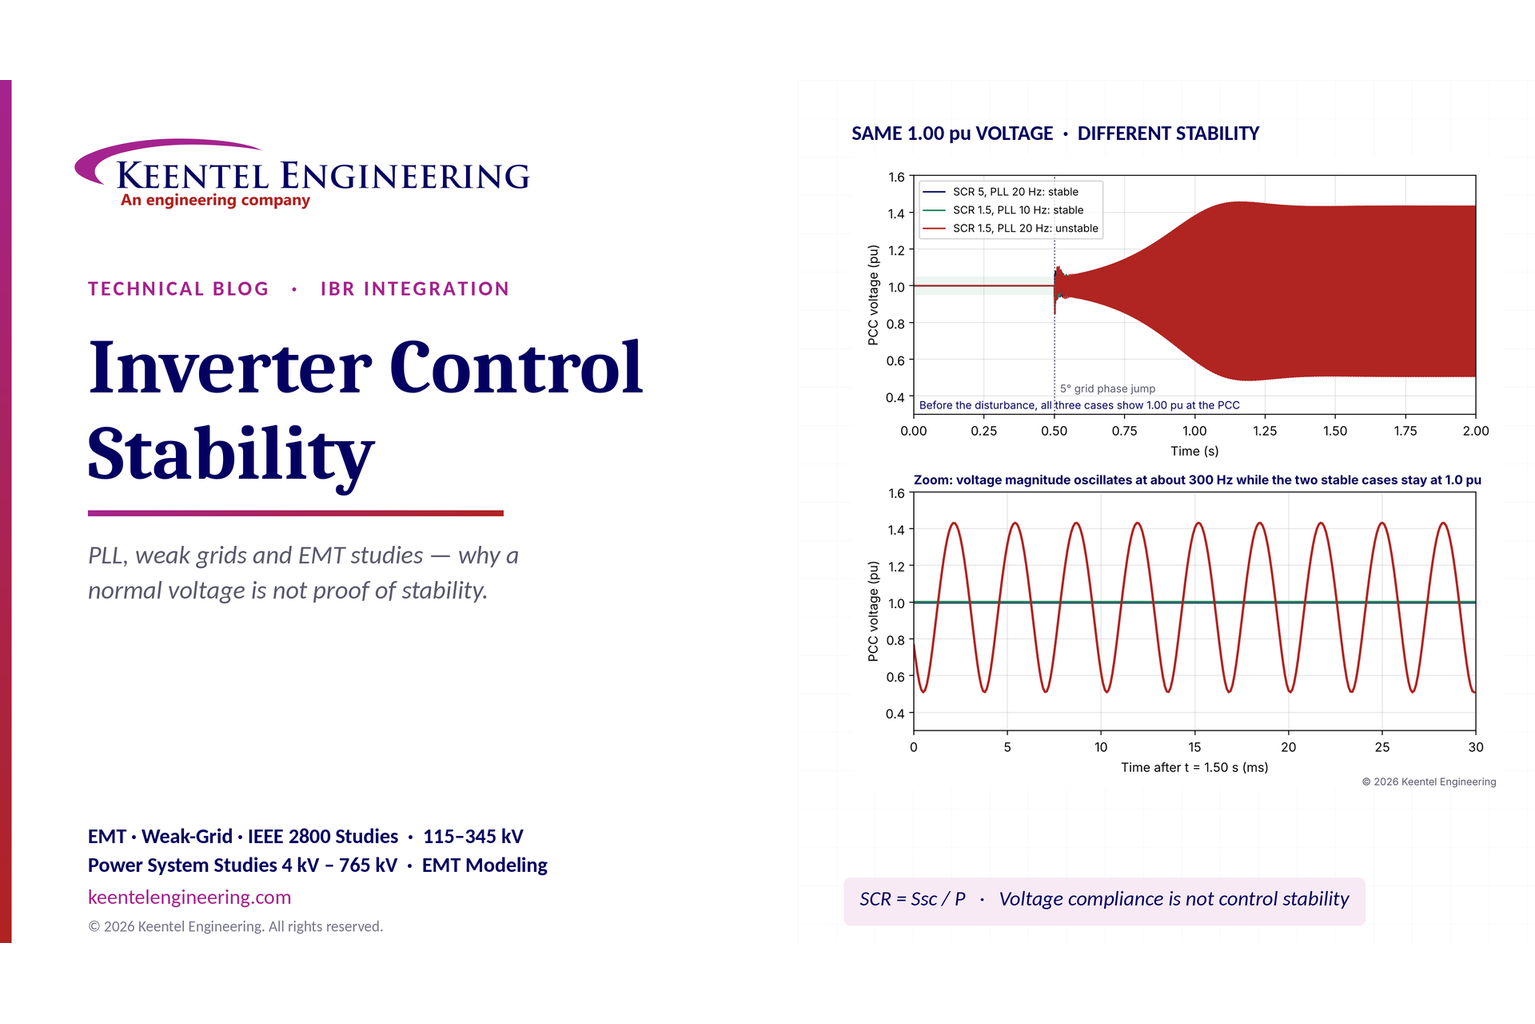
Learn why inverter controls become unstable in weak grids, how PLL bandwidth and SCR affect stability, and how PSCAD EMT studies identify and mitigate oscillations.
By SANDIP R PATEL
•
October 11, 2026
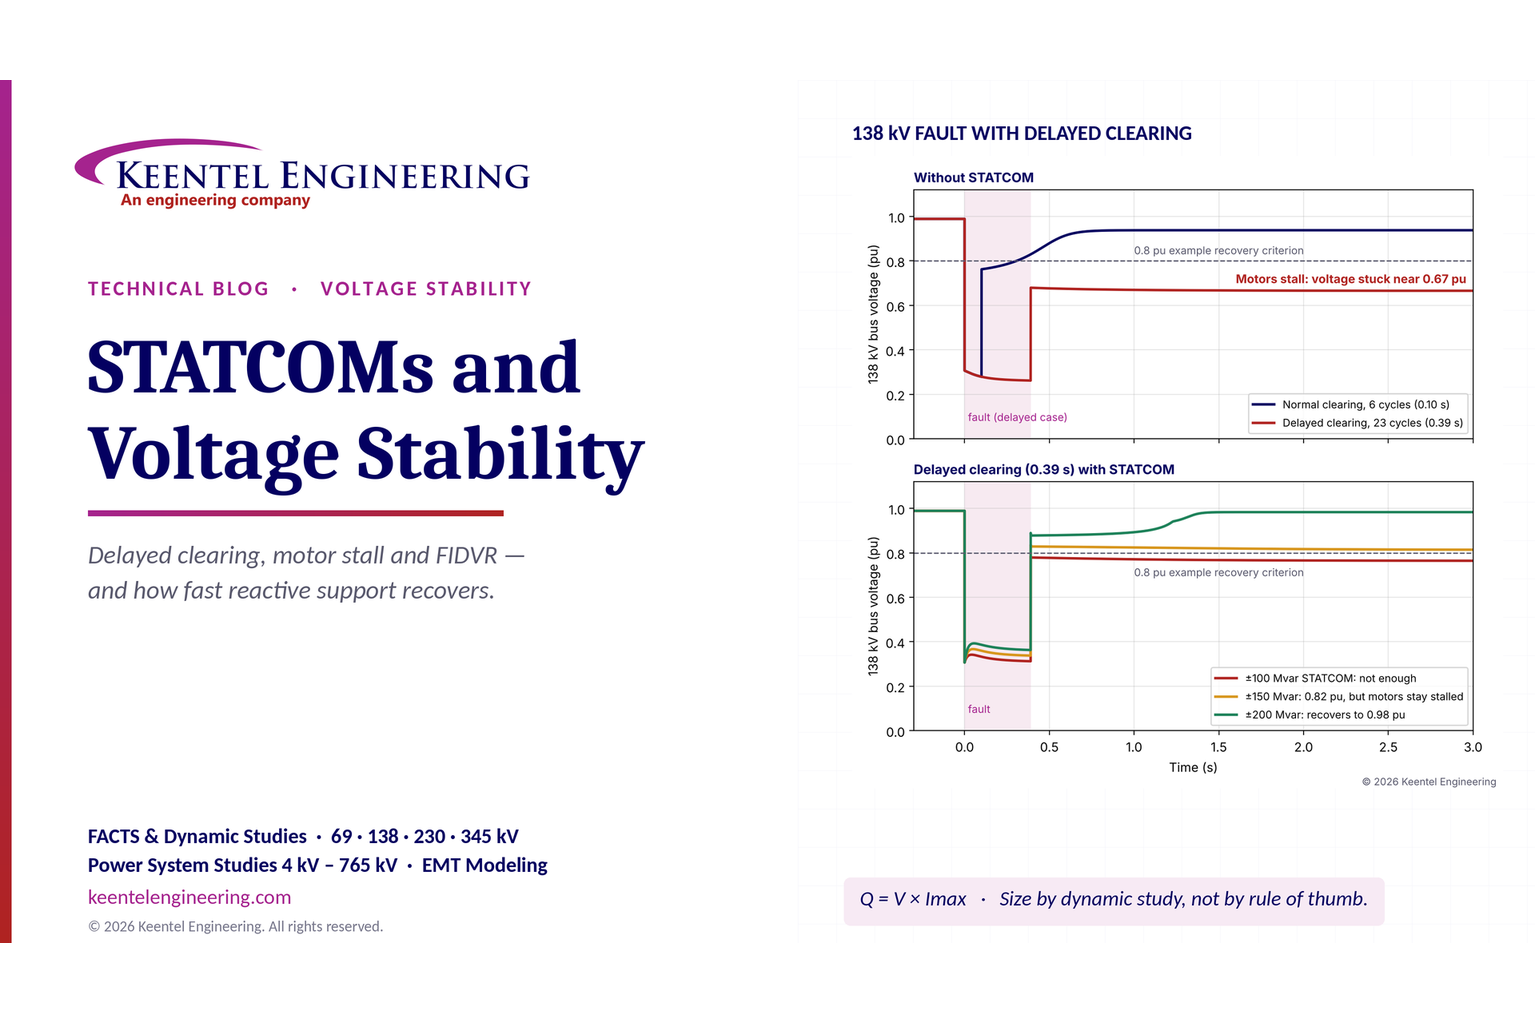
Learn how STATCOMs improve voltage stability and prevent FIDVR. Explore reactive power sizing, delayed fault clearing, NERC criteria and 138 kV simulation results.
By SANDIP R PATEL
•
October 10, 2026
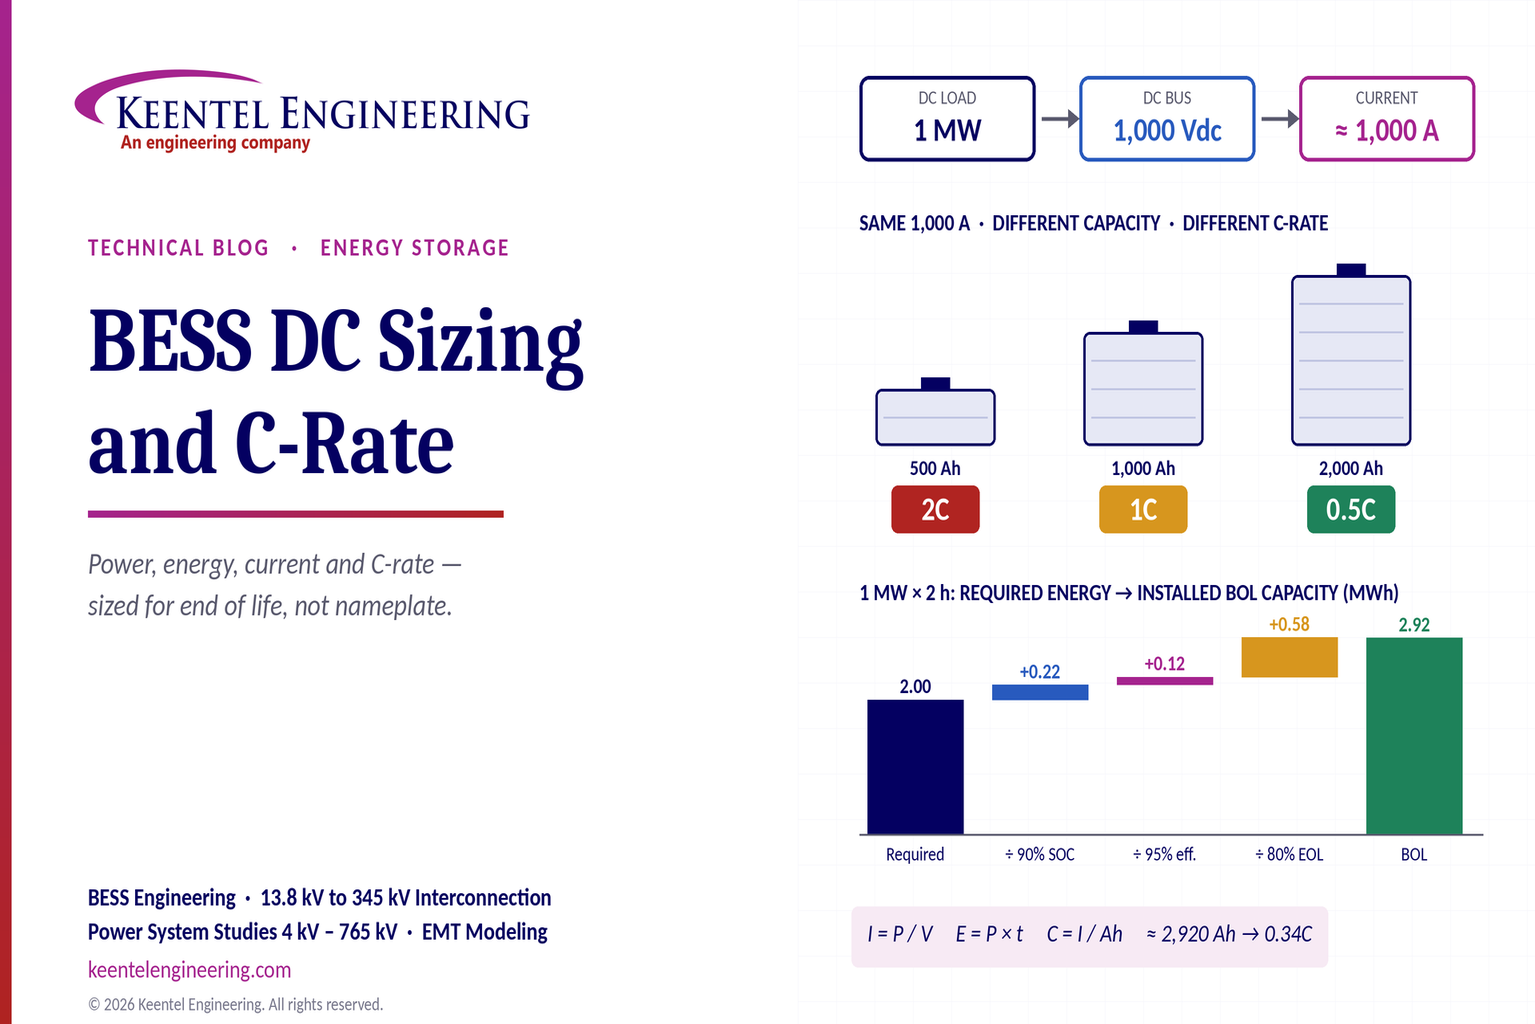
Learn BESS DC sizing with power, energy, current and C-rate calculations, battery losses, degradation and a 100 MW/400 MWh utility-scale example.
By SANDIP R PATEL
•
October 10, 2026
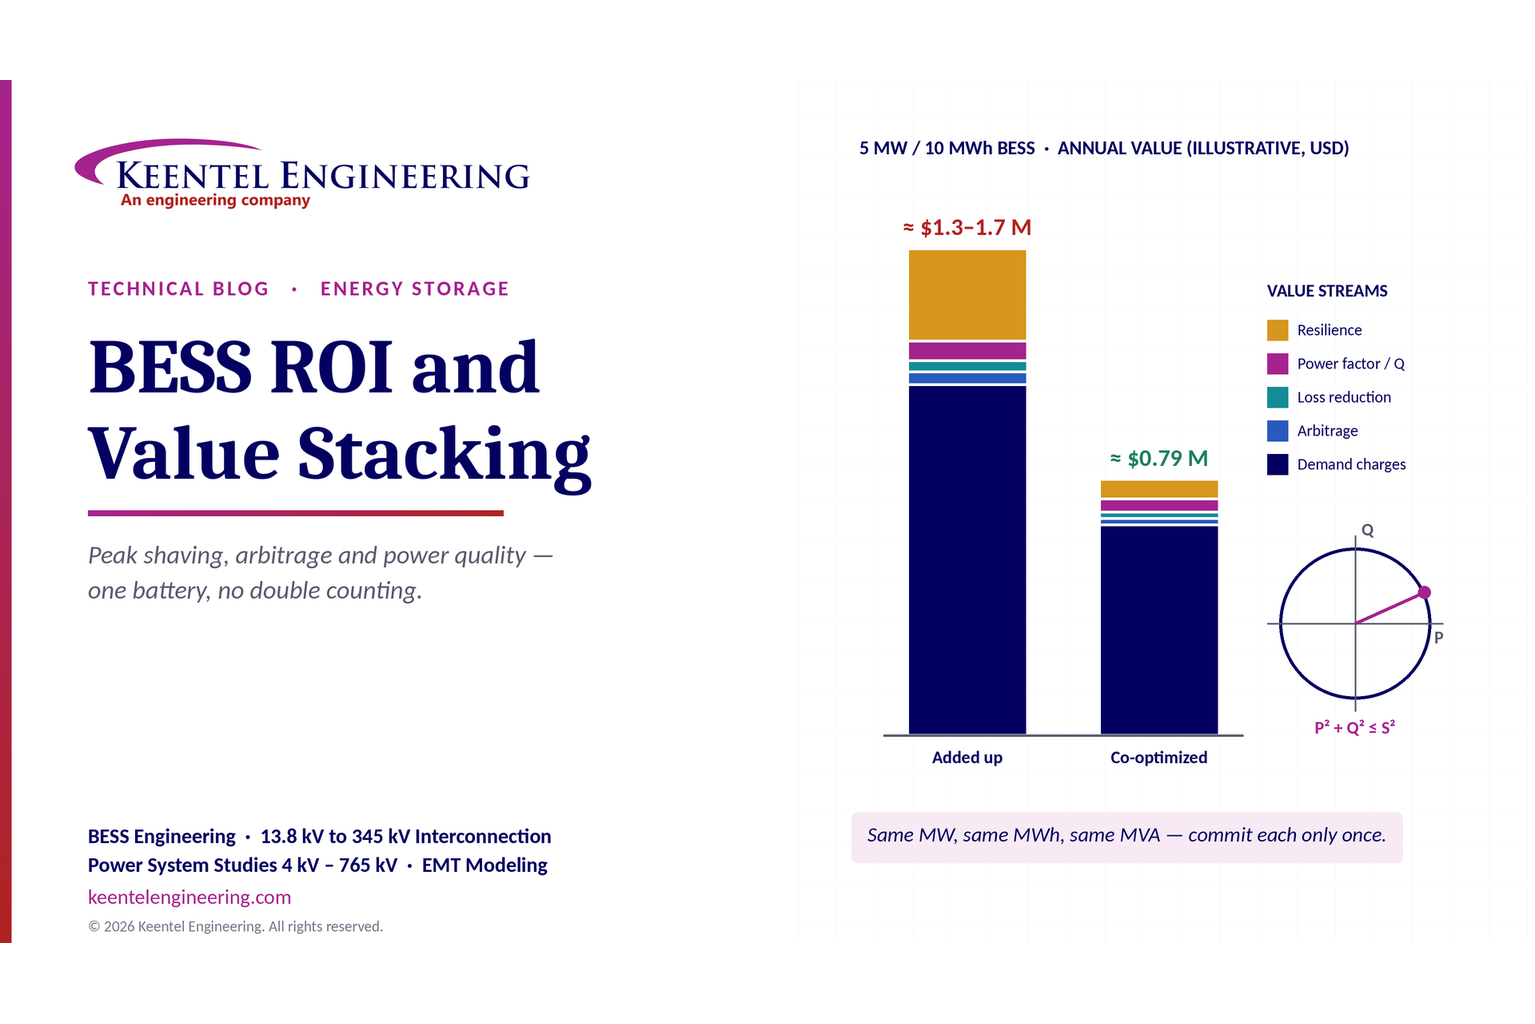
Learn how BESS ROI is calculated using peak shaving, energy arbitrage, power quality and battery storage economics, with a practical 5 MW/10 MWh example.
By SANDIP R PATEL
•
October 10, 2026
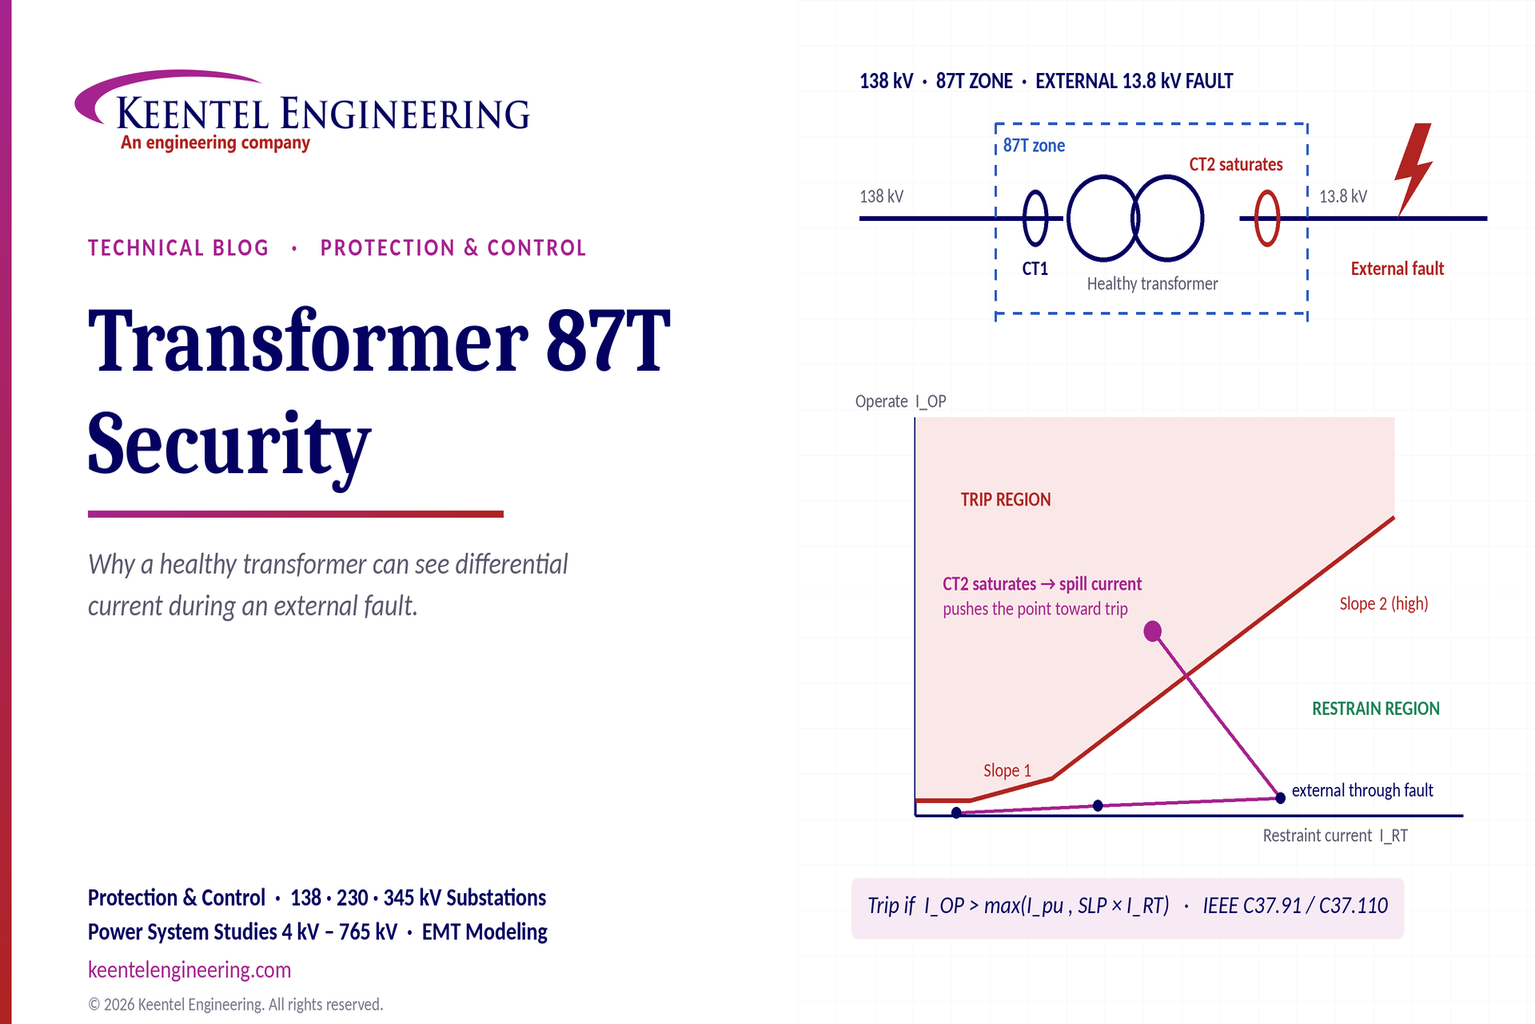
Learn why transformer differential relays detect current during external faults, how CT saturation causes spill current, and how secure 87T protection prevents trips.





