


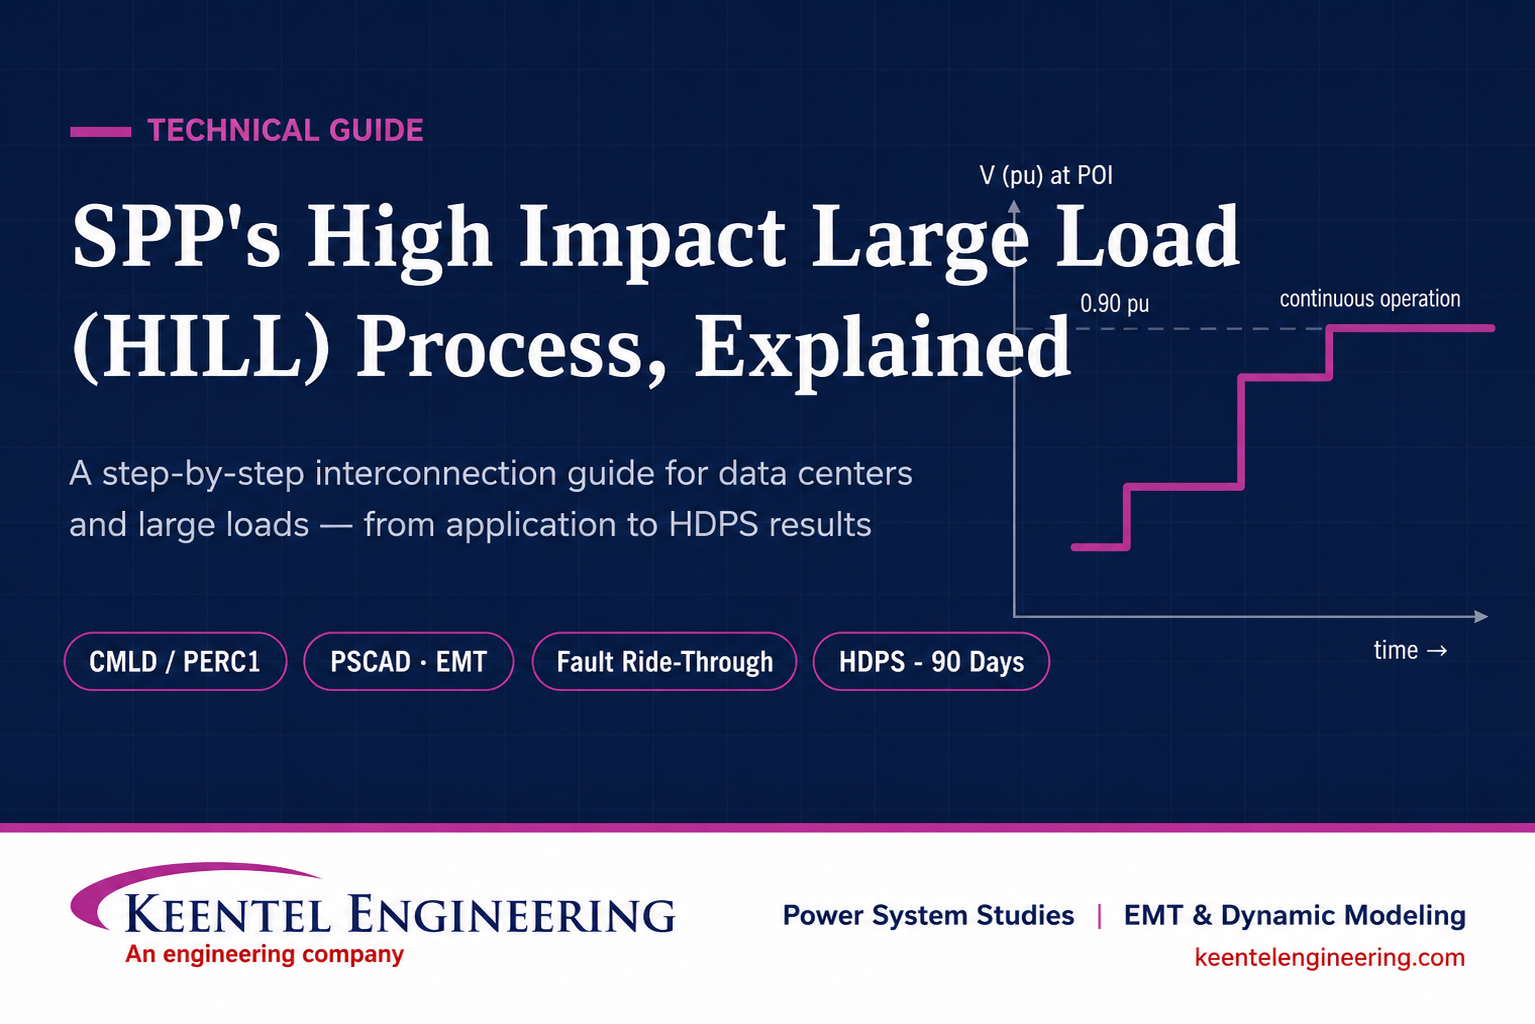
Learn the SPP HILL process, HDPS studies, PERC1, PSCAD, CMLD, fault ride-through, and large-load interconnection requirements for AI data centers.
Learn EHV GIS substation interlocking, one-and-a-half breaker schemes, SF₆ supervision, IEC 61850, SCADA logic, and GIS switching best practices.
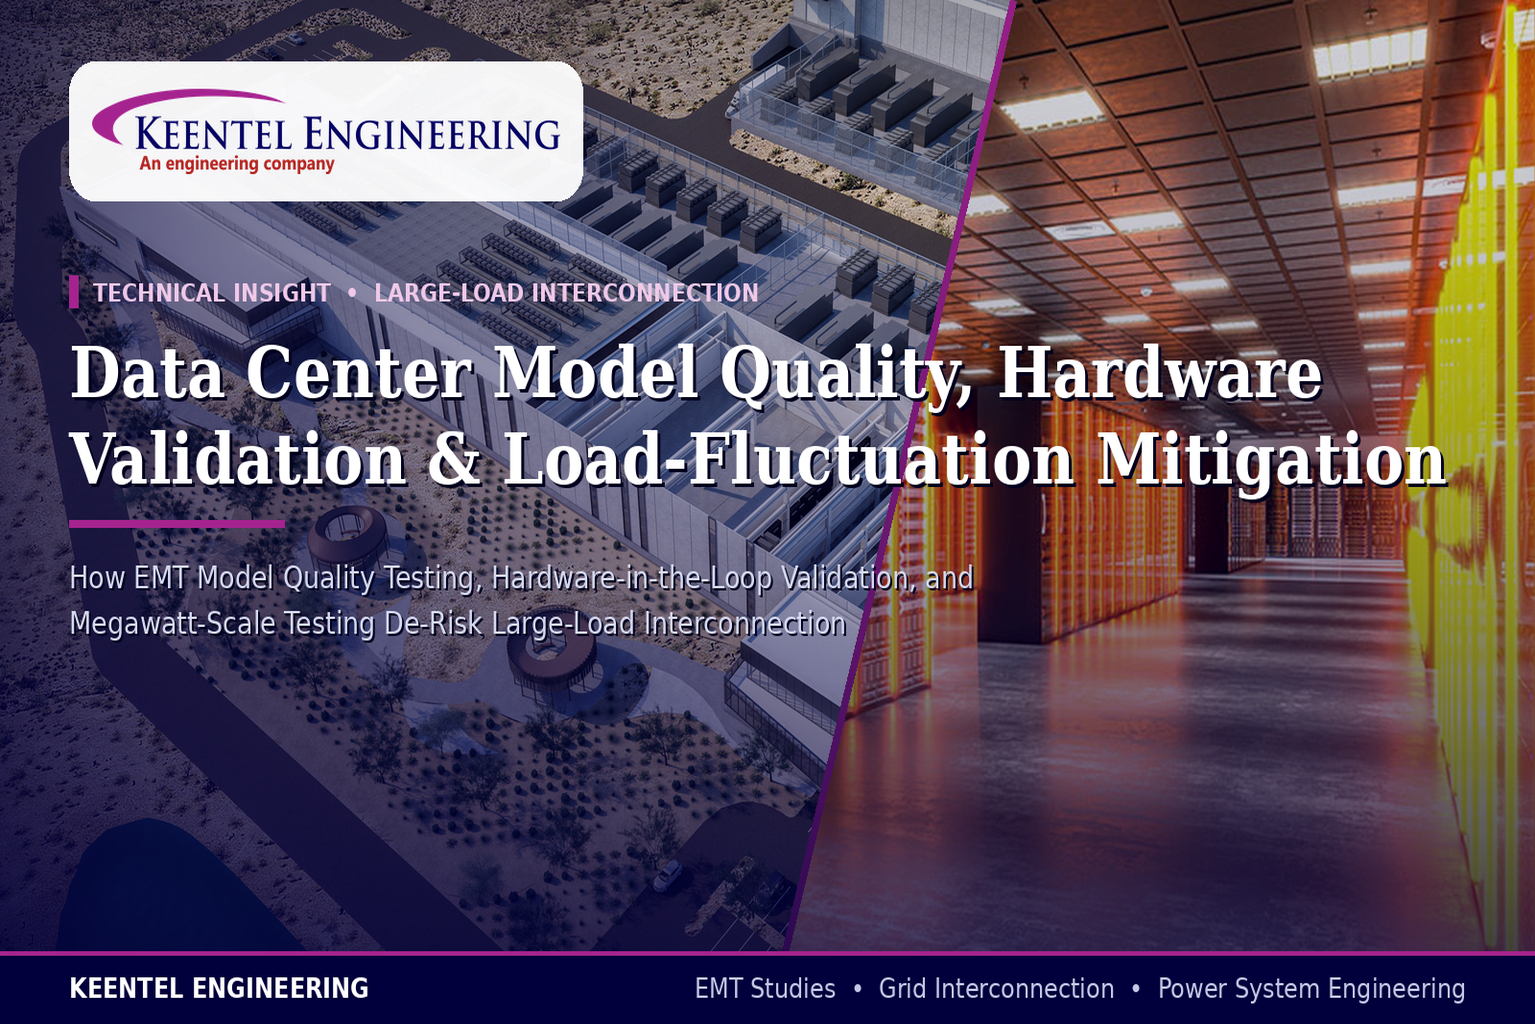
Learn how EMT modeling, hardware validation, PSCAD, PSS®E, and large-load interconnection studies help AI data centers achieve faster, lower-risk grid approval.
Learn how NERC's Large Loads Action Plan impacts AI data centers, grid interconnection, compliance, modeling, and power system reliability in 2026.
Discover how AI data centers are transforming power infrastructure, grid interconnection, EMT modeling, transmission planning, and utility engineering.

Learn how WinIGS improves utility-scale solar grounding analysis with GPR, touch and step voltage studies, IEEE 80 compliance, and real case studies.
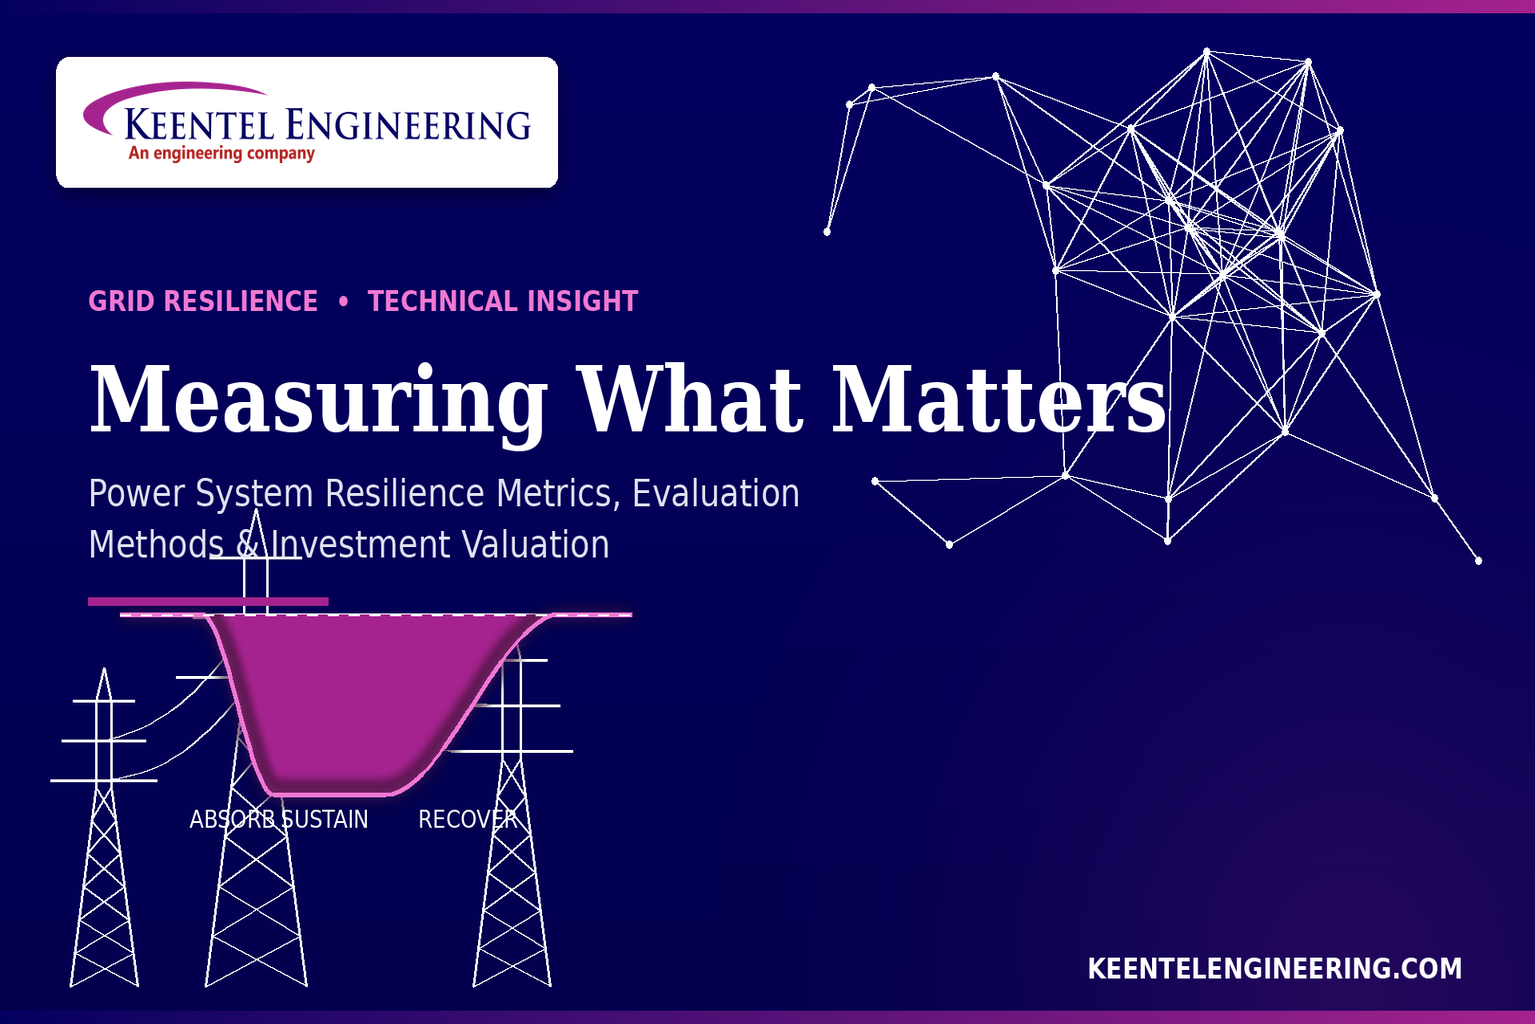
Learn power system resilience metrics, grid resilience evaluation, outage analysis, resilience valuation, and engineering methods for utilities and developers.
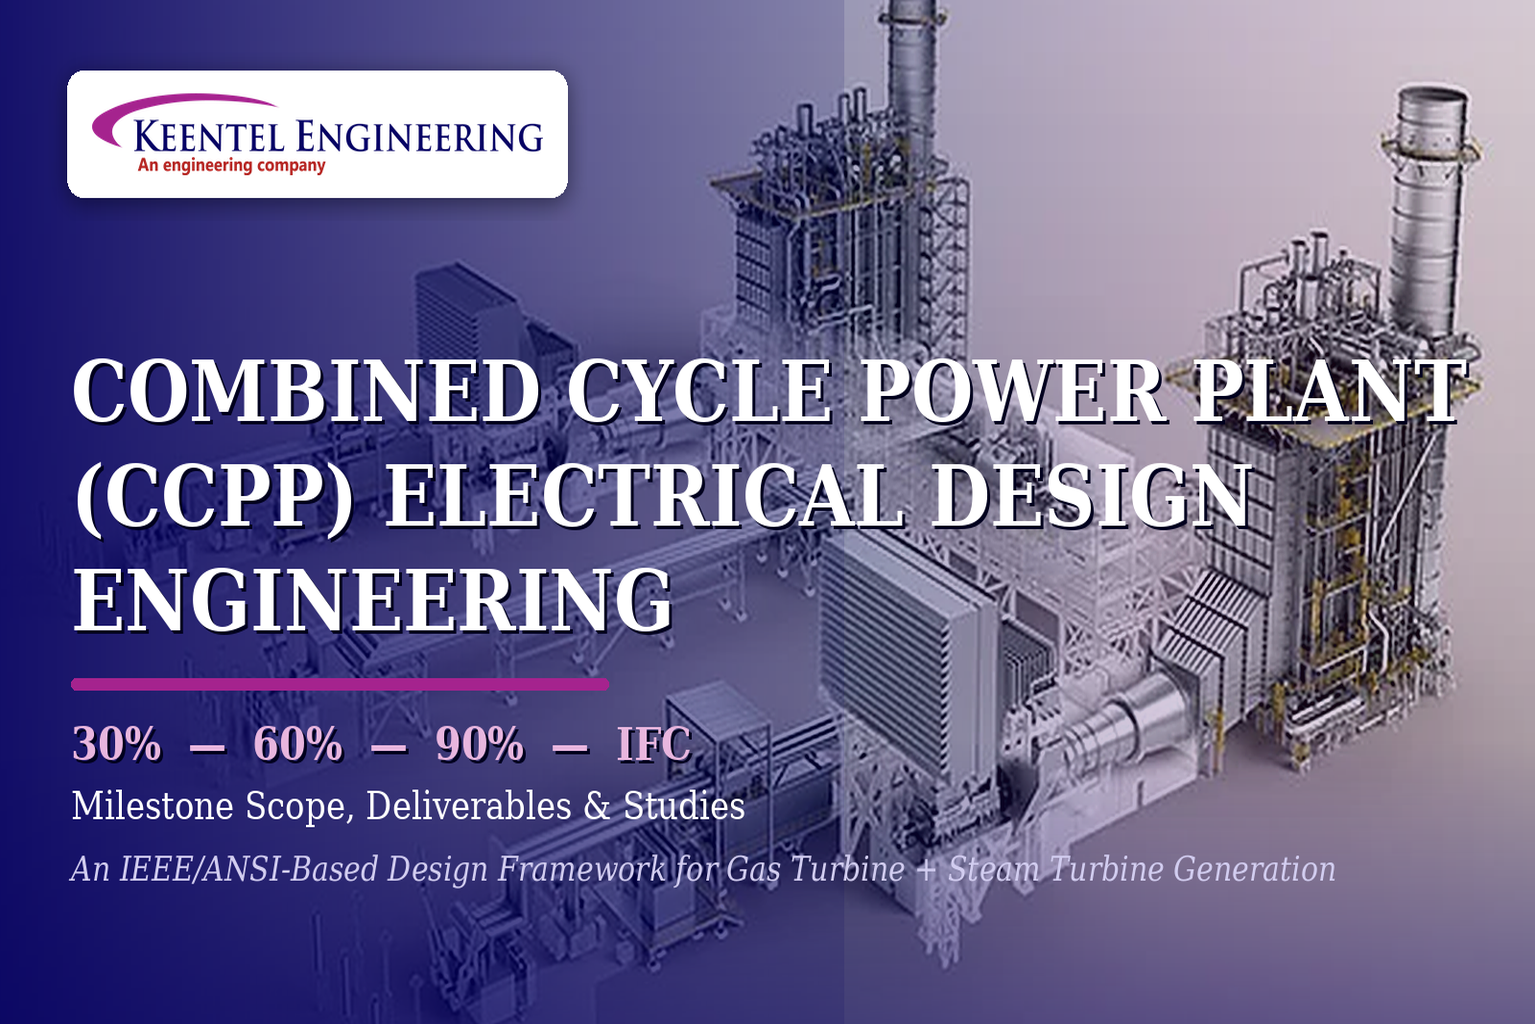
Learn the complete CCPP electrical design process, from 30% through IFC, including interconnection, power system studies, protection, grounding, and NERC compliance.
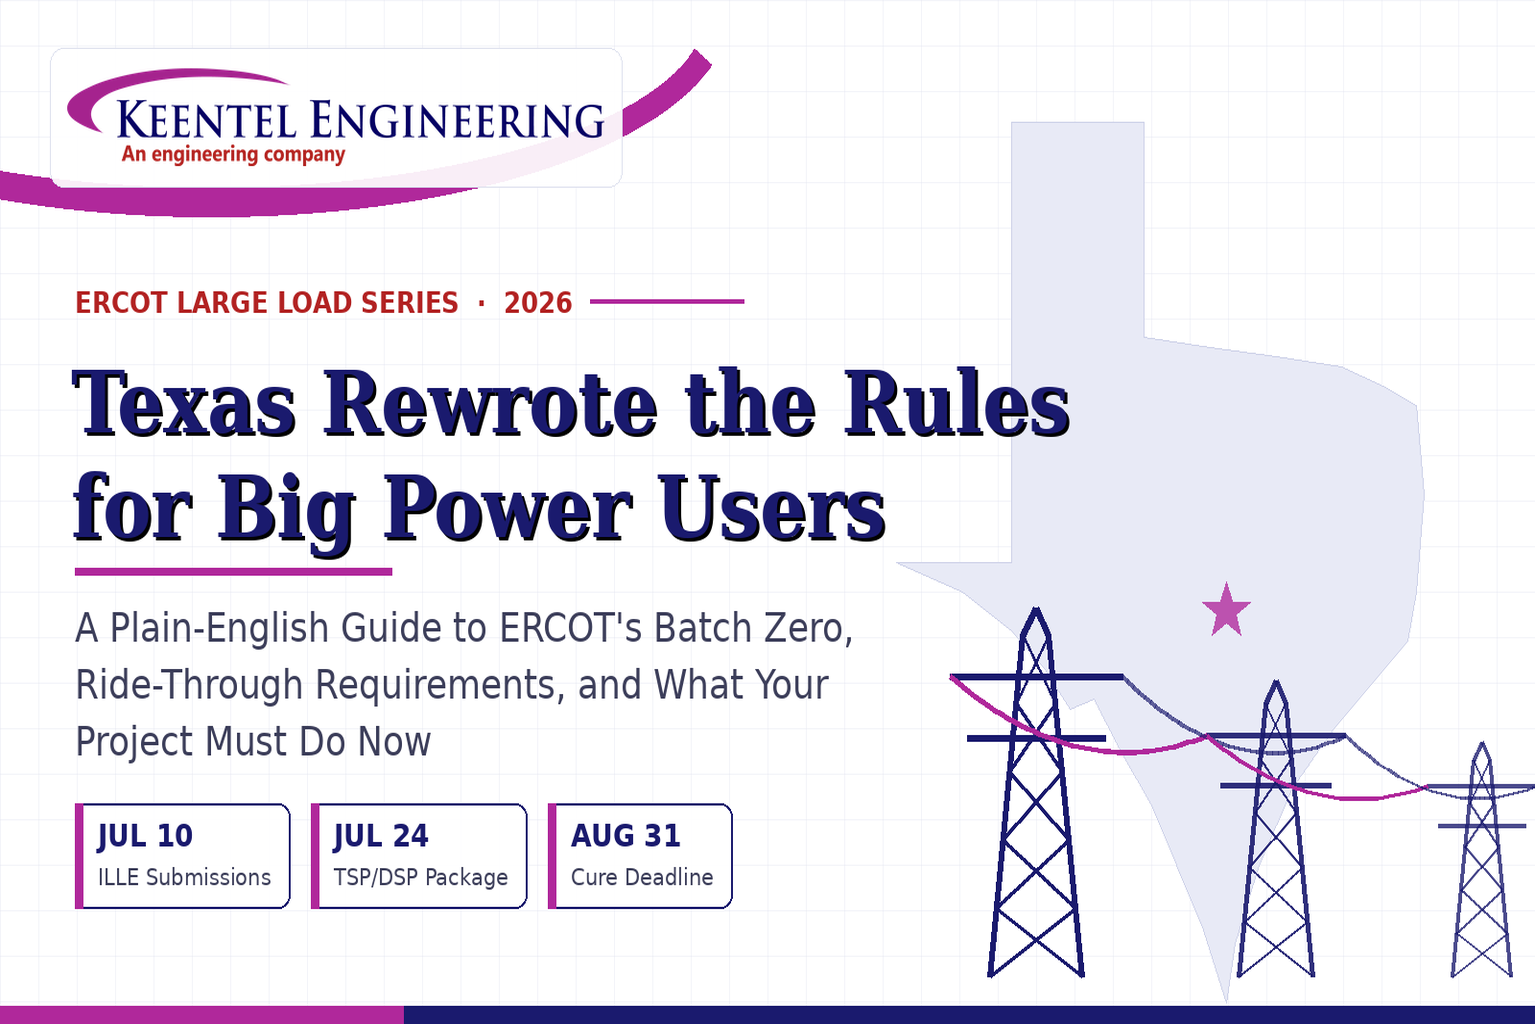
Learn ERCOT Batch Zero requirements, large load interconnection, ride-through standards, dynamic modeling, compliance timelines, and grid approvals.