
A Coordinated Electric System Interconnection Review—the utility’s deep-dive on technical and cost impacts of your project.
Challenge: Frequent false tripping using conventional electromechanical relays
Solution: SEL-487E integration with multi-terminal differential protection and dynamic inrush restraint
Result: 90% reduction in false trips, saving over $250,000 in downtime
ERCOT enforces all of the above through simulation, which means your model is your compliance case. The bar is now high:
- Whole-facility scope. The model must represent everything the IT load, the UPS and power conversion, the cooling plant, the protection and control systems in formats compatible with ERCOT's study platforms (PSS/E, PSCAD, TSAT).
- Real control loops, not approximations. Generic textbook representations are unacceptable. The model must capture the actual inner control behavior of your power electronics.
- Hardware-validated converter models. For electronic loads, the PSCAD model must be benchmarked against actual hardware testing including voltage ride-through and subsynchronous response. A model assembled from standard PSCAD library blocks fails by definition, because a generic block has never been tested against your vendor's hardware. The good news: validation is a hardware-type test, so results for a given converter product are reusable across every facility that uses it.
- Format migration. Facilities that previously submitted the older composite load model (CMLD) format must transition to EPRI's PERC1 format.
- Three checkpoints. Models are reviewed before the stability study begins (no model, no study), before each quarterly stability assessment, and for electronic loads one final time before energization, when you must submit as-built models with a documented comparison against the previously studied data and a sworn attestation that the model matches actual field settings. ERCOT's review takes 10 business days, extendable by 20 put it on your critical path.
- A living obligation. Change your technology, controls, or relay settings in a way that affects ride-through including converting a crypto mining site to an AI data center — and you've triggered a new interconnection study, even if your megawatts don't change.
| Parameter | Detail |
|---|---|
| System | 230 kV / 138 kV transmission corridors, wind and wet-snow icing exposure |
| Data basis | 15 years of minute-resolution forced-outage records + regional weather observations |
| Core methods | Event grouping, MVA performance curves, time-to-95%-restore, area outage rate curves, fragility modeling, rerun-history benefits, exceedance and log-domain risk metrics |
| Headline result | ≈85% of maximum resilience benefit at 60% of original capital; worst-event restoration window cut from 11 days to 5 in rerun-history terms |
| Decision supported | Capital portfolio selection; resilience plan filing; post-investment verification framework |
| System / Topic | Governing Standard(s) | What It Controls |
|---|---|---|
| Overall plant electrical distribution | IEEE 141 (Red Book); IEEE 666 | Distribution architecture, voltage selection, design of generating station auxiliary service systems |
| Power system studies | IEEE 399 (Brown Book); IEEE 551 | Load flow, symmetrical/asymmetrical short circuit, motor starting methodologies down to the lowest LV panelboard |
| Protection & coordination | IEEE 242 (Buff Book); IEEE 3004.5; IEEE C37 series | Generator relaying (21, 59N, 87G), time-current coordination, selective clearing between LV and MV tiers |
| GSU / UAT / SST transformers | IEEE C57.12.00 and C57 family | Transformer ratings, impedance, testing, loading |
| HV switchyard breakers | IEEE C37.06 | AC high-voltage circuit breaker preferred ratings |
| MV switchgear (13.8 kV) | IEEE C37.20.2; IEEE C37.20.7 | Metal-clad construction, compartmentalization, vacuum breakers; arc-resistant design with plenum venting |
| MV cable | UL 1072; ICEA S-93-639 (NEMA WC 74) | Type MV-105 shielded cable, 133% insulation level for HRG systems |
| LV switchgear (480 V) | IEEE C37.13; UL 1558 | Metal-enclosed LV power circuit breaker switchgear to 635 V, draw-out ACBs with electronic trip units |
| Motor control centers | UL 845; NEMA ICS 18 | LV-MCC construction, MCCB/MCP protection for motors under ~200 HP |
| Motors | NEMA MG-1 | Motor performance, starting characteristics, service factors |
| DC & battery systems | IEEE 485; IEEE 946 | Lead-acid battery sizing (125/250 VDC), DC auxiliary system design |
| Grounding | IEEE 80; IEEE 142 (Green Book) | Ground grid step/touch potential limits; system grounding including high-resistance grounding |
| Lightning protection | IEEE 998 | Direct-stroke shielding of switchyard and outdoor generator structures |
| Arc flash & electrical safety | IEEE 1584; NFPA 70E | Incident energy calculation; worker safety boundaries and PPE |
| Fire protection | NFPA 850 | Fire protection and risk management for combustion turbine generating plants |
| Installation code | NEC (NFPA 70); NESC | Wiring methods inside the plant fence; overhead/outdoor clearances at the switchyard |
| Interconnection & compliance | FERC LGIP; NERC MOD-025/026/027, PRC-019/024/029, FAC-008 | Interconnection process, model validation, protection/ride-through coordination, facility ratings |
| IFC / Construction Deliverable | Purpose |
|---|---|
| Stamped IFC packages | Legal basis for construction; P.E. responsible charge |
| Final relay settings & TCCs | Protection as-installed matches the coordination study |
| Calculation archive | Owner records; NERC audit evidence trail |
| Commissioning procedures | Safe, sequenced energization; MOD field testing |
| Construction support | RFIs, field changes, FAT/SAT witness |
| As-builts & model handoff | Operating baseline; future study currency |
| Metric | Outcome |
|---|---|
| Defects found pre-occupancy | Three topology defects and one settings-mismatch family corrected before load migration; the shared-switchboard defect alone would have invalidated the concurrently-maintainable claim on day one |
| IST findings | Fourteen additional discrepancies surfaced under scenario testing (control logic, alarm mapping, one generator sequencing fault) — all closed before handover instead of during operations |
| Black-building test | Passed on second execution; the first attempt exposed the generator sequencing fault under true block load, exactly the failure the compressed plan would never have found |
| Handover quality | Operations team certified on the actual failure scenarios; corrected EOPs and settings documentation delivered as controlled documents |
| Business outcome | Occupancy proceeded three weeks behind the original date — against an independent estimate that the uncorrected sequencing fault carried a high probability of a full facility outage within the first year |
Part 2 — Frequently Asked Questions: Large Load Interconnection
| Contact | Details |
|---|---|
| Headquarters | 400 N Ashley Dr STE 2600, Tampa, FL 33602 |
| Phone | (813) 389-7871 |
| contact@keentelengineering.com | |
| Florida Firm Registration | No. 36853 |
| Additional Offices | Austin, TX • Sacramento, CA • Baltimore, MD |
| Who | Acronym | Plain-English Role |
|---|---|---|
| ERCOT | — | The grid's air traffic controller. It doesn't own power lines or plants; it directs the flow of electricity across most of Texas and referees the admission process for new generators. |
| Interconnecting Entity | IE | You — the developer or owner trying to connect a new plant (or significantly modify an existing one). You file the application and drive the process. |
| Resource Entity | RE | The registered owner/operator of the generator once it becomes an official market participant. Often the same company as the IE, wearing a different hat. |
| Qualified Scheduling Entity | QSE | Your plant's voice on the grid. The QSE handles round-the-clock communications with ERCOT — telemetry, schedules, dispatch instructions. Every generator must have one. |
| Transmission Service Provider | TSP | The utility that owns the wires and substation you'll connect to. The TSP runs your detailed study, builds the connection facilities, and signs your interconnection contract. |
| RIOO-IS | — | ERCOT's online portal where the whole process lives — applications, documents, status tracking, and checklists all flow through it. |
| Who | Acronym | Plain-English Role |
|---|---|---|
| ERCOT | — | The grid's air traffic controller. It doesn't own power lines or plants; it directs the flow of electricity across most of Texas and referees the admission process for new generators. |
| Interconnecting Entity | IE | You — the developer or owner trying to connect a new plant (or significantly modify an existing one). You file the application and drive the process. |
| Resource Entity | RE | The registered owner/operator of the generator once it becomes an official market participant. Often the same company as the IE, wearing a different hat. |
| Qualified Scheduling Entity | QSE | Your plant's voice on the grid. The QSE handles round-the-clock communications with ERCOT — telemetry, schedules, dispatch instructions. Every generator must have one. |
| Transmission Service Provider | TSP | The utility that owns the wires and substation you'll connect to. The TSP runs your detailed study, builds the connection facilities, and signs your interconnection contract. |
| RIOO-IS | — | ERCOT's online portal where the whole process lives — applications, documents, status tracking, and checklists all flow through it. |
| Who | Acronym | Plain-English Role |
|---|---|---|
| ERCOT | — | The grid's air traffic controller. It doesn't own power lines or plants; it directs the flow of electricity across most of Texas and referees the admission process for new generators. |
| Interconnecting Entity | IE | You — the developer or owner trying to connect a new plant (or significantly modify an existing one). You file the application and drive the process. |
| Resource Entity | RE | The registered owner/operator of the generator once it becomes an official market participant. Often the same company as the IE, wearing a different hat. |
| Qualified Scheduling Entity | QSE | Your plant's voice on the grid. The QSE handles round-the-clock communications with ERCOT — telemetry, schedules, dispatch instructions. Every generator must have one. |
| Transmission Service Provider | TSP | The utility that owns the wires and substation you'll connect to. The TSP runs your detailed study, builds the connection facilities, and signs your interconnection contract. |
| RIOO-IS | — | ERCOT's online portal where the whole process lives — applications, documents, status tracking, and checklists all flow through it. |
| Who | Acronym | Plain-English Role |
|---|---|---|
| ERCOT | — | The grid's air traffic controller. It doesn't own power lines or plants; it directs the flow of electricity across most of Texas and referees the admission process for new generators. |
| Interconnecting Entity | IE | You — the developer or owner trying to connect a new plant (or significantly modify an existing one). You file the application and drive the process. |
| Resource Entity | RE | The registered owner/operator of the generator once it becomes an official market participant. Often the same company as the IE, wearing a different hat. |
| Qualified Scheduling Entity | QSE | Your plant's voice on the grid. The QSE handles round-the-clock communications with ERCOT — telemetry, schedules, dispatch instructions. Every generator must have one. |
| Transmission Service Provider | TSP | The utility that owns the wires and substation you'll connect to. The TSP runs your detailed study, builds the connection facilities, and signs your interconnection contract. |
| RIOO-IS | — | ERCOT's online portal where the whole process lives — applications, documents, status tracking, and checklists all flow through it. |
| Who | Acronym | Plain-English Role |
|---|---|---|
| ERCOT | — | The grid's air traffic controller. It doesn't own power lines or plants; it directs the flow of electricity across most of Texas and referees the admission process for new generators. |
| Interconnecting Entity | IE | You — the developer or owner trying to connect a new plant (or significantly modify an existing one). You file the application and drive the process. |
| Resource Entity | RE | The registered owner/operator of the generator once it becomes an official market participant. Often the same company as the IE, wearing a different hat. |
| Qualified Scheduling Entity | QSE | Your plant's voice on the grid. The QSE handles round-the-clock communications with ERCOT — telemetry, schedules, dispatch instructions. Every generator must have one. |
| Transmission Service Provider | TSP | The utility that owns the wires and substation you'll connect to. The TSP runs your detailed study, builds the connection facilities, and signs your interconnection contract. |
| RIOO-IS | — | ERCOT's online portal where the whole process lives — applications, documents, status tracking, and checklists all flow through it. |
| Who | Acronym | Plain-English Role |
|---|---|---|
| ERCOT | — | The grid's air traffic controller. It doesn't own power lines or plants; it directs the flow of electricity across most of Texas and referees the admission process for new generators. |
| Interconnecting Entity | IE | You — the developer or owner trying to connect a new plant (or significantly modify an existing one). You file the application and drive the process. |
| Resource Entity | RE | The registered owner/operator of the generator once it becomes an official market participant. Often the same company as the IE, wearing a different hat. |
| Qualified Scheduling Entity | QSE | Your plant's voice on the grid. The QSE handles round-the-clock communications with ERCOT — telemetry, schedules, dispatch instructions. Every generator must have one. |
| Transmission Service Provider | TSP | The utility that owns the wires and substation you'll connect to. The TSP runs your detailed study, builds the connection facilities, and signs your interconnection contract. |
| RIOO-IS | — | ERCOT's online portal where the whole process lives — applications, documents, status tracking, and checklists all flow through it. |
| Who | Acronym | Plain-English Role |
|---|---|---|
| ERCOT | — | The grid's air traffic controller. It doesn't own power lines or plants; it directs the flow of electricity across most of Texas and referees the admission process for new generators. |
| Interconnecting Entity | IE | You — the developer or owner trying to connect a new plant (or significantly modify an existing one). You file the application and drive the process. |
| Resource Entity | RE | The registered owner/operator of the generator once it becomes an official market participant. Often the same company as the IE, wearing a different hat. |
| Qualified Scheduling Entity | QSE | Your plant's voice on the grid. The QSE handles round-the-clock communications with ERCOT — telemetry, schedules, dispatch instructions. Every generator must have one. |
| Transmission Service Provider | TSP | The utility that owns the wires and substation you'll connect to. The TSP runs your detailed study, builds the connection facilities, and signs your interconnection contract. |
| RIOO-IS | — | ERCOT's online portal where the whole process lives — applications, documents, status tracking, and checklists all flow through it. |
Protection Design
Solar Plant Performance & Field Testing
Aug 10, 2026 | Blog
How owners, developers, and independent engineers verify that a solar plant delivers what was promised — from the 7-day ASTM E2848/E2939 capacity test to the one-year IEC 61724-1 performance ratio test, and every sensor and data point that makes those results defensible.
The short version
A performance test is how you convert a construction milestone into a financial fact. Before final payment is released, a warranty clock starts, or a plant changes hands, the owner and the independent engineer need proof that the array actually produces the power the contract promised. For utility-scale PV, that proof rests on two complementary tests: a short, intensive capacity test (ASTM E2848 and E2939, typically run over about seven clear days) that answers “does the plant hit its rated power right now, under measured conditions?”, and a one-year performance ratio (PR) test (IEC 61724-1) that answers “does the plant sustain its efficiency across a full cycle of seasons, temperatures, and soiling?” Both stand or fall on instrumentation: calibrated pyranometers, an albedometer, a soiling station, temperature and wind sensors, a rain gauge, and revenue-grade energy metering. This guide explains each standard, each test, and each instrument and data point in depth for utility-scale photovoltaic plants, including bifacial designs.New Paragraph
Why Field Performance Testing Is the Moment That Matters
A solar project spends years in development and months in construction, but its entire financial premise comes down to one question: will it generate the energy the model predicted? Performance testing at mechanical completion is where that question gets answered with measured data rather than assumptions. The results drive substantial completion and final payment to the EPC, trigger production guarantees and liquidated damages, establish the baseline for long-term operations, and satisfy the lenders' independent engineer (IE) that the asset is bankable.
Getting testing right protects every party. For the owner, it confirms the revenue basis of the investment and prevents a chronically underperforming plant from being accepted. For the EPC, a rigorous, standards-based test provides a fair and defensible way to demonstrate that the work meets contract — and to be paid promptly when it does. For the IE and lenders, it de-risks the debt. When testing is done poorly — with uncalibrated sensors, weak data filtering, or the wrong standard applied — disputes follow, and they are expensive.
This guide walks through a complete, modern testing scope exactly as it appears in real solicitations — a seven-day capacity test and a one-year PR test, backed by a full weather and metering sensor suite. Each standard, each test, and every instrument and data point is explained in depth below.
A typical utility-scale testing scope
Capacity test: ASTM E2848 + ASTM E2939, 7 consecutive days. Performance ratio test: IEC 61724-1, one year. For a bifacial plant, the scope adds rear-POA pyranometers and an albedometer, and in hot, dust-prone climates the back-of-module, soiling, and rainfall measurements become especially consequential — as explained throughout.
The Two Pillars: Capacity Test vs. Performance Ratio Test
Owners frequently conflate these two tests, but they answer different questions and are governed by different standards. The
capacity test is a snapshot — a short, statistically rigorous measurement that normalizes production to a fixed set of “reporting conditions” and asks whether the plant delivers its expected power at that instant in its life. The PR test is a movie — a long-duration measurement of how efficiently the plant converts available sunlight into delivered energy across an entire year of real weather.
| Attribute | Capacity Test | Performance Ratio (PR) Test |
|---|---|---|
| Question answered | Does the plant reach expected power now, at fixed reference conditions? | Does the plant sustain expected efficiency across a full year? |
| Governing standard | ASTM E2848 (test method) + ASTM E2939 (reporting conditions & expected capacity) | IEC 61724-1 (PV system performance monitoring) |
| Duration | ~7 consecutive (clear) days | 12 months (one full seasonal cycle) |
| Core method | Multivariate regression of power vs. irradiance, temperature, wind | Ratio of actual yield to reference yield (PR), often temperature-corrected |
| Primary use | Substantial completion, EPC final payment, acceptance | Long-term production guarantee, O&M baseline, lender assurance |
| Key output | Measured-to-expected capacity ratio (e.g., ≥ 95%) | Performance ratio (%), typically with a contractual PR guarantee |
A well-structured project uses both. The capacity test clears the path to final payment quickly after construction; the PR test confirms, over the following year, that the plant's efficiency holds up in service. Crucially, both tests share the same instrumentation backbone — which is why the two instrument lists in the scope are identical, and why investing in a single, properly designed on-site weather and metering system serves both purposes.
The Capacity Test: ASTM E2848 and ASTM E2939
The capacity test is the industry-standard way to verify a PV plant's power output at commissioning. It is built from two complementary ASTM documents that are almost always cited together: E2848 defines the measurement and regression method, while E2939 defines the reporting conditions and the expected capacity that the measurement is compared against.
ASTM E2848 the test method
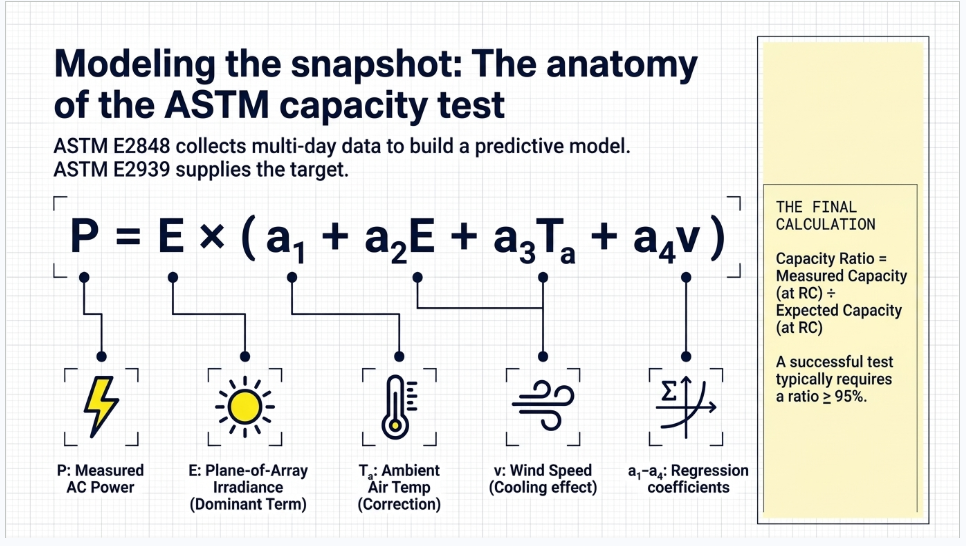
ASTM E2848, Standard Test Method for Reporting Photovoltaic Non-Concentrator System Performance (current edition E2848-13(2018)), establishes how to measure a system's AC power output and relate it to the environmental conditions that drive it. Rather than trying to catch the plant at one perfect instant, E2848 collects many short-interval measurements over several days and fits a multivariate regression model that describes power as a function of the weather.
The regression takes the general form:
P = E × ( a₁ + a₂E + a₃Tₐ + a₄v )
where P is the measured AC power, E is the plane-of-array (POA) irradiance, Tₐ is ambient air temperature, v is wind speed, and a₁–a₄ are coefficients found by least-squares fitting to the measured data. The dominant term is irradiance; temperature and wind are second-order corrections that capture how the array warms and cools. Once the coefficients are known, the model can predict the plant's power at any specified set of conditions — which is exactly what makes a fair comparison possible.
Data filtering and quality control
The credibility of the regression depends on excluding data that would distort it. Common, standards-aligned filtering criteria applied during an E2848 test include:
- Irradiance floor: data points below roughly 400 W/m² are excluded, because low-light behavior is non-linear and noisy.
- Stability windows: intervals with rapidly changing irradiance (passing clouds) are removed so that measured power and measured irradiance correspond to the same moment.
- Reporting-condition band: for the final capacity determination, points are typically drawn from within about ±20% of the reporting irradiance so the result reflects representative operating conditions.
- Minimum sample size: a sufficient number of valid intervals (for example, on the order of 50 fifteen-minute points) is required for the regression to be statistically sound.
- Availability accounting: periods when equipment is offline for reasons unrelated to the plant's capability (e.g., grid curtailment) are handled explicitly so the plant is judged on what it can do, not on external constraints.
This is why the scope specifies seven consecutive days: it is usually enough time to accumulate the required volume of clean, high-irradiance, stable data — but if weather is poor, the window may need to extend until the data quality thresholds are met. A capacity test is finished when the data are good enough, not merely when the calendar runs out.
ASTM E2939 reporting conditions and expected capacity
A measured number means nothing without something to compare it to. ASTM E2939, Standard Practice for Determining Reporting Conditions and Expected Capacity for Photovoltaic Non-Concentrator Systems (current edition E2939-13(2018)), supplies that reference. It defines the Reporting Conditions (RC) — a single representative set of irradiance, ambient temperature, and wind speed derived from the site's typical operating profile — and the Expected Capacity, which is the power the plant is predicted to produce at those exact conditions based on the design model.
The reporting conditions are not arbitrary: they are chosen to represent the conditions under which the plant most often operates while producing meaningful power, so that the capacity result is representative rather than cherry-picked from a single ideal moment. The test then compares the two numbers directly:
Capacity Ratio = Measured Capacity (at RC) ÷ Expected Capacity (at RC)
Both the measured and the expected values are evaluated at the same reporting conditions using each side's regression/model, which removes weather as a variable and isolates the plant's true capability. Acceptance is defined by contract, but a capacity ratio of 95% or greater — with regression errors held to within a few percent — is a widely used threshold. Fall short and liquidated damages or corrective work may be triggered; meet it and the plant clears a major commercial hurdle.
Why E2848 and E2939 are always cited together
E2848 tells you how to measure and model the plant; E2939 tells you what conditions to evaluate it at and what to expect. E2848 without E2939 gives you a model with nothing to judge it against; E2939 without E2848 gives you a target with no rigorous measurement. Together they form the complete, defensible capacity test that lenders and EPC contracts rely on.
Instruments required for the capacity test
The E2848 regression is driven by measured weather, so the capacity test requires the full sensor suite listed in the scope — GHI and front-POA pyranometers, rear-POA pyranometers, diffuse pyranometers, an albedometer, a soiling station, an ambient air temperature sensor, wind speed sensors, back-of-module sensors, and a rain gauge — alongside revenue-grade power measurement. Each of these is explained in depth in the Instrumentation section below.
The Performance Ratio Test: IEC 61724-1
Where the capacity test is a commissioning snapshot, the performance ratio (PR) test measures how the plant behaves over a full year of operation. It is governed by IEC 61724-1:2021, Photovoltaic system performance – Part 1: Monitoring, the international standard for how PV monitoring systems are designed, what they measure, and how accurately.
What performance ratio actually measures
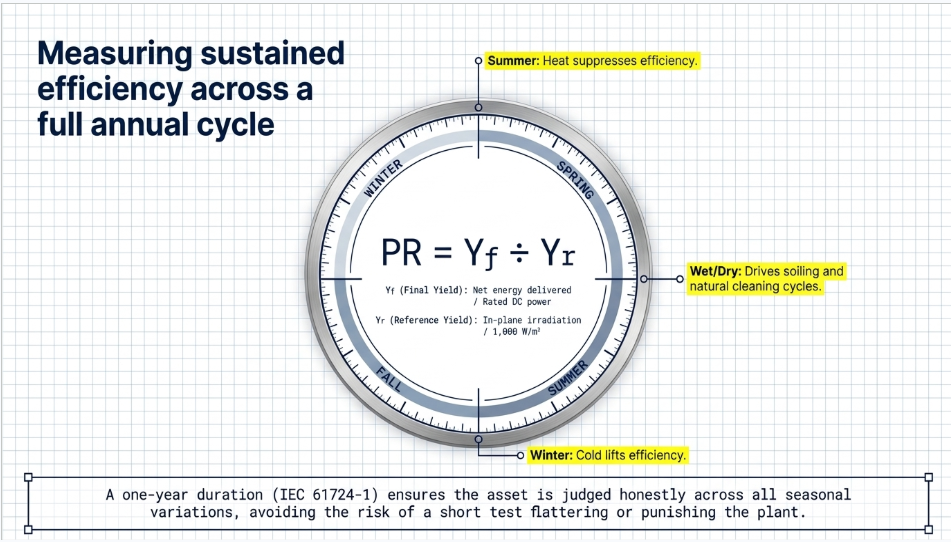
Performance ratio expresses how much of the energy that could have been produced (given the sunlight that actually fell on the array and the plant's nameplate rating) was in fact delivered. It is dimensionless, usually expressed as a percentage, and is defined as the ratio of the final yield to the reference yield:
PR = Yf ÷ Yr
The final yield (Yf) is the net energy delivered divided by the plant's rated DC power. The reference yield (Yr)) is the in-plane (POA) irradiation divided by the reference irradiance of 1,000 W/m² at standard test conditions. In plain terms: reference yield is the number of “peak sun hours” the array received; final yield is the number of full-power hours it actually produced. Their ratio is the fraction of ideal performance achieved, after real-world losses such as temperature, soiling, wiring, inverter conversion, mismatch, and downtime.
Temperature-corrected PR
A plant's PR naturally dips in summer because hot cells are less efficient — a physical effect, not a defect. To judge the equipment fairly across seasons, IEC 61724-1 also defines a temperature-corrected performance ratio, which normalizes each interval's output to a reference cell temperature using the modules' temperature coefficient and the measured back-of-module temperature. This is precisely why the scope includes back-of-module sensors: without them, a summer PR guarantee in a hot climate would be unfairly penalized by heat that has nothing to do with build quality. Temperature-corrected PR separates “the modules are hot today” from “the plant is underperforming.”
Monitoring classes and why utility-scale means Class A
IEC 61724-1 defines monitoring classes — A, B, and C — that scale accuracy and sensor requirements to the stakes of the project. Class A is the highest-accuracy tier and the expectation for utility-scale, financed assets. Class A calls for the most accurate, calibrated instruments (for example, ISO 9060 Class A pyranometers), tighter measurement-uncertainty limits, and a fuller set of measured parameters. The 2021 edition notably added explicit treatment of reflected/albedo irradiance and bifacial considerations, and it requires dew and frost mitigation (heating/ventilation) on Class A irradiance sensors so that morning moisture does not corrupt data.
Sampling, recording, and calibration
Class A monitoring specifies how often data is sampled and recorded. Fast-changing quantities such as irradiance and electrical power are sampled at short intervals (on the order of seconds) and typically stored as one-minute averages, which are then aggregated to hourly, daily, monthly, and annual figures for PR reporting. All sensors must carry current, traceable calibration certificates, and the standard sets accuracy and placement requirements for each measured parameter. Rigorous data completeness — accounting for and flagging any gaps — is part of a defensible one-year result.
Why the PR test runs a full year
A one-year duration is not padding; it is the point. Only a full annual cycle captures the summer heat that suppresses efficiency, the winter cold that lifts it, the seasonal sun-angle changes that shift bifacial gain, the wet and dry periods that drive soiling and natural cleaning, and the pollen or dust events characteristic of the site. A month-long test could flatter or punish a plant depending on when it happened to run; a year gives owners and lenders an honest, defensible measure of sustained performance.
Data to be collected — primary parameters
The scope's primary parameters are the measurements that directly enter the PR calculation and the plant's energy accounting. Each is explained below, followed by a reference table.
- i. Global Horizontal Irradiance — GHI (W/m²). The total solar energy striking a horizontal surface. GHI is the reference against which other irradiance measurements are checked, supports satellite/model correlation, and underpins quality control of the POA data.
- ii. Diffuse Horizontal Irradiance (W/m²). The scattered (non-direct) portion of sunlight, measured with a shaded pyranometer. It lets the site's light be decomposed into direct and diffuse components, which is essential for transposition modeling and for understanding performance under variable skies.
- iii. Front Plane-of-Array Irradiance — POA (W/m²). The irradiance in the plane of the modules on the front side. This is the single most important environmental measurement: it is the reference yield's numerator and the dominant driver of production. Multiple sensors are distributed across a large array to represent it faithfully.
- iv. Rear Plane-of-Array Irradiance (W/m²). For bifacial modules, the irradiance reaching the back of the panels. Measuring it directly is how bifacial gain is quantified and credited, rather than merely assumed — central to fairly evaluating this plant.
- v. Ambient Air Temperature (°C). Air temperature in a shielded/aspirated housing. It characterizes site conditions, feeds the E2848 regression, and provides context for module-temperature behavior.
- vi. Albedo (%). The fraction of sunlight reflected by the ground, measured with an albedometer. Albedo largely determines how much light reaches the modules' rear side, so it is a first-order input to bifacial performance.
- vii. Soiling Losses (%). The energy lost to dust, dirt, and debris on the module glass, measured with a soiling station. It distinguishes true equipment underperformance from a surface that simply needs cleaning, and informs the O&M cleaning schedule.
- viii. Wind Speed (m/s). Wind cools the modules and is a correction term in the E2848 regression; it also provides operating context for irradiance sensors.
- ix. Electrical Energy Produced — Wh (energy meter). The revenue-grade measurement of delivered energy. This is the numerator of the plant's real output and the basis of the final yield in PR. Meter accuracy and traceability are as important here as sensor calibration.
| # | Primary parameter | Unit | Role in the analysis |
|---|---|---|---|
| i | Global Horizontal Irradiance (GHI) | W/m² | Reference & QC for irradiance |
| ii | Diffuse Horizontal Irradiance | W/m² | Sky decomposition / transposition |
| iii | Front Plane-of-Array Irradiance | W/m² | Reference yield; dominant driver |
| iv | Rear Plane-of-Array Irradiance | W/m² | Quantifies bifacial gain |
| v | Ambient Air Temperature | °C | Regression input; site context |
| vi | Albedo | % | Drives rear-side irradiance |
| vii | Soiling Losses | % | Separates dirt from defects |
| viii | Wind Speed | m/s | Module cooling; regression term |
| ix | Electrical Energy Produced | Wh | Delivered output; PR numerator |
Data to be collected secondary parameters
Secondary parameters are not always in the headline PR formula, but they are indispensable for diagnosis, temperature correction, and explaining why a plant performs as it does.
- i. Back-of-Module Temperature (°C). The module's actual operating temperature, sensed on the rear surface. It is the basis of temperature-corrected PR and the key to judging the plant fairly through a hot summer.
- ii. DC Power at the Inverter Level (kW). Power on the DC side of each inverter. Comparing DC power to expected values localizes underperformance to specific combiner/inverter blocks and reveals string or tracker issues.
- iii. AC Power at the Inverter Level (kW). Power on the AC side of each inverter. Paired with DC power, it exposes inverter conversion efficiency and clipping behavior.
- iv. Rainfall (mm). Measured with a rain gauge. Rainfall correlates with natural cleaning and soiling recovery, helping interpret soiling trends and validate the cleaning strategy.
| # | Secondary parameter | Unit | Why it is collected |
|---|---|---|---|
| i | Back-of-Module Temperature | °C | Temperature-corrected PR |
| ii | DC Power at inverter level | kW | Localize underperformance; DC health |
| iii | AC Power at inverter level | kW | Inverter efficiency & clipping |
| iv | Rainfall | mm | Natural cleaning / soiling context |
Instrumentation Deep-Dive: Every Sensor in the Scope
Both the capacity test and the PR test draw on the same instrument suite. Below, each instrument from the scope is explained in depth — what it measures, why it matters, and what good practice requires for accuracy and placement. For a utility-scale, financed, bifacial plant, all of these should meet IEC 61724-1 Class A expectations with current, traceable calibration.
GHI and Front-POA pyranometers
Pyranometers are thermopile sensors that measure broadband solar irradiance. Two orientations are used. A GHI pyranometer is mounted horizontally to capture global horizontal irradiance; front-POA pyranometers are mounted coplanar with the modules to capture the irradiance actually reaching the array's front face. POA is the workhorse measurement — it is the independent variable in the E2848 regression and the reference-yield input in PR — so multiple POA sensors are distributed across a large site to represent spatial variation, and on trackers they move with the modules. For Class A monitoring these should be ISO 9060 Class A (secondary-standard) pyranometers with heating/ventilation to prevent dew and frost, and traceable calibration.
Rear-POA pyranometers
Bifacial modules generate power from light striking their back surface, so rear-POA pyranometers are mounted facing the ground behind the modules to measure that rear irradiance directly. Because rear irradiance varies with row position, module height, ground cover, and shading, several rear sensors are typically deployed and averaged. These measurements are how bifacial gain is credited from data rather than estimated — essential to fairly evaluating a bifacial plant and a capability formalized in the 2021 edition of IEC 61724-1.
Diffuse pyranometers
A diffuse pyranometer measures the scattered component of sunlight by blocking the direct beam — traditionally with a shadow ball on a solar tracker, or with a shadowband. Subtracting diffuse from global (and combining with direct-normal information) lets the site's irradiance be fully characterized, which improves transposition modeling from horizontal to plane-of-array and strengthens quality control of the POA data. It supplies the scope's Diffuse Horizontal Irradiance parameter.
Albedometer
An albedometer is effectively two pyranometers back-to-back: one facing up to measure incoming irradiance and one facing down to measure reflected irradiance. Their ratio is the ground albedo. For bifacial plants this is a first-order measurement, because the rear-side resource depends directly on how reflective the ground is — bright soil, gravel, or vegetation each yield very different bifacial gains. Consistent albedo measurement is what turns rear-side production from an assumption into a verified quantity.
Soiling station
A soiling station quantifies the energy lost to dust and dirt on the modules. The common approach compares two matched reference devices — one kept clean and one allowed to soil naturally — and derives the soiling ratio (and thus soiling losses) from the difference in their output. This matters enormously in semi-arid, dust-prone environments, and it protects both parties: it prevents a dirty array from being mistaken for a defective one, and it gives the owner data to optimize cleaning frequency against cost.
Ambient air temperature sensor
Ambient temperature is measured with a precision sensor (typically a platinum RTD) inside a radiation shield, often aspirated, so that sunlight does not bias the reading. It is a correction variable in the E2848 regression, a characterization parameter for the site, and important context for interpreting module temperatures. Proper shielding and placement away from heat sources are essential to accuracy.
Wind speed sensors
Anemometers measure wind speed at a defined, documented height. Wind convectively cools the modules — raising efficiency — and appears as a term in the E2848 regression, so capturing it improves the model's fidelity. Wind data also provides operating context for the irradiance sensors and the plant's thermal behavior. Both cup and ultrasonic anemometers are used; placement and height must be recorded for the data to be meaningful.
Back-of-module sensors
Back-of-module (BOM) temperature sensors — RTDs or thermocouples bonded to the rear of representative modules — measure the cells' true operating temperature. Because silicon efficiency falls as temperature rises, BOM temperature is the key input for temperature-corrected PR and for normalizing the capacity result. Multiple sensors are placed across the array (different rows, orientations, and positions) to represent the fleet, and good thermal bonding is critical to avoid reading air rather than module temperature.
Rain gauge
A rain gauge — usually a tipping-bucket type — records precipitation depth. Rainfall is the primary natural cleaning mechanism for a PV array, so correlating rain events with the soiling station's readings explains soiling recovery, validates the cleaning strategy, and adds context to seasonal performance trends. It provides the scope's Rainfall parameter.
Bifacial and Site-Specific Considerations
Bifacial performance is only as good as its measurement
This plant's inclusion of rear-POA pyranometers and an albedometer signals a bifacial design, and bifacial plants raise the stakes on instrumentation. Bifacial gain — the extra energy from rear-side light — can be a meaningful share of production, but it is highly sensitive to ground albedo, row spacing, module height, and tracker behavior. If rear irradiance and albedo are not measured well, the plant's true capability is either under-credited (unfair to the EPC) or over-credited (a risk to the owner and lender). Rigorous rear-side and albedo measurement, aligned with IEC 61724-1:2021, is what makes a bifacial guarantee defensible.
Heat, soiling, and grid curtailment
Local climate and grid conditions shape the test in three ways. First, heat: high summer temperatures depress raw PR, making back-of-module measurement and temperature correction essential to a fair result, and a summer test window means the capacity test may run in demanding thermal conditions. Second, soiling: semi-arid or agricultural environments make the soiling station and rain-gauge correlation particularly valuable over the year. Third, grid curtailment: in constrained or volatile markets, curtailment and negative-price intervals can force the plant offline for reasons unrelated to its capability, so availability and curtailment must be carefully separated from performance in both tests to avoid unfairly penalizing the asset.
How Keentel Engineering Delivers Performance Testing
Keentel Engineering supports owners, developers, and independent engineers across the full performance-testing lifecycle — turning a scope like this one into a defensible, on-schedule result. Our involvement typically spans:
- Test plan and protocol development. A project-specific procedure that binds the contract's guarantees to ASTM E2848/E2939 and IEC 61724-1, defines reporting conditions and expected capacity, and sets acceptance criteria and data-filtering rules up front — before disputes can arise.
- Instrumentation design and commissioning. Selecting, siting, and verifying the full sensor suite (POA/GHI/rear/diffuse pyranometers, albedometer, soiling station, temperature, wind, rain, and revenue-grade metering) to Class A standards with traceable calibration.
- Capacity test execution and analysis. Running the seven-day (or longer, as data quality requires) test, performing the regression, applying quality filters, and reporting the measured-to-expected capacity ratio.
- One-year PR monitoring and reporting. Data acquisition, gap accounting, temperature correction, soiling and bifacial analysis, and periodic PR reporting through to the final annual result.
- Independent review and dispute support. Objective, standards-based analysis that owners, EPCs, and lenders can all trust — including review of a counterparty's test where an independent check is needed.
Get a quotation for your performance test
Planning a capacity test or a one-year PR test for a utility-scale or bifacial PV plant? Keentel Engineering can scope the instrumentation, write the test protocol, and execute and analyze both the ASTM E2848/E2939 capacity test and the IEC 61724-1 PR test. Contact us at keentelengineering.com to request a quotation and align the test with your EPC contract and lender requirements.
Frequently Asked Questions
A capacity test (ASTM E2848/E2939) is a short, intensive measurement — about seven days — that verifies the plant reaches its expected power at a fixed set of reporting conditions; it is used for substantial completion and EPC final payment. A performance ratio test (IEC 61724-1) runs a full year and measures how efficiently the plant converts available sunlight into delivered energy across all seasons; it is used for long-term production guarantees and lender assurance. Most utility-scale projects use both.
Seven days is usually enough to accumulate the volume of clean, high-irradiance, stable data the ASTM E2848 regression needs after quality filtering (excluding low light, unstable intervals, and out-of-band conditions). If weather is poor, the window may extend until data-quality thresholds are met — the test ends when the data are statistically sound, not simply when seven days elapse.
It depends on climate, technology, and design, and the meaningful target is the contractual PR guarantee set for the specific plant. Modern utility-scale plants often achieve high PR values, but hot climates naturally lower raw PR in summer — which is exactly why IEC 61724-1 defines a temperature-corrected PR to judge the equipment fairly.
Because this is a bifacial plant. Bifacial modules produce extra energy from light reflected off the ground onto their back side. Rear-POA pyranometers measure that rear light directly, and the albedometer measures ground reflectivity, which drives it. Measuring both lets bifacial gain be credited from data rather than assumed — protecting the owner from over-crediting and the EPC from under-crediting.
They are secondary in the sense that they do not appear in the basic PR ratio, but they are essential for the temperature-corrected PR and for normalizing the capacity result. Without back-of-module temperature, a plant tested in a hot summer would be unfairly penalized for heat effects that are physical, not defects.
Class A under IEC 61724-1. Class A is the highest-accuracy tier, expected for large, financed assets, and requires the most accurate calibrated instruments (e.g., ISO 9060 Class A pyranometers), dew/frost mitigation, tighter uncertainty limits, and a fuller parameter set — all with traceable calibration.
Curtailment and negative-price intervals can take the plant offline for reasons unrelated to its capability. Both the capacity test and the PR analysis must separate curtailment and availability from performance, so the plant is judged on what it can produce rather than on grid or market constraints. Defining this treatment in the test protocol up front prevents disputes.

About the Author:
Sandip "Sonny" R. Patel, P.E.
IEEE Senior Member · Founder & CEO, Keentel Engineering
In 1995, Sonny Patel earned his Electrical Engineering degree from the University of Illinois. But degrees don't build legacies — action does.
For three decades, he has worked the power industry from every side of the table: 16 years as a utility engineer at Exelon/Commonwealth Edison; generation leadership across hydroelectric, industrial steam turbine, and a 9 GW renewable fleet; NERC Regional Entity Senior Compliance Engineer and Audit Team Lead, auditing some of the nation's largest utilities; and testing and commissioning lead on equipment up to 765 kV — the very top of the North American grid.Utility. Generator. Regulator. Consultant. Few engineers have seen all four seats. Fewer still have sat in them.
His experience spans nuclear, hydro, conventional generation, renewables, oil and gas, mining — and today's data centers, where he is authoring a three-book series on data center design. He is a Licensed Professional Engineer in six states and a Licensed Electrical Contractor in Florida (Unlimited EC) — he doesn't just design the work; he's qualified to stand behind its execution.Today, as Founder and CEO of Keentel Engineering, Sonny leads a nationwide team of engineers delivering substation design, power system studies, NERC compliance, and commissioning — done right, coast to coast.Three decades. Every side of the table. One standard: accountable engineering.
Services

Let's Discuss Your Project
Let's book a call to discuss your electrical engineering project that we can help you with.
About the Author:
Sandip "Sonny" R. Patel, P.E.
IEEE Senior Member · Founder & CEO, Keentel Engineering
In 1995, Sonny Patel earned his Electrical Engineering degree from the University of Illinois. But degrees don't build legacies — action does.
For three decades, he has worked the power industry from every side of the table: 16 years as a utility engineer at Exelon/Commonwealth Edison; generation leadership across hydroelectric, industrial steam turbine, and a 9 GW renewable fleet; NERC Regional Entity Senior Compliance Engineer and Audit Team Lead, auditing some of the nation's largest utilities; and testing and commissioning lead on equipment up to 765 kV — the very top of the North American grid.
Utility. Generator. Regulator. Consultant. Few engineers have seen all four seats. Fewer still have sat in them.
His experience spans nuclear, hydro, conventional generation, renewables, oil and gas, mining — and today's data centers, where he is authoring a three-book series on data center design. He is a Licensed Professional Engineer in six states and a Licensed Electrical Contractor in Florida (Unlimited EC) — he doesn't just design the work; he's qualified to stand behind its execution.
Today, as Founder and CEO of Keentel Engineering, Sonny leads a nationwide team of engineers delivering substation design, power system studies, NERC compliance, and commissioning — done right, coast to coast.Three decades. Every side of the table. One standard: accountable engineering.
Leave a Comment
Thank you for contacting us.
We will get back to you as soon as possible.
We will get back to you as soon as possible.
Oops, there was an error sending your message.
Please try again later.
Please try again later.
Related Posts
By SANDIP R PATEL
•
October 20, 2026
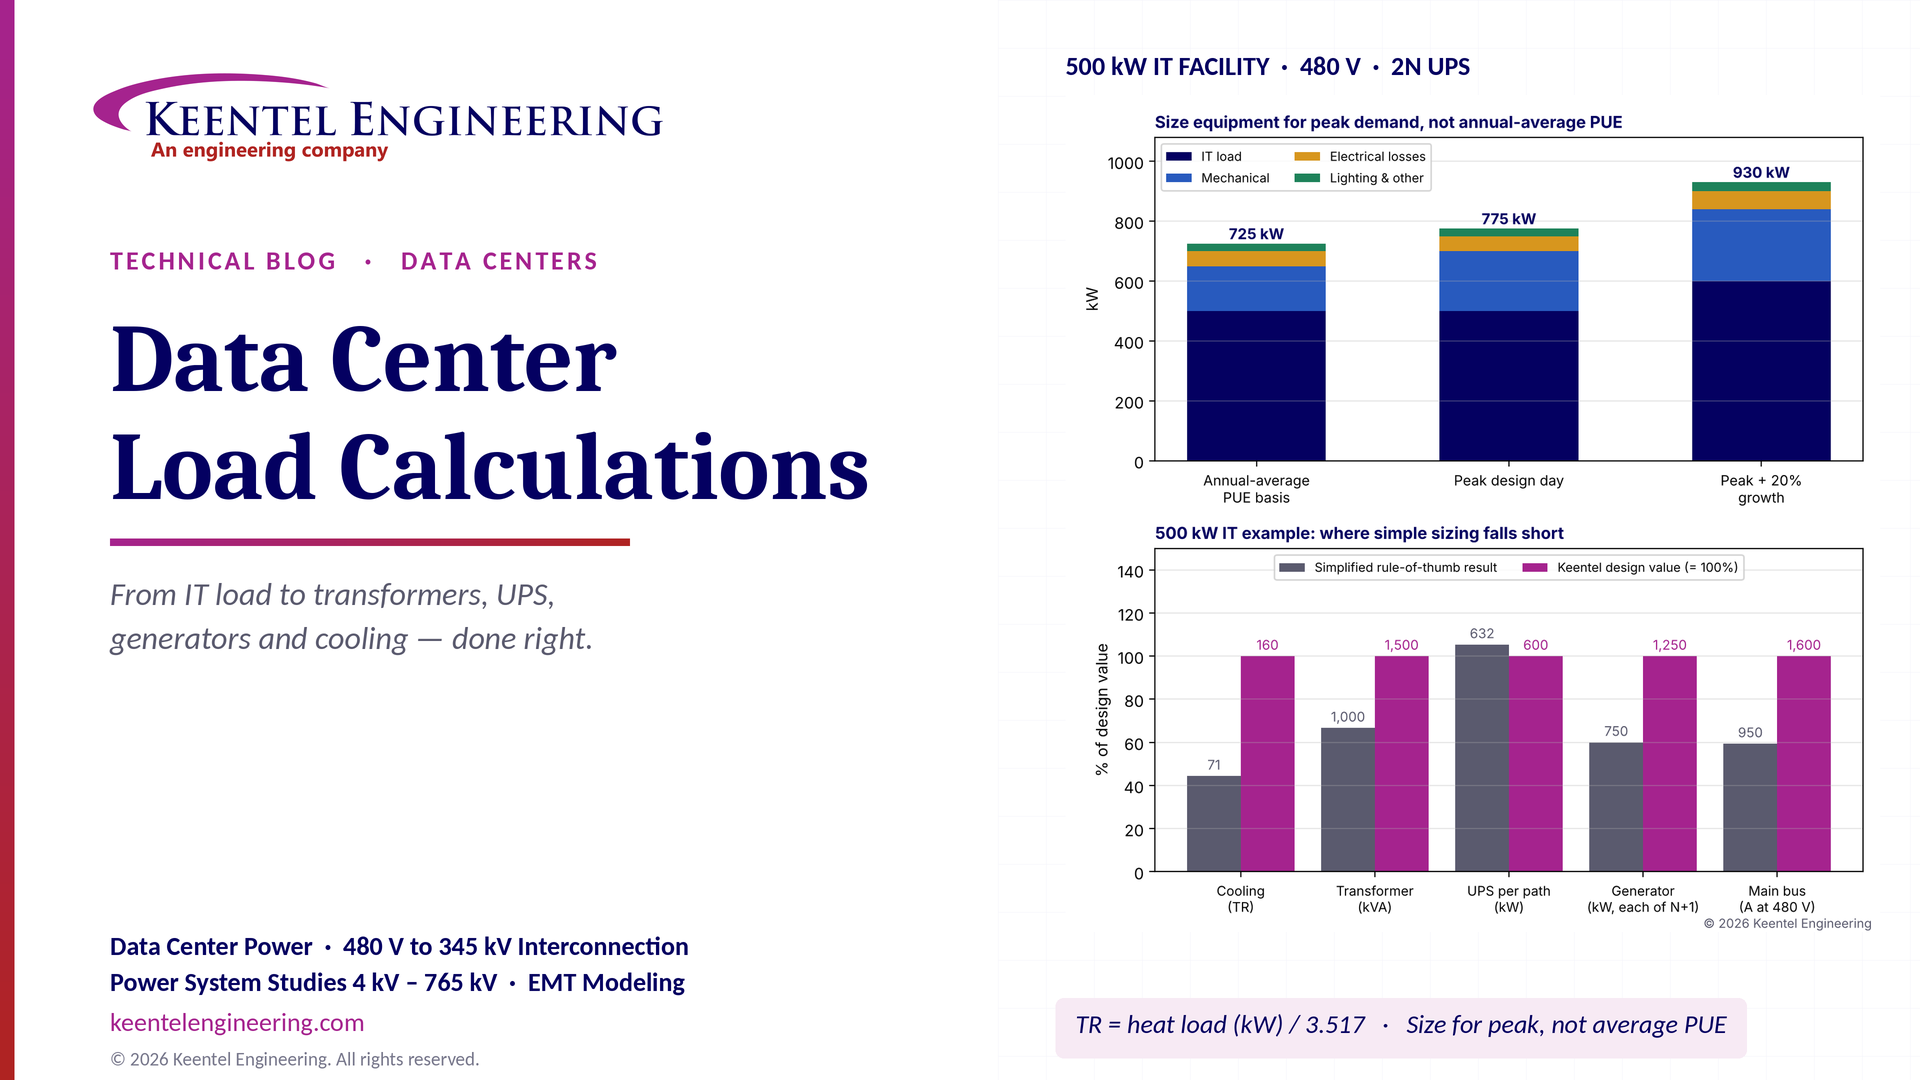
Learn data center electrical load calculations, including IT demand, PUE, UPS and generator sizing, cooling loads, redundancy, and worked US examples.
By SANDIP R PATEL
•
October 20, 2026
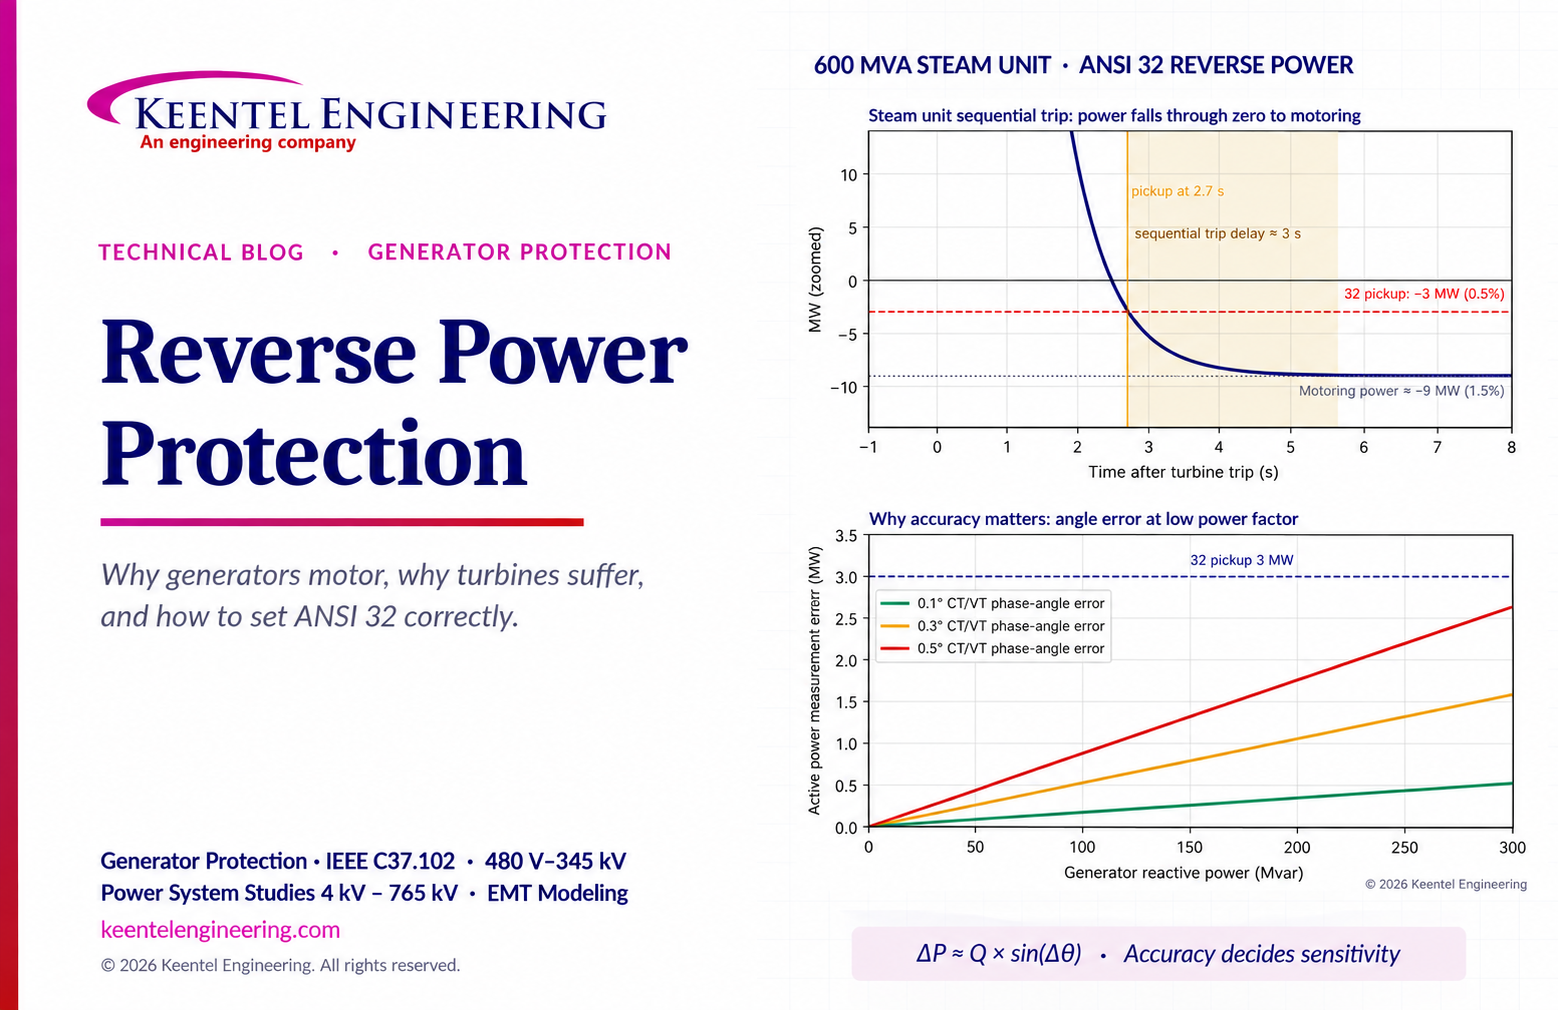
Learn reverse power protection (ANSI 32), generator motoring, relay pickup settings, time delays, sequential tripping and testing for US power plants.
Copy
By Team 2 Dexora
•
October 20, 2026
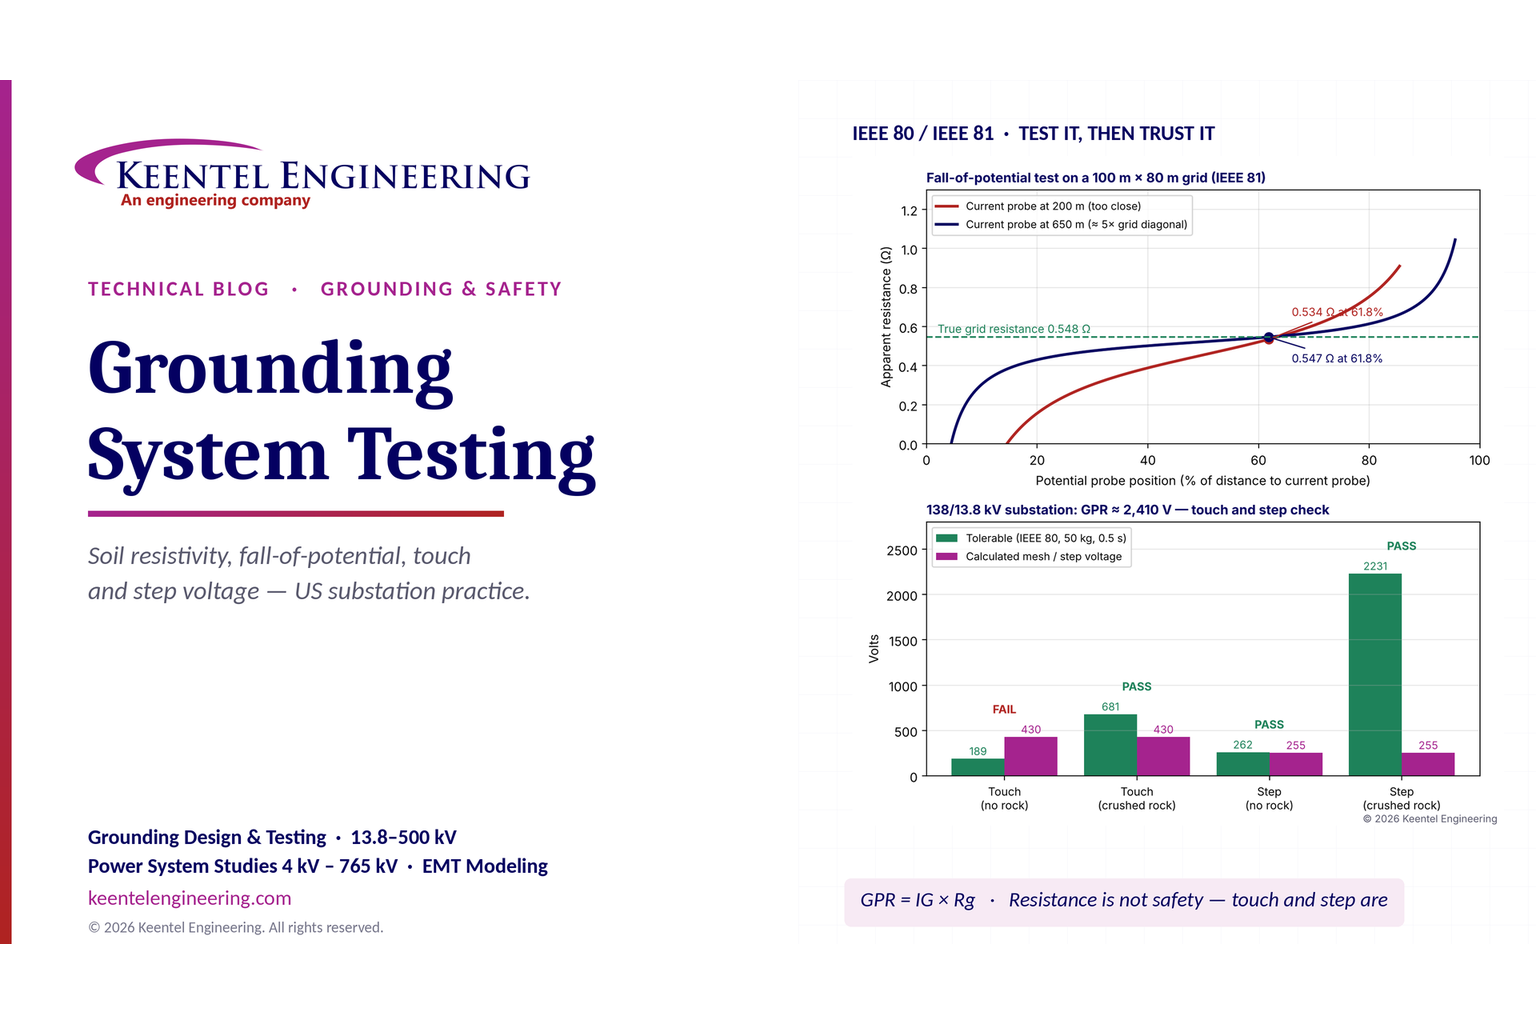
Explore grounding system testing with Keentel Engineering. Learn IEEE 80/81 methods, soil resistivity, ground resistance, and touch and step voltage safety.

By SANDIP R PATEL
•
October 13, 2026
Plan data center capacity with land screening, MW-per-acre estimates, grid power availability and interconnection feasibility studies from Keentel Engineering.
By SANDIP R PATEL
•
October 11, 2026
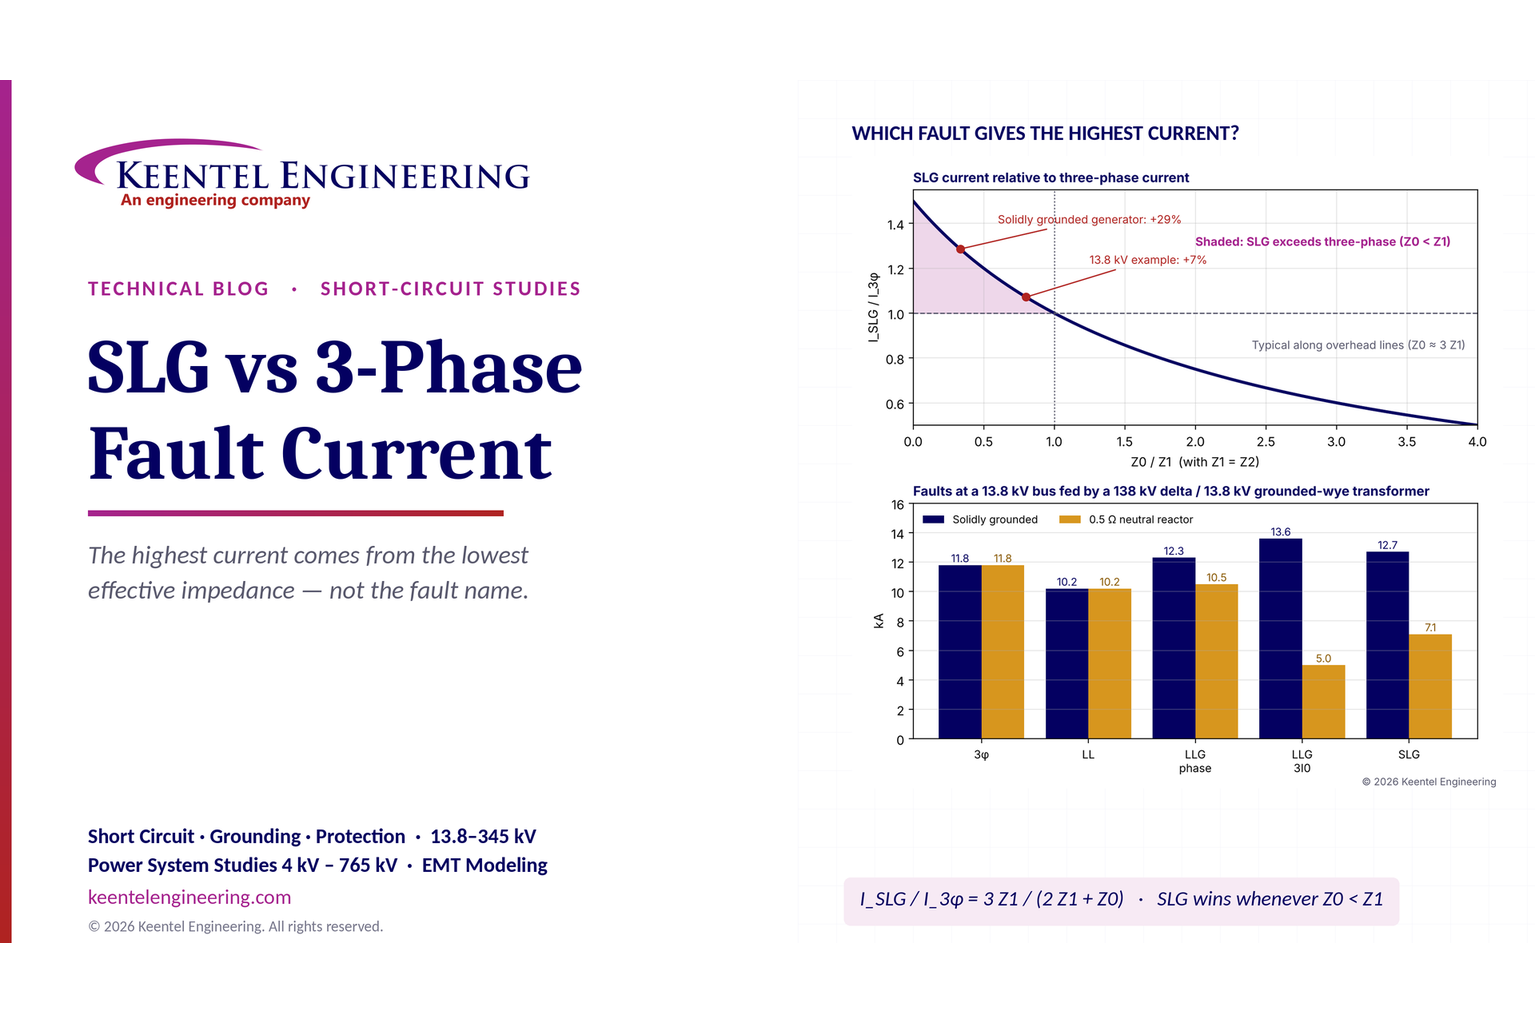
Learn which fault produces the highest current at a bus, why SLG faults can exceed three-phase faults, and how symmetrical components determine fault duty.
By SANDIP R PATEL
•
October 11, 2026
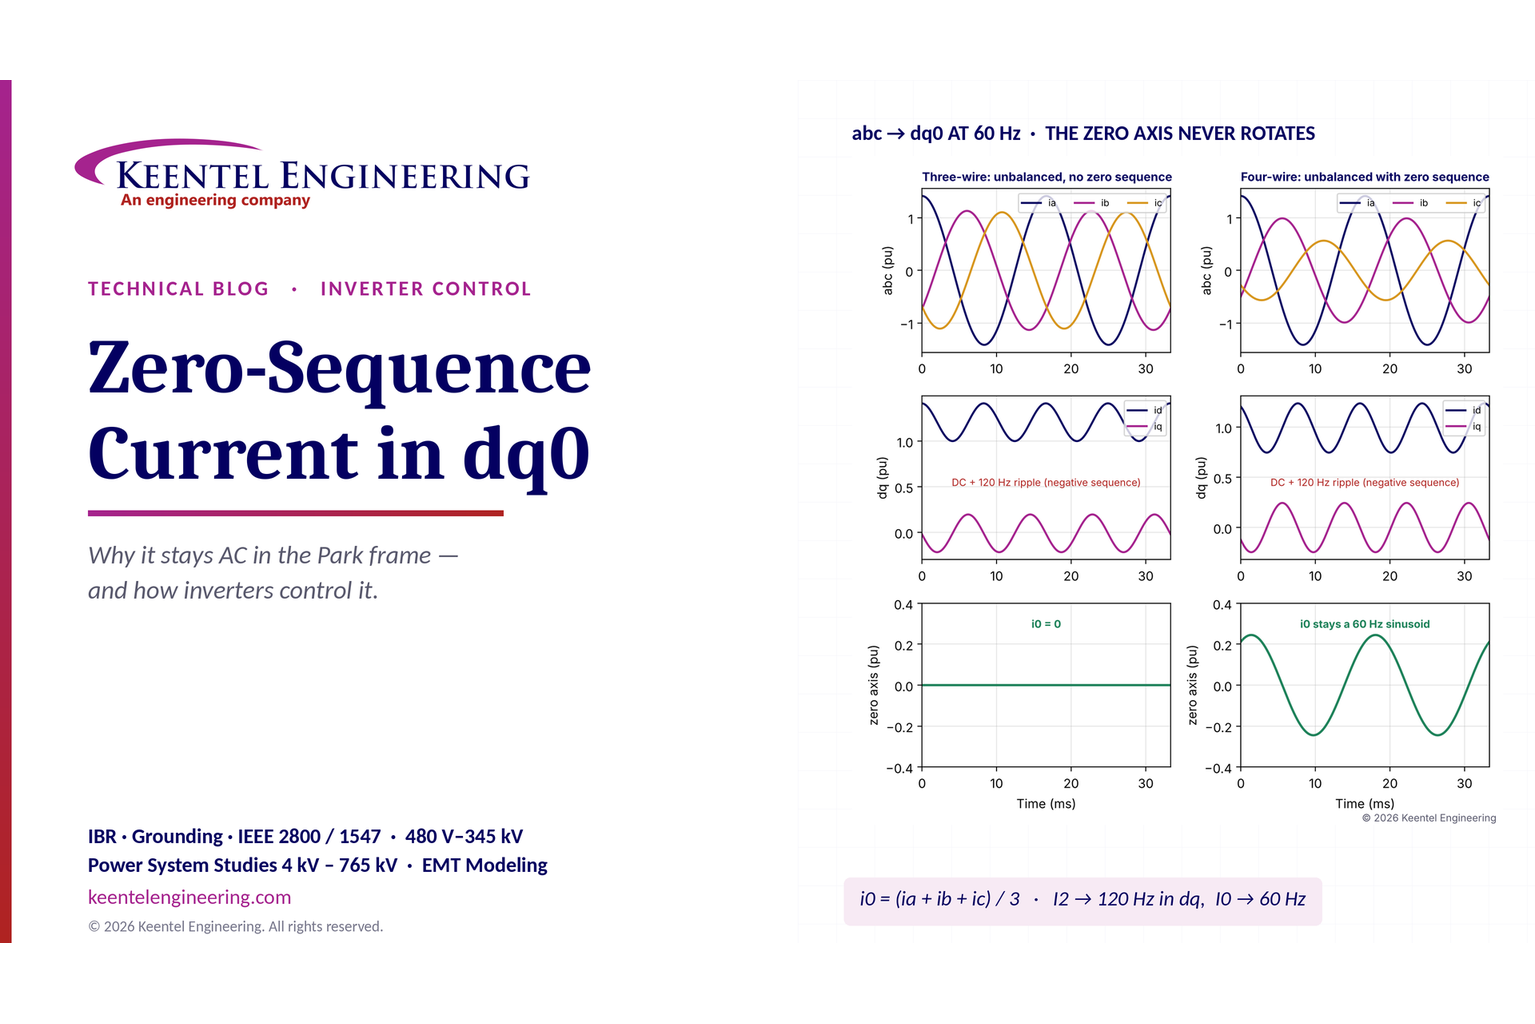
Learn why zero-sequence current pulsates in the dq0 frame, how Park's transformation works, and how inverter controls handle unbalance and ground faults.
By SANDIP R PATEL
•
October 11, 2026
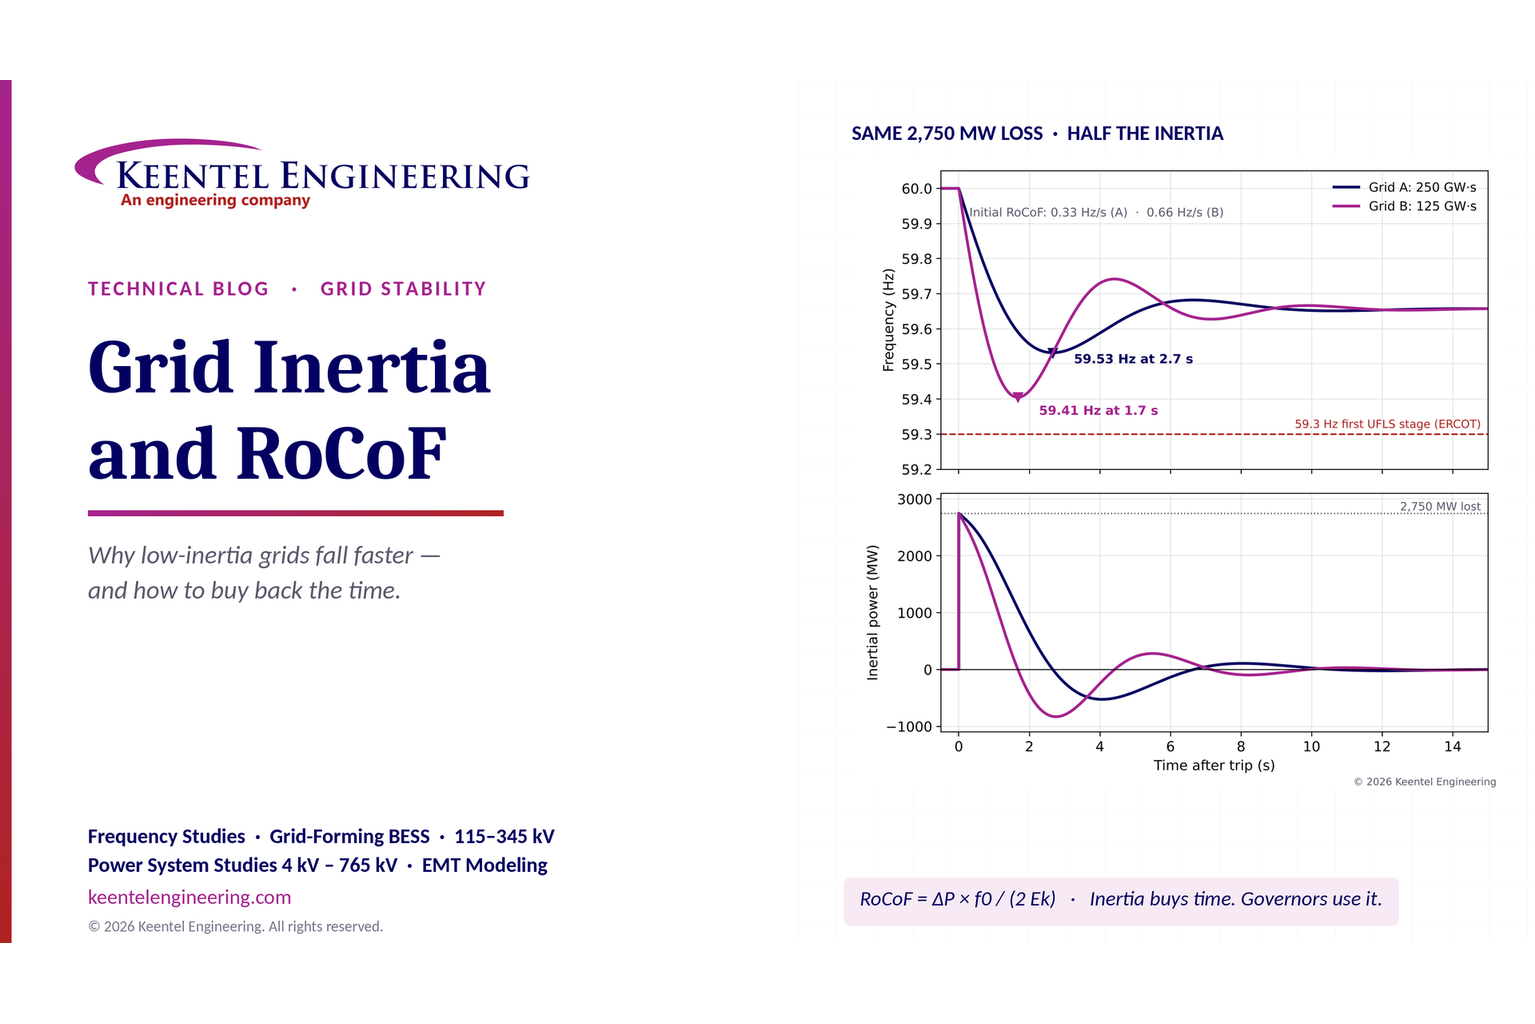
Explore grid inertia, RoCoF and frequency response, with swing equation calculations, frequency nadir analysis and US power system simulation examples.
By SANDIP R PATEL
•
October 11, 2026
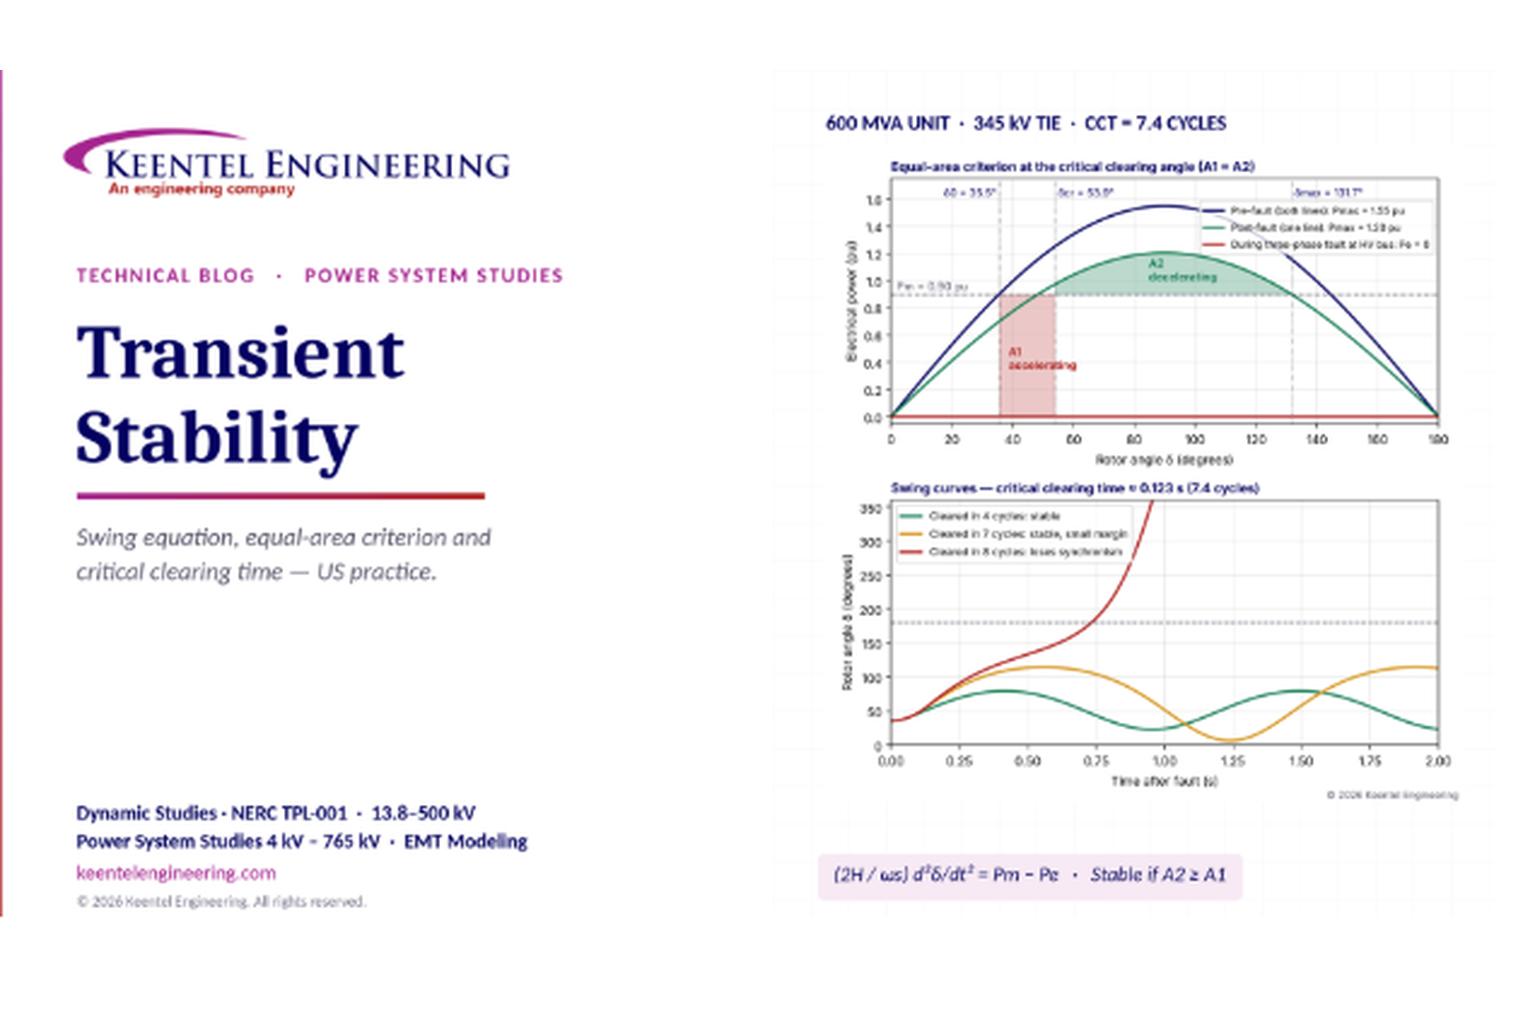
Learn transient stability analysis, swing equation, equal-area criterion and critical clearing time with a 345 kV worked example and NERC TPL-001 guidance.
By SANDIP R PATEL
•
October 11, 2026
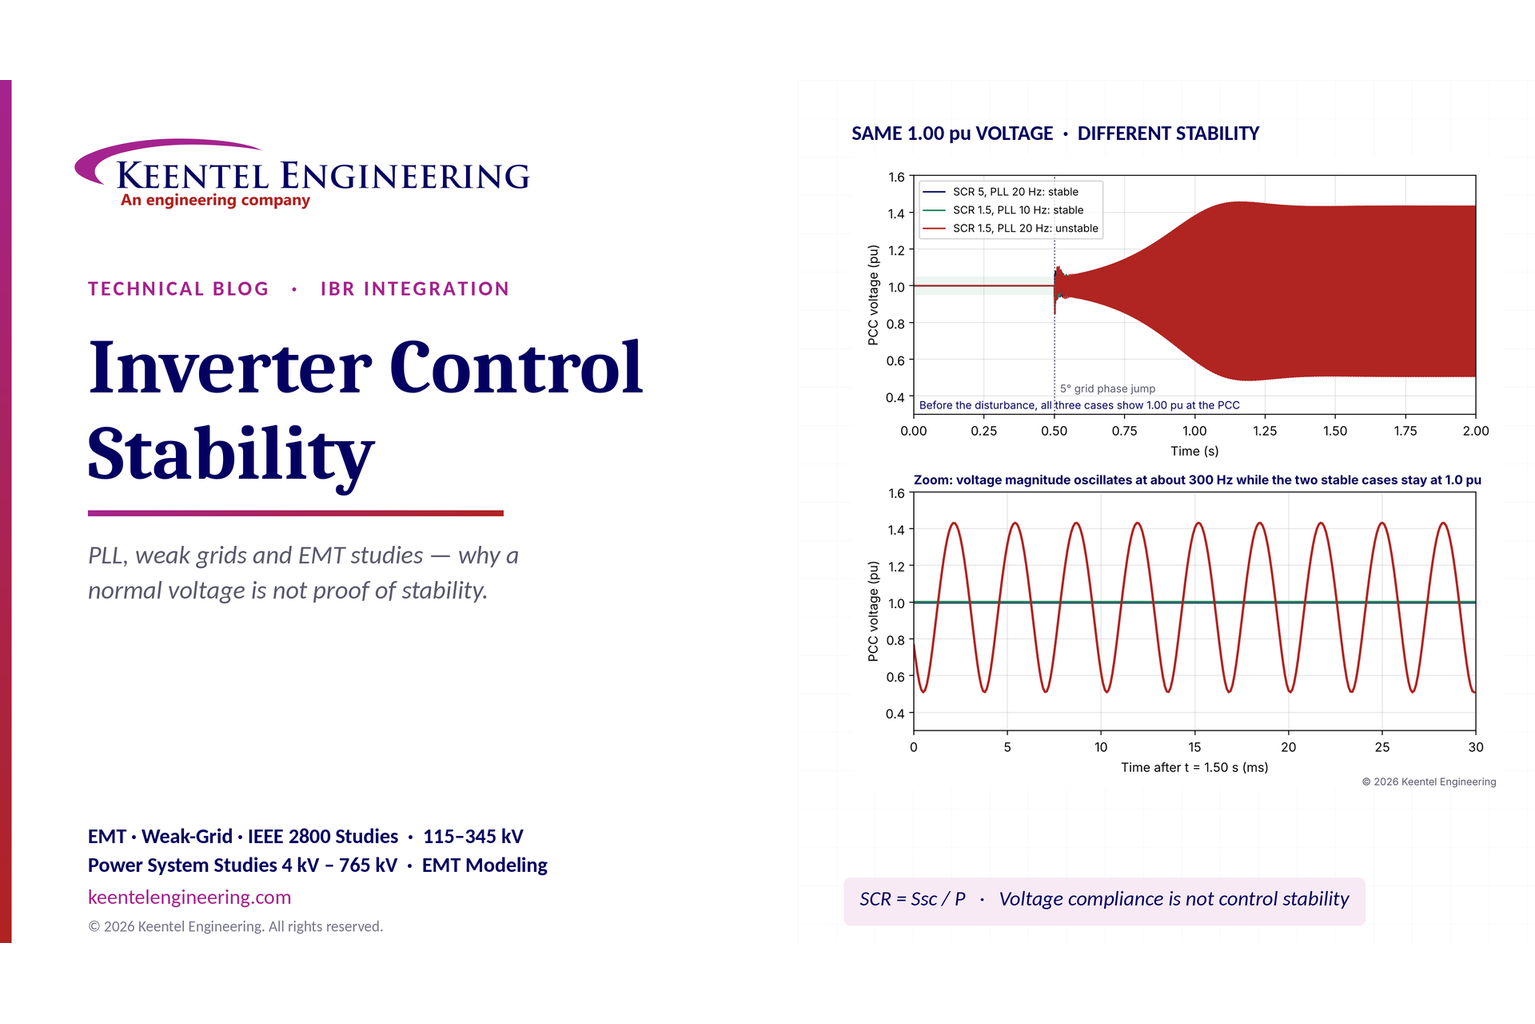
Learn why inverter controls become unstable in weak grids, how PLL bandwidth and SCR affect stability, and how PSCAD EMT studies identify and mitigate oscillations.





