Part A — TPL-001-5.1 at a Glance
Every new transmission line, every transformer replacement, every special protection scheme and most interconnection upgrades in the United States begin as a line in a planning study. That study is almost always driven, directly or indirectly, by one NERC Reliability Standard: TPL-001-5.1 — Transmission System Planning Performance Requirements.
The purpose statement in the standard is a single sentence: to "establish Transmission system planning performance requirements within the planning horizon to develop a Bulk Electric System (BES) that will operate reliably over a broad spectrum of System conditions and following a wide range of probable Contingencies."
In everyday words, TPL-001 asks one question every year: if we keep building the grid the way we have planned it, and then something breaks, will the lights stay on, will equipment stay within its ratings, and will the system stay stable? If the answer is "no," the standard requires the planner to write down how the problem will be fixed. That written fix is called a Corrective Action Plan.
In plain terms: TPL-001 is the grid's annual medical check-up. The planner builds a computer model of the future grid, knocks out pieces of it one at a time and in combinations, and checks the vital signs — flows, voltages, stability and fault duty. If a vital sign is out of range, the planner must prescribe a treatment and track it until it is done.
This article explains, in plain English and in engineering depth, who does what under TPL-001-5.1. Only two registered functions are directly responsible — the Planning Coordinator (PC) and the Transmission Planner (TP) — but the assessment cannot be done without data and decisions from Generator Owners, Transmission Owners, Distribution Providers, Resource Planners, Balancing Authorities and Transmission Service Providers. We walk through every requirement, explain Table 1 event by event, work through numerical examples and close with three anonymous US case studies and 25 detailed FAQs.
The standard in one page
| Item | What TPL-001-5.1 says |
|---|---|
| Full title | Transmission System Planning Performance Requirements |
| Applicable entities | Planning Coordinator and Transmission Planner — no other functional entity |
| Requirements | Eight (R1–R8) |
| Core product | An annual Planning Assessment of the entity's portion of the BES |
| Planning horizons | Near-Term (years one through five) and Long-Term (years six through ten) |
| Study types | Steady state, short circuit and Stability |
| Events studied | Table 1 planning events P0–P7 and Table 1 extreme events |
| When performance is not met | Corrective Action Plan (R2 Parts 2.7 and 2.8) |
| Sharing | Adjacent PCs and TPs within 90 calendar days of completing the assessment; any functional entity with a reliability need within 30 days of a written request |
| Evidence retention | Three calendar years for each requirement |
| Regional variances | None |
| US effective date of version 5.1 | July 1, 2023 |
| Key regulatory history | TPL-001-5 approved by FERC on January 23, 2020 (Docket No. RM19-10-000); errata version 5.1 approved June 10, 2020 (Docket No. RD20-8-000) |
Who does what — the short version
The table below is the heart of this article. Notice that TPL-001 assigns legal obligations only to the PC and TP. Everyone else participates through other standards, tariffs, interconnection agreements and regional planning processes.
| Entity | Role under TPL-001-5.1 | How they feed or are affected by the assessment |
|---|---|---|
| Planning Coordinator (PC) | Directly responsible for R1–R8. Coordinates its TPs (R7). Often builds the regional base cases and runs wide-area stability. | Gathers data through MOD-032 procedures, sets or adopts voltage and instability criteria, shares results with neighbors. |
| Transmission Planner (TP) | Directly responsible for R1–R8 for its portion of the BES. Usually runs the detailed local steady-state, short-circuit and CAP work. | Builds local models, contingency lists, CAPs; answers comments. |
| Generator Owner (GO) | No TPL-001 requirement. | Supplies unit data and dynamic models (MOD-032), verified models (MOD-026, MOD-027), ride-through settings (PRC-024 and, for IBRs, PRC-029), and is affected by CAPs such as generation runback or RAS. |
| Transmission Owner (TO) | No TPL-001 requirement. | Supplies impedances, Facility Ratings (FAC-008), relay settings, breaker ratings and short-circuit data; builds most CAP projects; owns the equipment checked in R2.3 and R2.8. |
| Distribution Provider (DP) | No TPL-001 requirement. | Supplies load forecasts and load data; owns UFLS/UVLS; under newer MOD-032 versions, supplies aggregate DER data. The DP's customers are the "Non-Consequential Load" the standard tries to protect. |
| Resource Planner (RP) | No TPL-001 requirement. | Supplies planned resources and retirements that define the "resources required for Load" in R1 Part 1.1.5. |
| Balancing Authority (BA) | No TPL-001 requirement. | Supplies dispatch practices, reserve assumptions and Interchange data; implements re-dispatch used in some CAPs and system adjustments. |
| Transmission Service Provider (TSP) | No TPL-001 requirement. | Supplies Firm Transmission Service and Interchange commitments (R1 Part 1.1.4); its customers are affected when Table 1 allows Firm Transmission Service interruption. |
| Transmission Operator (TOP) and Reliability Coordinator (RC) | No TPL-001 requirement. | Receive the planning results through operations planning and use the Operating Procedures that appear in CAPs. |
| Regulators and stakeholders | Not registered entities. | Must have an open stakeholder process, and in some cases must not object, before planned Non-Consequential Load Loss is used under footnote 12 (Attachment 1). |
| ERO (NERC) | Not a TPL-001 applicable entity. | Reviews footnote 12 submissions for Adverse Reliability Impacts; audits compliance through the Regional Entities. |

Figure 1. Who does what under TPL-001-5.1. Only the PC and TP carry TPL-001 obligations, but the assessment depends on data from every other functional entity, mainly through MOD-032.
Key numbers to remember
| Number | Where it appears | Meaning |
|---|---|---|
| 1–5 years | Near-Term Transmission Planning Horizon | Annual steady state, short circuit and Stability assessment required |
| 6–10 years | Long-Term Transmission Planning Horizon | Annual steady state peak study for one year; Stability only for material generation changes |
| Year One or year two, and year five | R2 Part 2.1.1 | Required steady-state peak cases |
| One of the five years | R2 Parts 2.1.2, 2.4.1, 2.4.2 | Off-peak steady state; peak and off-peak Stability |
| 1 year or more | R2 Parts 2.1.5 and 2.4.5 | Lead time that triggers the spare equipment study |
| 5 calendar years | R2 Part 2.6.1 | Maximum age of a past study without further technical rationale |
| Less than 1 second | R4 Part 4.3.1.1 | Definition of high-speed reclosing that must be simulated |
| 300 kV | Footnote 3 | Boundary between EHV (above 300 kV) and HV (300 kV and below) |
| 1 mile | Footnote 11 | Common structures and rights-of-way of 1 mile or less are excluded |
| 75 MW | Footnote 12 | Hard cap on planned Non-Consequential Load Loss for US registered entities |
| 25 MW | Attachment 1, Section III | At or above this amount, regulators must not object before footnote 12 is used in Year One |
| 90 calendar days | R8 and R8.1 | Distribute results to neighbors; respond to documented comments |
| 30 days | R8 | Respond to a written request from an entity with a reliability need |
| 3 calendar years | Evidence retention | Keep evidence for each requirement |
Seven misconceptions, fact-checked
| Common belief | What the standard actually says |
|---|---|
| "TPL-001 applies to Transmission Owners and Generator Owners." | It applies only to Planning Coordinators and Transmission Planners. TOs and GOs support it through MOD-032, MOD-026/027, FAC-008, PRC-024/029 and agreements. |
| "N-1 planning means no load can ever be dropped for a single contingency." | For P1, P2-1 and P3, Non-Consequential Load Loss is not allowed except under footnote 12, which requires the Attachment 1 stakeholder process in the Near-Term and caps the amount at 75 MW for US entities. Consequential Load Loss — load served only by the element that tripped — is always acceptable except at P0. |
| "Footnote 12 load shedding is limited to one hour." | No duration limit appears in TPL-001-5.1. Footnote 12 requires Attachment 1 conditions and the 75 MW cap; Attachment 1 asks the entity to document expected duration and frequency based on historical performance. |
| "Only three-phase faults matter for stability." | Table 1 specifies the fault type per event: 3Ø for P1, P3 and P6 element faults; SLG for P2, P4, P5, P7 and DC poles. Footnote 2 lets a 3Ø or double-line-to-ground study stand in for an SLG study if the criteria are met. |
| "A CAP is needed for every violation in every case." | CAPs are not required solely to meet performance in a single sensitivity case (R2 Part 2.7). Deficiencies that show up in multiple sensitivity studies need actions or a rationale (Part 2.7.2). Extreme events require only an evaluation of possible actions if Cascading occurs. |
| "Old studies can be reused indefinitely." | Past studies qualify only if five calendar years old or less (or older with technical rationale) and only if no material changes have occurred, with documentation (Part 2.6). |
| "Extreme events must meet the same criteria as planning events." | Extreme events have no performance criteria. If Cascading results, the PC/TP must evaluate possible actions to reduce the likelihood or mitigate the consequences (R3 Part 3.2, R4 Part 4.2). |
How the annual cycle works in practice
Although the standard does not prescribe a calendar, most US planning regions run TPL-001 on a twelve-month rhythm that looks like this:
| Phase | Typical timing | Who leads | What happens |
|---|---|---|---|
| Data request and model build | Months 1–3 | PC with TPs; data from GO, TO, DP, RP, BA, TSP | MOD-032 data collection; base cases for peak, off-peak and the long-term year |
| Criteria and assumptions | Months 2–3 | PC and TP | Confirm R5 voltage criteria, R6 instability criteria, sensitivity choices, known outages, spare equipment assumptions |
| Contingency lists | Months 3–4 | TP with PC; coordination with neighbors | R3 Part 3.4 and R4 Part 4.4 lists, including adjacent-system events |
| Steady-state and short-circuit studies | Months 4–7 | TP (local), PC (regional) | P0–P7, extreme events, breaker duty |
| Stability studies | Months 5–8 | PC or TP per R7 | P1–P7 and extreme events with dynamic load models, reclosing and relay models |
| CAP development | Months 7–10 | TP with TO; PC for regional | Projects, RAS, Operating Procedures, re-dispatch, or footnote 12 process |
| Completion and distribution | Month 10–11, then within 90 days | PC and TP | Document assumptions, results and CAPs; R8 distribution; R8.1 responses within 90 days of comments |
Part B — Technical Guide: Requirement by Requirement
This part is written for the engineers, compliance leads and managers who actually have to produce, review or rely on a Planning Assessment. Each section gives the requirement in plain English, what it means technically, who really does the work and what evidence an auditor will expect.
Vocabulary you need first
TPL-001 relies on NERC Glossary terms. Capitalized words in the standard carry the Glossary meaning, and many disputes in audits come down to these definitions. The summaries below are plain-English paraphrases; always check the current NERC Glossary for the governing text.
| Term | Plain-English meaning |
|---|---|
| Planning Assessment | The documented annual evaluation of future system performance and the Corrective Action Plans needed to meet the performance requirements |
| Near-Term Transmission Planning Horizon | Years one through five |
| Long-Term Transmission Planning Horizon | Years six through ten |
| Year One | The first year that the PC or TP is responsible for assessing in the Planning Assessment |
| Corrective Action Plan (CAP) | A list of actions and an associated timetable to correct a performance deficiency |
| Contingency | The unexpected failure or outage of a system component, such as a generator, line, breaker, switch or other element |
| Consequential Load Loss | Load that is no longer served because the element it was directly connected to was removed — for example, a radial transformer serving a substation |
| Non-Consequential Load Loss | Load lost for any other reason, including load shed by UFLS, UVLS, RAS or operator action to relieve a problem — and load that would otherwise remain connected |
| Firm Transmission Service | The highest-quality service offered for transmission, not subject to curtailment except in specified circumstances |
| Normal Clearing | A protection system operates as designed and the fault is cleared in the time normally expected |
| Delayed Fault Clearing | Fault clearing consistent with correct operation of a breaker failure protection system and its backup |
| Cascading | Uncontrolled successive loss of system elements triggered by an incident at any location, which cannot be restrained from spreading beyond a predetermined area |
| Remedial Action Scheme (RAS) | An automatic scheme designed to detect predetermined system conditions and take corrective action other than simply isolating faulted elements |
| Facility Rating / Equipment Rating | The maximum and minimum voltage, current, frequency, real and reactive power limits for a Facility or piece of equipment |
R1 — Build and maintain the System models
What the standard says. Each TP and PC must maintain System models within its area for the studies needed to complete its Planning Assessment. The models must use data consistent with MOD-032, supplemented by other sources as needed, including items represented in the Corrective Action Plan, and must represent projected System conditions. The models must represent: existing Facilities (1.1.1); new planned Facilities and changes to existing Facilities (1.1.2); real and reactive Load forecasts (1.1.3); known commitments for Firm Transmission Service and Interchange (1.1.4); and resources, supply or demand side, required for Load (1.1.5). R1 "establishes Category P0 as the normal System condition in Table 1."
Plain English. Before you can test the future grid, you need a faithful picture of it. That picture must include the grid as it is today, every project that is planned, the expected load, the deals already signed for moving power, and the generation and demand response needed to serve the load. If last year's CAP said "a new 230/115 kV transformer will be in service in year three," this year's model must include it in year three.
Who actually does the work.
- PC: Usually maintains the interconnection-wide or regional base cases, coordinates with the regional model-building process and publishes the MOD-032 data requirements and reporting procedures (jointly with its TPs).
- TP: Refines the local network, adds detailed sub-transmission where it matters, adds planned projects and CAP items, and checks local load allocation.
- GO, TO, DP, RP, BA, TSP: Supply the data under MOD-032 procedures. The PC and TP cannot model what they are not told.
Technical notes.
- "Data consistent with MOD-032" does not mean "only MOD-032 data." The words "supplemented by other sources as needed" allow interconnection queue data, utility integrated resource plans, field test results and engineering judgment — but the source and assumptions should be documented.
- "Projected System conditions" means the model is not a snapshot of today. Retirements announced by Generator Owners, load growth from new large customers such as data centers, and in-service dates of planned projects all belong in the model for the years they apply.
- Real and reactive load forecasts are explicitly required. A model that holds power factor at unity for all loads, or that ignores the reactive behavior of a large new industrial customer, fails the spirit of Part 1.1.3.
- The R1 VSL grades failures by how many of Parts 1.1.1 through 1.1.5 are missing: one part is Lower, two parts Moderate, three parts High, and four or more parts Severe. A model that does not represent projected System conditions, or does not use data consistent with MOD-032 and other sources including CAP items, is also Severe.
Evidence. Dated model files for each case, a model change log, the MOD-032 data requirements document, data submittal records, and a cross-reference showing that CAP items appear in the right study years.
R2 — The annual Planning Assessment
What the standard says. Each TP and PC must prepare an annual Planning Assessment of its portion of the BES. It must use current or qualified past studies, document assumptions and document summarized results of the steady state, short circuit and Stability analyses. R2 then sets out eight parts that determine the content of the assessment.
Plain English. Every year, write a report that says what you studied, what assumptions you used, what you found and what you are going to do about it.
Part 2.1 — Near-Term steady state
The Near-Term steady-state portion must be assessed annually and supported by current annual studies or qualified past studies. The studies must include:
- 2.1.1 System peak Load for either Year One or year two, and for year five.
- 2.1.2 System Off-Peak Load for one of the five years.
- 2.1.3 Sensitivity case(s) for each of the 2.1.1 and 2.1.2 studies, varying one or more of these conditions "by a sufficient amount to stress the System within a range of credible conditions that demonstrate a measurable change in System response": real and reactive forecasted Load; expected transfers; expected in-service dates of new or modified Transmission Facilities; reactive resource capability; generation additions, retirements or other dispatch scenarios; controllable Loads and Demand Side Management; duration or timing of known Transmission outages.
- 2.1.4 Known outages: when known outages of generation or Transmission Facilities are planned in the Near-Term, the impact of selected known outages must be assessed for P0 and P1 with the peak or off-peak conditions expected when the outages are planned. Outages are selected per a documented outage coordination procedure or technical rationale, may not be excluded solely based on outage duration, and must include at a minimum the known outages expected to produce more severe impacts. Past or current studies with comparable post-contingency conditions — such as those following P3 or P6 events — may support the selection.
- 2.1.5 Spare equipment strategy: when an entity's spare equipment strategy could result in the unavailability of major Transmission equipment with a lead time of one year or more(such as a transformer), the impact must be assessed, and P0, P1 and P2 must be analyzed for the conditions expected during that unavailability.
Plain English. At minimum you need a near-year summer (or winter) peak, a year-five peak and one light-load case. You must stress each of them in a believable way to see how sensitive the answers are. You must look at major planned maintenance outages that are already on the calendar. And if you do not keep a spare for a big transformer that takes a year or more to replace, you must study what happens while one is out.
Who does what. The TP usually builds the cases and runs the contingency analysis for its area; the PC often sets the sensitivity scenarios regionally so that neighboring TPs use consistent assumptions. Transmission Operators and Transmission Owners provide the outage plans used in Part 2.1.4. TOs provide the spare equipment strategy used in Part 2.1.5. Generator Owners and Resource Planners provide the retirement and addition information used in dispatch sensitivities.
Technical notes.
- The phrase "demonstrate a measurable change in System response" matters. A sensitivity that changes load by 0.5 percent and shows no change in results does not satisfy the intent. Auditors look for sensitivities that actually stress the system — for example, a high-load case at the 90th percentile weather forecast, a high-transfer case across a known interface, a case with a large planned project delayed by a year, or an off-peak case with high renewable output and low synchronous dispatch.
- Seasonal choice is up to the entity. Winter-peaking systems in the Pacific Northwest or the Southeast often use winter peak for 2.1.1, and many PCs now study both seasons. TPL-001 sets a floor, not a ceiling.
- The known-outage requirement responds to real events where long planned outages, combined with a single contingency, produced overloads that planners had never examined. The "not excluded solely based on duration" clause prevents an entity from ignoring a two-week outage simply because it is short.
- The spare equipment study is in effect an N-1-1 or N-1-2 study for the period a long-lead transformer is unavailable. Large autotransformers and generator step-up transformers often have manufacturing lead times well beyond a year, so this part is relevant to almost every TP.
Part 2.2 — Long-Term steady state
The Long-Term steady-state portion must be assessed annually and supported by a current study assessing expected System peak Load for one of the years in the Long-Term horizon, together with the rationale for why that year was selected. Qualified past studies may supplement it.
Plain English. Once a year, look out six to ten years at a peak case and explain why you picked that year. Year ten is common; some planners choose the year that aligns with a regional transmission plan or with the last year of a load forecast.
Part 2.3 — Short circuit
The short-circuit portion must be conducted annually for the Near-Term horizon, supported by current or qualified past studies, and used to determine whether circuit breakers have interrupting capability for Faults they will be expected to interrupt, using the short-circuit model with any planned generation and Transmission Facilities in service which could impact the study area.
Plain English. Each year, check that every breaker can still interrupt the largest fault it might see once all planned projects and generators are connected. New generators, new lines and new transformers all raise fault current; breakers bought decades ago may no longer be adequate.
Who does what. The TP (or PC per R7) runs the study. The TO supplies breaker nameplate interrupting ratings, X/R assumptions, and sometimes its own duty calculations under the applicable IEEE/ANSI breaker standards. Generator Owners supply subtransient reactances and, for inverter-based resources, fault current contribution characteristics.
Part 2.4 — Near-Term Stability
The Near-Term Stability portion must be assessed annually with:
- 2.4.1 System peak Load for one of the five years, with a Load model that represents the expected dynamic behavior of Loads that could impact the study area, considering the behavior of induction motor Loads. An aggregate System Load model representing the overall dynamic behavior of the Load is acceptable.
- 2.4.2 System Off-Peak Load for one of the five years.
- 2.4.3 Sensitivity case(s) for each, varying one or more of: Load level, Load forecast or dynamic Load model assumptions; expected transfers; expected in-service dates; reactive resource capability; generation additions, retirements or dispatch scenarios.
- 2.4.4 Known outages: as in Part 2.1.4 but assessed for P1 events.
- 2.4.5 Spare equipment strategy: for long-lead equipment (one year or more), analyze selected P1 and P2 events expected to produce more severe impacts while the equipment is unavailable.
Plain English. Run dynamic simulations — the kind that show generators swinging and voltages recovering in the seconds after a fault — for one peak and one off-peak year, with realistic load behavior, especially air conditioner and other motor loads that can stall when voltage dips.
Technical notes. The induction motor language reflects decades of experience with fault-induced delayed voltage recovery (FIDVR) in hot, air-conditioning-heavy regions of the US. Residential single-phase compressor motors can stall during a deep voltage sag and draw high reactive current until thermal protection trips them. A constant-impedance or constant-current static load model will not show this, so many US planners use composite load models with motor components. Off-peak Stability cases have become more important as inverter-based resources displace synchronous units at light load, reducing inertia and short-circuit strength.
Part 2.5 — Long-Term Stability
The Long-Term Stability portion must be assessed to address the impact of proposed material generation additions or changes in that timeframe, supported by current or qualified past studies, and must include documentation of the technical rationale for determining material changes.
Plain English. You do not have to build year-ten dynamic cases every year, but if large generation changes are expected six to ten years out — a big retirement, a wave of new solar, a new nuclear unit — you must study their stability effects and explain how you decided what counted as "material."
Part 2.6 — Using past studies
Past studies may support the assessment only if: (2.6.1) they are five calendar years old or less, unless a technical rationale shows the results of an older study are still valid; and (2.6.2) no material changes have occurred to the System represented in the study, with documentation supporting the technical rationale for determining material changes.
Plain English. You can reuse a study, but only if it is recent and nothing important has changed since. Write down why you believe nothing important has changed.
Part 2.7 — Corrective Action Plans for Table 1 planning events
When analysis shows the System cannot meet Table 1 performance requirements for planning events, the Planning Assessment must include Corrective Action Plan(s) addressing how the requirements will be met. Revisions are allowed in later assessments, but the planned System must continue to meet Table 1. CAPs do not need to be developed solely to meet performance for a single sensitivity case. The CAP must:
- 2.7.1 List System deficiencies and the associated actions needed. The standard's examples are: installation, modification, retirement or removal of Transmission and generation Facilities and associated equipment; installation, modification or removal of Protection Systems or Remedial Action Schemes; installation or modification of automatic generation tripping to mitigate Stability violations; installation or modification of manual and automatic generation runback/tripping to mitigate steady-state violations; use of Operating Procedures specifying how long they will be needed; and use of rate applications, DSM, new technologies or other initiatives.
- 2.7.2 Include actions to resolve deficiencies identified in multiple sensitivity studies or provide a rationale for why actions were not necessary.
- 2.7.3 If situations beyond the PC/TP's control prevent implementing a CAP in the required timeframe, the PC/TP may use Non-Consequential Load Loss and curtailment of Firm Transmission Service that Table 1 would not normally permit, provided it documents that it is taking actions to resolve the situation — the situation causing the problem, the alternatives evaluated and the use of load loss or curtailment.
- 2.7.4 Be reviewed in subsequent annual Planning Assessments for continued validity and implementation status.
Plain English. If something fails, say what fails and what you will do about it, by when. A one-off sensitivity failure does not automatically force a project, but repeated failures across sensitivities need a fix or an explanation. If a project is delayed by things outside your control — permitting, supply chain, litigation — you may temporarily rely on dropping load or curtailing firm service, but you must document why and what you are doing about it. And every year, check on progress.
Who does what. The TP generally develops local CAPs and the PC regional ones. The TO usually designs, permits and builds the projects. The GO may host RAS or runback schemes. The TOP and RC adopt Operating Procedures that appear in CAPs. The DP is consulted when load shedding is part of a temporary mitigation.
Part 2.8 — Corrective Action Plans for short-circuit violations
If short-circuit interrupting duty on breakers determined under Part 2.3 exceeds their Equipment Rating, the Planning Assessment must include a CAP that lists the deficiencies and actions (2.8.1) and is reviewed in later assessments (2.8.2).
Typical actions include breaker replacement, current-limiting reactors, bus splitting, sequential tripping schemes, or changing the interconnection configuration of a new generator.
R2 Violation Severity Levels
The R2 VSL is graded by which parts are missed. Missing Part 2.6 documentation is Lower; missing Part 2.3 or 2.8 is Moderate; missing one of Parts 2.1, 2.2, 2.4, 2.5 or 2.7 is High; missing two or more of Parts 2.1, 2.2, 2.4 or 2.7, or having no completed annual Planning Assessment, is Severe. Because R2 carries a High Violation Risk Factor, an R2 failure is among the most consequential findings a planning entity can face.
R3 — Steady-state studies
What the standard says. For the steady-state portion, each TP and PC must perform studies for the Near-Term and Long-Term horizons in Parts 2.1 and 2.2, based on computer simulation models using the R1 data.
- 3.1 Studies for planning events to determine whether the BES meets Table 1 performance, based on the contingency list from Part 3.4.
- 3.2 Studies for extreme events from the Part 3.5 list. If Cascading results, an evaluation of possible actions to reduce the likelihood or mitigate the consequences and adverse impacts must be conducted.
- 3.3.1 Simulate removal of all elements the Protection System and other automatic controls are expected to disconnect for each Contingency without operator intervention, including the impact of subsequent: (3.3.1.1) tripping of generators where generator bus or GSU high-side voltages are below known or assumed minimum generator steady-state or ride-through voltage limits — including assumptions in the assessment; and (3.3.1.2) tripping of Transmission elements where relay loadability limits are exceeded.
- 3.3.2 Simulate the expected automatic operation of existing and planned steady-state control devices that impact the study area, such as phase-shifting transformers, load tap changing transformers and switched capacitors and inductors.
- 3.4 Identify the planning events expected to produce more severe impacts and create the contingency list, with the rationale available as supporting information. 3.4.1 Coordinate with adjacent PCs and TPs so that contingencies on adjacent systems that may impact your system are included.
- 3.5 Identify the extreme events expected to produce more severe impacts and create a list, with rationale.
Plain English. Use a power-flow program. Knock out each item on your contingency list. Let relays and automatic devices act as they would in real life — but do not let a human operator fix anything before the post-contingency solution, except where Table 1 allows System adjustments. If a generator's terminal voltage falls below what it can tolerate, trip it. If a line's flow exceeds its relay loadability, trip it. Keep going until things settle or cascade.
Technical notes.
- "Without operator intervention" is the most commonly misunderstood phrase. Table 1 note (e) separately allows planned System adjustments — such as configuration changes and re-dispatch — if they are executable within the time duration applicable to the Facility Ratings. In practice, planners compare post-contingency flows with emergency ratings, then check whether planned adjustments can bring flows back within normal ratings in the allowed time.
- Generator voltage tripping (3.3.1.1) is especially relevant for inverter-based resources. If an IBR's protective settings trip it below a certain voltage, and a contingency depresses voltage at its point of interconnection below that level in steady state, the IBR must be tripped in the simulation. Planners need the actual or assumed settings, which come from Generator Owners via MOD-032 and are bounded by PRC-024 or PRC-029.
- Relay loadability (3.3.1.2) requires the TP to know where distance relays or overcurrent relays could trip on load. TOs supply the settings; PRC-023 sets loadability requirements for certain relays.
- The contingency list is not every possible contingency. Part 3.4 lets the entity select events "expected to produce more severe System impacts," with rationale. Many TPs nonetheless run exhaustive P1 and P2 lists automatically and use engineering screening for P4 and P5, where the combinations multiply with every breaker and protection component.
R3 VSL. Lower if the planning-event list (Part 3.4) or extreme-event list (Part 3.5) was not identified; Moderate if one category from P2 through P7 was not studied, or the extreme-event studies of Part 3.2 were not performed; High if two P2–P7 categories were missed, or the contingency analysis of Part 3.3 was not performed; Severe if three or more P2–P7 categories were missed, if P0 or P1 was not studied, or if the studies were not based on simulation models using R1 data.
R4 — Stability studies
What the standard says. For the Stability portion (Parts 2.4 and 2.5), each TP and PC must perform the contingency analyses listed in Table 1 using the R1 models.
- 4.1 Studies for planning events against Table 1, based on the Part 4.4 list. 4.1.1 For P1, no generating unit shall pull out of synchronism; a generator disconnected by fault clearing or by a RAS is not considered to have pulled out of synchronism. 4.1.2 For P2–P7, when a generator pulls out of synchronism, the resulting apparent impedance swings shall not trip any Transmission elements other than the generating unit and its directly connected Facilities. 4.1.3 For P1–P7, power oscillations shall exhibit acceptable damping as established by the PC and TP.
- 4.2 Studies for extreme events from the Part 4.5 list; if Cascading results, evaluate possible actions.
- 4.3.1 Simulate removal of all elements the Protection System and automatic controls are expected to disconnect, including subsequent: (4.3.1.1) successful high-speed (less than one second) reclosing and unsuccessful high-speed reclosing into a Fault, where high-speed reclosing is used; (4.3.1.2) tripping of generators where generator bus or GSU high-side voltages are below known or assumed low voltage ride-through capability; (4.3.1.3) tripping of Transmission lines and transformers where transient swings cause Protection System operation, based on generic or actual relay models.
- 4.3.2 Simulate the expected automatic operation of dynamic control devices — exciters and power system stabilizers, static var compensators, power flow controllers and DC Transmission controllers.
- 4.4 Contingency list for planning events with rationale; 4.4.1 coordination with adjacent PCs and TPs. 4.5 Extreme event list with rationale.
Plain English. In time-domain simulation, after any single contingency, every generator must stay in step with the grid. For more severe events, a generator may lose synchronism, but its swings must not cause relays elsewhere on the transmission system to trip lines. Oscillations must die out at a rate the planner has defined. Reclosing, ride-through limits and relays that can trip on power swings must be included.
Technical notes.
- Damping criteria are left to the PC and TP. Common US practice expresses them as a minimum damping ratio for the dominant mode or as a decay of oscillation amplitude over a set time. Whatever is chosen should be documented alongside the R5 and R6 criteria.
- Out-of-step swings. If a generator pulls out of step for a P4 stuck breaker event, the planner must check whether the swing center passes through a transmission line's distance relay zones and causes a trip. That requires relay models — generic if actual settings are unavailable.
- High-speed reclosing. Many 345 kV and 500 kV lines in the US use high-speed reclosing. Reclosing into a permanent fault exposes nearby generators to a second fault in quick succession, which can be the limiting condition for stability.
- IBR controls. Although Part 4.3.2 lists conventional devices, the plant-level and inverter-level controls of solar, wind and battery plants — reactive current injection, momentary cessation, ride-through logic, plant controllers — are "devices designed to provide dynamic control" in every practical sense and must be represented faithfully.
R4 VSL. Same structure as R3, but counted over categories P1 through P7: Lower for missing lists (Parts 4.4/4.5); Moderate for one category or missing extreme-event studies (Part 4.2); High for two categories or missing Part 4.3 analysis; Severe for three or more categories, or studies not based on R1 models.
R5 — Voltage criteria
What the standard says. Each TP and PC must have criteria for acceptable System steady-state voltage limits, post-Contingency voltage deviations and transient voltage response for its System. For transient voltage response, the criteria must at minimum specify a low voltage level and a maximum length of time that transient voltages may remain below that level.
Plain English. Write down what "acceptable voltage" means on your system — before the event, the change caused by the event, and the dip and recovery in the seconds after a fault. The transient criterion must have both a voltage threshold and a time limit.
Typical US criteria (examples, not requirements).
| Criterion | Typical form |
|---|---|
| Pre-contingency steady state | 0.95–1.05 per unit on BES buses (some systems use 0.97–1.05 at EHV or tighter limits at nuclear plant switchyards) |
| Post-contingency steady state | 0.90–1.10 per unit, or limits based on equipment and nuclear plant interface requirements |
| Post-contingency voltage deviation | A maximum change, often 5 to 10 percent, between pre- and post-contingency voltages at key buses |
| Transient voltage response | Voltage must recover above a stated level (for example 0.80 or 0.90 per unit) within a stated time after fault clearing (for example 1 to 2 seconds), and must not stay below a lower level for more than a stated duration |
Nuclear plant interface requirements under NUC-001 often set tighter voltage limits at nuclear switchyards; planners should reflect those agreements in R5 criteria.
Who does what. The PC and TP must each have criteria. In many regions, the PC publishes regional criteria and TPs adopt or tighten them. Generator Owners and TOs provide equipment limits that inform the criteria.
R5 VSL. Severe only — either the criteria exist or they do not.
R6 — Instability, Cascading and uncontrolled islanding criteria
What the standard says. Each TP and PC must define and document, within the Planning Assessment, the criteria or methodology used in the analysis to identify System instability for conditions such as Cascading, voltage instability or uncontrolled islanding.
Plain English. Write down how you decide, in your studies, that the system has "fallen over." For example: a power-flow case that fails to solve; a sequence of more than a set number of overload-driven trips; voltage collapse identified by P-V or Q-V analysis; or a dynamic simulation in which angles separate between groups of generators.
Typical methods.
- Cascading. Iteratively trip elements loaded above a stated threshold (often 115–125 percent of emergency rating, or the relay loadability limit) and generators below voltage limits; declare Cascading if tripping spreads beyond a predetermined area or the case diverges.
- Voltage instability. Use P-V curves with a minimum MW margin to the nose point, or Q-V curves with a minimum reactive margin; treat non-convergence as a flag that requires further investigation, not automatically as proof of collapse.
- Uncontrolled islanding. Detect separation of the network into islands that were not designed to form, using connectivity checks in steady state and angle separation in dynamics.
R6 VSL. Severe only.
R7 — Who studies what between the PC and its TPs
What the standard says. Each PC, in conjunction with each of its TPs, must determine and identify each entity's individual and joint responsibilities for performing the required studies for the Planning Assessment. Evidence may include meeting minutes, agreements and email correspondence showing that agreement was reached.
Plain English. The PC and TPs must agree, in writing, on who does which part of the work. Because both the PC and the TP are responsible for every requirement, this agreement is what prevents both duplicate work and gaps.
Common splits in US practice.
| Study element | Typically led by | Notes |
|---|---|---|
| Regional base cases | PC | Often through an interconnection-wide model-building process |
| Local steady-state P0–P7 | TP | PC may screen regional events |
| Short circuit | TP | TO may perform duty calculations |
| Stability (Near-Term and Long-Term) | PC or TP | Many PCs run regional stability; TPs run local events |
| Extreme events | PC and TP jointly | Wide-area events usually PC-led |
| CAP development | TP for local, PC for regional | Regional CAPs may enter a regional transmission plan |
| R8 distribution | Each entity | Joint postings are common |
R7 VSL. Severe only. R7 has a Low VRF, but if the R7 agreement is missing, the R2–R4 findings that follow can be serious.
R8 — Share the results and answer comments
What the standard says. Each PC and TP must distribute its Planning Assessment results to adjacent PCs and adjacent TPs within 90 calendar days of completing the assessment, and to any functional entity that has a reliability-related need and submits a written request within 30 days of such a request. 8.1: if a recipient provides documented comments, the PC or TP must provide a documented response within 90 calendar days of receipt.
Plain English. Your neighbors need to know what you found, because your problems can be theirs. Send your results, and answer questions in writing.
R8 VSL. Graded by lateness: for neighbors, more than 90 but no more than 120 days is Lower, 120–130 days Moderate, 130–140 days High and more than 140 days Severe. For written requests, more than 30 but no more than 40 days is Lower, 40–50 days Moderate, 50–60 days High and more than 60 days Severe. Not distributing at all to neighbors, or to a requester, is Severe. The VSL table does not separately grade Part 8.1, but the 90-day comment response is still a requirement and should be tracked with the same discipline.
Evidence. Email notices, documentation of web postings, postal receipts showing recipient and date, or a demonstration of a public posting.
Requirement summary: risk, horizon and VSL
| Req. | Subject | VRF | VSL structure |
|---|---|---|---|
| R1 | Models | High | By number of Parts 1.1.1–1.1.5 missing |
| R2 | Annual Planning Assessment and CAPs | High | By which parts are missing (2.6 Lower; 2.3/2.8 Moderate; one of 2.1/2.2/2.4/2.5/2.7 High; two or more of 2.1/2.2/2.4/2.7, or no assessment, Severe) |
| R3 | Steady-state studies | Medium | Lists missing (Lower); by number of P2–P7 categories missed; P0/P1 missing or no R1-based models Severe |
| R4 | Stability studies | Medium | Lists missing (Lower); by number of P1–P7 categories missed; no R1-based models Severe |
| R5 | Voltage criteria | Medium | Severe only |
| R6 | Instability criteria | Medium | Severe only |
| R7 | PC–TP responsibilities | Low | Severe only |
| R8 | Distribution and comments | Medium | By days late |
All eight requirements carry the Long-term Planning time horizon.
Table 1 explained: the performance rules
Table 1 is where TPL-001 turns into engineering. It lists the events the planner must simulate and, for each one, what is allowed to happen. Before walking through the events, it helps to understand the general notes that apply to all of them.
General notes that apply to every planning event
| Note | Applies to | Plain-English meaning |
|---|---|---|
| a | Steady state and Stability | The System must remain stable. Cascading and uncontrolled islanding must not occur. |
| b | Steady state and Stability | Consequential Load Loss and generation loss are acceptable for any event except P0. |
| c | Steady state and Stability | Simulate removal of everything protection and other controls are expected to disconnect. |
| d | Steady state and Stability | Simulate Normal Clearing unless the event says otherwise. |
| e | Steady state and Stability | Planned System adjustments — configuration changes, generation re-dispatch — are allowed if they can be executed within the time duration applicable to the Facility Ratings. |
| f | Steady state only | Applicable Facility Ratings shall not be exceeded. |
| g | Steady state only | Steady-state voltages and post-contingency voltage deviations must be within the PC/TP's limits (R5). |
| h | Steady state only | P0 applies to steady state only. |
| i | Steady state only | Voltage-sensitive load that end-user equipment disconnects during an event cannot be counted on to meet steady-state performance. |
| j | Stability only | Transient voltage response must be within the PC/TP's limits (R5). |
In plain terms: for every event, the system has to stay in one piece. Equipment must stay within its ratings and voltages within the planner's limits. Losing load that was hanging directly off the failed equipment is fine; dropping other customers is restricted, depending on how severe the event is.
Note (e) and emergency ratings. Most US Transmission Owners publish normal and one or more emergency ratings — for example, a four-hour or 30-minute emergency rating for a line or transformer. Under note (e), the planner may compare immediate post-contingency flows with the emergency rating and then apply planned adjustments — such as a phase-shifter change, opening a bus tie or re-dispatching generators — provided they can be completed before the emergency rating's time limit expires. After the adjustments, flows must be within the rating that applies for the remaining duration. Documenting the adjustment, who performs it and how long it takes is essential evidence.
Note (i) and load that trips itself. If a contingency depresses voltage enough that some customer equipment — variable-speed drives, contactors, data center UPS transfer schemes — drops off, the planner cannot count that reduction as helping the system meet performance. The trend toward very large electronic loads, including data centers that may transfer to on-site backup on voltage disturbances, makes this note more important than when it was written.
The two columns that matter most to customers
Each planning event carries two "allowed" columns:
- Interruption of Firm Transmission Service Allowed. Can the planner rely on curtailing firm transmission service to meet performance?
- Non-Consequential Load Loss Allowed. Can the planner rely on dropping customers who were not directly connected to the failed element?

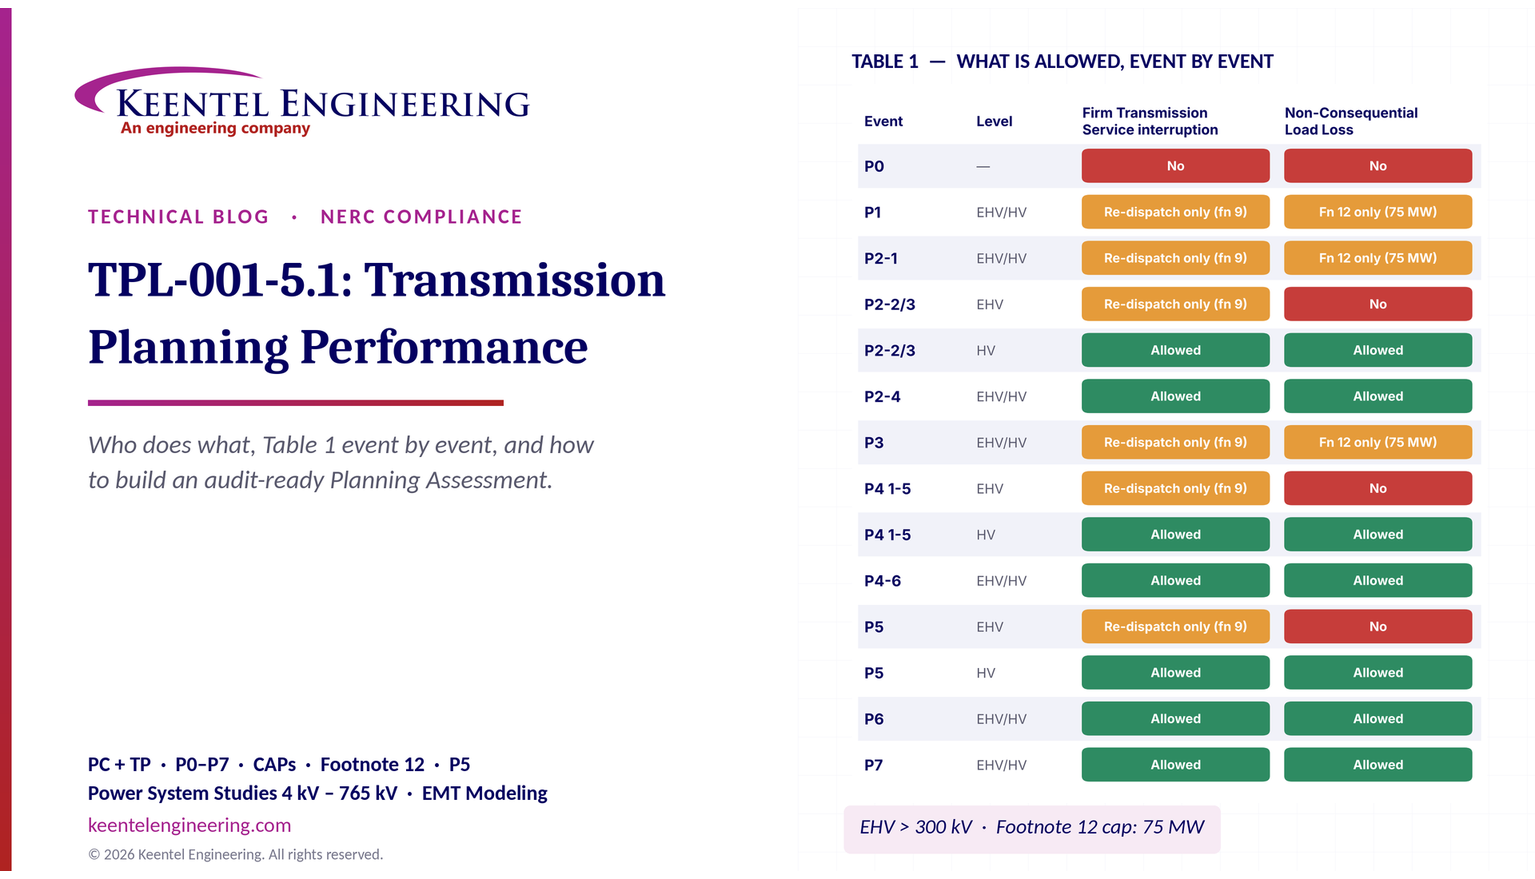
Figure 2. Table 1 planning events and when Firm Transmission Service interruption and Non-Consequential Load Loss are allowed. Orange cells are "No" with the footnote 9 (re-dispatch) or footnote 12 (planned load loss under Attachment 1, capped at 75 MW) exceptions.
The answers depend on the event and on the BES voltage level. Footnote 3 draws the line: EHV is above 300 kV(in US practice, 345 kV, 500 kV and 765 kV) and HV is 300 kV and below(for example, 230 kV, 161 kV, 138 kV, 115 kV and 69 kV where it is part of the BES). Footnote 1 says that if an event removes elements at more than one voltage level, the lowest voltage level of the removed elements determines the allowances. Footnote 5 says that for a non-GSU transformer, the reference voltage is the low-side winding (excluding tertiaries); for a generator or GSU outage it is the high side(the BES-connected voltage).
Worked illustration of footnotes 1 and 5. A 345/138 kV autotransformer outage is classified at 138 kV — HV — because the low side governs. A breaker failure at a 345 kV substation that removes a 345 kV line and a 345/138 kV transformer is also classified as HV, because 138 kV is the lowest voltage removed. A 500 kV-connected generator step-up transformer outage is classified at 500 kV — EHV.
P0 — No contingency
Initial condition: normal System. Event: none. Allowed: no Firm Transmission Service interruption, no Non-Consequential Load Loss — and, by note (b), not even Consequential Load Loss or generation loss.
Plain English. With everything in service, the system must serve all load within normal ratings and voltage limits. P0 is steady state only (note h).
US example. A summer peak case for a Midwestern 345/138 kV system shows a 138 kV line at 104 percent of its normal rating with everything in service. That is a P0 violation and requires a CAP — commonly a reconductor, a new line, or an operating guide that reconfigures the system, with the duration stated.
P1 — Single contingency
Initial condition: normal System. Event: loss of one generator, Transmission circuit, transformer, or shunt device (3Ø fault for Stability), or one pole of a DC line (SLG). Allowed: Firm Transmission Service interruption No(except footnote 9 re-dispatch); Non-Consequential Load Loss No(except under footnote 12).
Plain English. This is classic N-1. Lose any one element; no non-radial customers may be dropped, and firm transmission service may only be "curtailed" by re-dispatching resources obligated to re-dispatch.
US example. Loss of a 230 kV line in the Southeast overloads a parallel 115 kV path to 112 percent of its emergency rating. Because no planned adjustment can relieve it within the emergency rating's time limit, a CAP is needed: options include rebuilding the 115 kV line, adding a series reactor, or a new 230/115 kV transformer at the load end.
Stability note. For P1, no generator may lose synchronism (R4 Part 4.1.1). A generator tripped by fault clearing — for example, a unit whose only outlet is the faulted line — or by a RAS does not count as pulling out of step.
P2 — Single events that are not simple outages
P2 covers four distinct single events. All start from the normal System.
| Sub-event | Description | Fault | EHV allowances (FTS / NCLL) | HV allowances (FTS / NCLL) |
|---|---|---|---|---|
| P2-1 | Opening of a line section without a fault (footnote 7) | N/A | No (fn 9) / No (fn 12) | No (fn 9) / No (fn 12) |
| P2-2 | Bus section fault | SLG | No (fn 9) / No | Yes / Yes |
| P2-3 | Internal breaker fault, non-bus-tie breaker (footnote 8) | SLG | No (fn 9) / No | Yes / Yes |
| P2-4 | Internal breaker fault, bus-tie breaker | SLG | Yes / Yes | Yes / Yes |
P2-1 in plain English. Footnote 7 describes it: opening one end of a networked line section without a fault, so the line may be left serving load radially from a single source. Think of a 115 kV line that trips open at one end because of a false trip or a breaker mis-operation — the load tapped along the line is now fed from one direction only.
P2-2 and P2-3 in plain English. A fault on a bus section, or a breaker that fails internally (footnote 8: creating a fault that must be cleared by protection on both sides of the breaker), removes everything connected to that bus section or both sides of the breaker. At EHV no non-consequential load loss is permitted; at HV it is.
P2-4. A bus-tie breaker that fails internally takes out both buses it ties together. Load loss and firm service interruption are allowed at both EHV and HV.
Substation configuration matters. In a breaker-and-a-half or double-breaker double-bus scheme, a bus fault removes the bus but no lines; in a single-bus or main-and-transfer arrangement, a bus fault removes everything on that bus. That is why many US TOs have converted older straight-bus 115 kV and 138 kV stations to ring or breaker-and-a-half arrangements as CAPs.
P3 — Generator out, then a single contingency
Initial condition: loss of a generator unit followed by System adjustments(footnote 9 re-dispatch). Event: loss of another generator, Transmission circuit, transformer, shunt device (3Ø) or single DC pole (SLG). Allowed: FTS No(fn 9); NCLL No(fn 12).
Plain English. Generators are out of service often — for forced outages and maintenance. P3 asks whether, after the largest or most critical unit is off-line and the system has been re-dispatched, the system can still survive one more single contingency with the same strict allowances as P1.
US example. In a load pocket served by two 138 kV lines and one local combined-cycle plant, the plant's steam turbine is out (P3 initial condition). After re-dispatch from outside the pocket, loss of either 138 kV line overloads the other. The CAP could be a third 138 kV line, a 230/138 kV transformer inside the pocket, or a battery storage project sized to cover the deficit.
P4 — Fault plus stuck breaker
Initial condition: normal System. Event: loss of multiple elements caused by a stuck breaker(non-bus-tie) attempting to clear an SLG fault on a generator, Transmission circuit, transformer, shunt device or bus section (P4-1 to P4-5); or a stuck bus-tie breaker attempting to clear a fault on the associated bus (P4-6). Allowed: for P4-1 to P4-5, EHV No(fn 9) / No, HV Yes / Yes; for P4-6, Yes / Yes at both levels.
Footnote 10 defines "stuck": for a gang-operated breaker, all three phases stay closed; for an independent-pole-operated (IPO) or independent-pole-tripping (IPT) breaker, only one pole is assumed to stay closed. A stuck breaker results in Delayed Fault Clearing — breaker failure protection operates, tripping all breakers around the stuck one after the breaker failure timer expires.
Plain English. A fault occurs and one breaker that should open does not. Backup protection then opens every breaker around it, taking out more elements than the original fault would have, and the fault lasts longer.
Technical notes.
- The elements removed depend entirely on station layout. In a breaker-and-a-half scheme, a stuck middle breaker removes both elements in that bay; a stuck bus-side breaker removes the faulted element plus the bus.
- For Stability, the longer clearing time matters as much as the extra elements removed. Typical breaker failure clearing times at EHV range from roughly 9 to 15 cycles total, compared with 3 to 5 cycles for Normal Clearing. Many generators that ride through a 4-cycle fault cannot ride through a 12-cycle fault.
- IPO and IPT breakers are a common CAP for P4 stability problems, because with only one pole stuck, the fault on the other two phases clears normally and the system sees a much less severe disturbance.
P5 — Fault plus non-redundant protection failure
Initial condition: normal System. Event: Delayed Fault Clearing due to the failure of a non-redundant component of a Protection System protecting the faulted element to operate as designed, for a generator, Transmission circuit, transformer, shunt device or bus section (SLG fault). Allowed: EHV No(fn 9) / No; HV Yes / Yes.
Footnote 13 — the "single point of failure" list. Non-redundant components to consider are:
- (a) a single protective relay that responds to electrical quantities, without an alternative (which may or may not respond to electrical quantities) that provides comparable Normal Clearing times;
- (b) a single communications system associated with protective functions, necessary for correct operation of a communication-aided scheme required for Normal Clearing — except a single communications system that is both monitored and reported at a Control Center;
- (c) a single station DC supply associated with protective functions required for Normal Clearing — except one that is both monitored and reported at a Control Center for both low voltage and open circuit;
- (d) a single control circuitry (including auxiliary and lockout relays) from the DC supply through and including the trip coil(s), required for Normal Clearing — the trip coil may be excluded if it is both monitored and reported at a Control Center.
Plain English. If one relay, one communication channel, one battery or one trip circuit fails and there is no backup that clears the fault just as fast, the fault will be cleared later — by remote backup zones or by breaker failure — and more equipment will trip. P5 asks the planner to simulate that. TPL-001-5 expanded P5 to address FERC's concerns about these single points of failure, which is why the transition to version 5 and 5.1 required close cooperation between planners and protection engineers.
Who does what for P5. This is where TPL-001's "who does what" becomes a three-way conversation:
- The TO's protection engineers(and GOs for generator protection) know which stations have dual relays, dual batteries, monitored DC systems and redundant communications. They must provide that information.
- The TP must turn that information into contingency definitions — which elements trip and with what clearing time when, for example, a single station battery fails.
- The PC checks wide-area effects and ensures consistency across TPs.
Common P5 outcomes.
| Station design | What a P5 simulation looks like |
|---|---|
| Fully redundant relays, monitored DC, monitored communications, dual trip coils | Normal Clearing continues to apply; P5 may be no worse than P1 |
| Single unmonitored station battery | All local protection fails; remote-end zone 2/zone 3 or remote breaker failure clears the fault with long delay; many elements trip |
| Single relay without comparable alternative | Remote backup clears; the faulted element and adjacent elements may be lost |
| Single unmonitored communications channel for a pilot scheme | Fault cleared in time-delayed zone 2 at the remote end; longer clearing, fewer extra elements |
CAPs for P5 deficiencies are often protection upgrades — adding a second relay, installing battery monitoring reported to the Control Center, adding redundant communications — rather than new transmission lines. That is an example of the CAP list in Part 2.7.1 ("installation, modification, or removal of Protection Systems") at work.
P6 — Two overlapping single contingencies
Initial condition: loss of a Transmission circuit, transformer, shunt device or single DC pole, followed by System adjustments(fn 9). Event: loss of another of those elements (3Ø, or SLG for a DC pole). Allowed: FTS Yes; NCLL Yes, at both EHV and HV.
Plain English. One line is out, operators re-dispatch and reconfigure, and then another one fails. This is N-1-1. Because it is a double event, load shedding and firm service interruption are allowed — but the system must still remain stable, without Cascading or uncontrolled islanding, and within Facility Ratings and voltage limits after the allowed actions.
Technical notes. Generators are not in the P6 initial-condition list; generator-out cases are P3. Many US planners meet P6 by documenting an operating procedure — for example, "after the first outage, re-dispatch units A and B and, if the second outage occurs, shed up to X MW of load at substation Y." The performance requirements still apply after those actions, and the amount of load shed should be documented.
P7 — Common structure and bipolar DC
Initial condition: normal System. Event: loss of any two adjacent (vertically or horizontally) circuits on a common structure, or loss of a bipolar DC line(SLG). Allowed: FTS Yes; NCLL Yes.
Footnote 11 excludes circuits sharing a common structure for 1 mile or less. So two 230 kV circuits on double-circuit towers for 0.8 miles out of a substation are not a P7 event, but the same circuits sharing towers for 15 miles are.
US example. Two 345 kV circuits on double-circuit lattice towers carry the output of a large generating hub to a load center. A lightning-caused flashover or a tower failure can take both out together. The P7 study often reveals stability limits, leading to RAS that trips generation for the double-circuit loss.
Fault types (footnote 2)
Table 1 states the fault type for each event: 3Ø for P1, P3 and P6 element losses; SLG for DC poles and for P2, P4, P5 and P7 events. Footnote 2 adds that "a 3Ø or a double line to ground fault study indicating the criteria are being met is sufficient evidence that a SLG condition would also meet the criteria." That is why many planners simply run 3Ø faults for everything: if the more severe fault passes, the SLG case need not be run separately. If the 3Ø version fails, the SLG case must be studied properly before concluding there is a violation.
Firm Transmission Service and footnote 9
Footnote 9 says that the planning process should minimize the likelihood and magnitude of Firm Transmission Service interruption. Curtailment of Firm Transmission Service is allowed both as a System adjustment and as a corrective action when achieved through the appropriate re-dispatch of resources obligated to re-dispatch, where it can be demonstrated that Facilities inside and outside the TP's planning region remain within applicable Facility Ratings and the re-dispatch does not result in any Non-Consequential Load Loss. Where limited options for re-dispatch exist, sensitivities on the availability of those resources should be considered.
Footnote 4 separately allows curtailment of Conditional Firm Transmission Service when the conditions or events studied formed the basis for that conditional service.
Plain English. You can only "curtail" firm service in a P1-type event by moving generation around, using generators that are contractually or tariff-obligated to do so — and you must show the move does not just push the problem onto a neighbor.
Non-Consequential Load Loss, footnote 12 and Attachment 1
This is the most debated part of TPL-001, so the details are worth stating exactly.
Footnote 12 says that an objective of planning is to minimize the likelihood and magnitude of Non-Consequential Load Loss following planning events. In limited circumstances, it may be needed throughout the planning horizon to meet BES performance requirements. When it is used under footnote 12 within the Near-Term horizon, it is limited to circumstances meeting the conditions of Attachment 1, and "in no case can the planned Non-Consequential Load Loss under footnote 12 exceed 75 MW for US registered entities." For non-US entities, the amount should be set consistent with, or under the direction of, the applicable governmental authority.
Footnote 12 applies to the events where NCLL is otherwise "No" with the footnote marker: P1, P2-1 and P3.
Attachment 1, Section I — the stakeholder process. Before footnote 12 load loss can be part of a CAP in the Near-Term horizon, the TP or PC must ensure its use is reviewed through an open and transparent stakeholder process, existing or new, that includes:
- meetings open to affected stakeholders, including applicable regulatory authorities or governing bodies responsible for retail electric service;
- advance notice with an agenda showing the date, time and location, the specific location(s) of the planned load loss, and a stakeholder comment period;
- information on the purpose and scope of the proposed load loss (Section II);
- a procedure for written questions and written responses;
- a dispute resolution process for unresolved concerns.
The process need not be repeated for a specific application in later assessments unless the Section II conditions materially change.
Attachment 1, Section II — what must be documented.
| Item | Content |
|---|---|
| II.1 | Conditions requiring the load loss: System Load level and estimated annual hours of exposure at or above that level; applicable Contingencies and the Facilities outside their rating |
| II.2 | Amount of load loss: estimated number and type of customers affected; effect on the health, safety and welfare of the community |
| II.3 | Estimated frequency, based on historical performance |
| II.4 | Expected duration, based on historical performance |
| II.5 | Future plans to alleviate the need |
| II.6 | Verification that TPL performance requirements will be met after applying footnote 12 |
| II.7 | Alternatives considered and why they were not selected |
| II.8 | Assessment of potential overlapping uses of footnote 12, including with adjacent TPs and PCs |
Attachment 1, Section III — regulatory review for Year One. Before footnote 12 load loss is allowed as a CAP element in Year One, the TP or PC must ensure that the applicable regulatory authorities or governing bodies responsible for retail electric service do not object if either: (1) the voltage level of the Contingency is greater than 300 kV(with the same lowest-voltage and transformer low-side/high-side rules as footnotes 1 and 5), or (2) the planned load loss is 25 MW or more. Once that assurance is received, the TP or PC must submit items II.1 through II.8 to the ERO for a determination of whether there are any Adverse Reliability Impacts.
In plain terms: dropping customers on purpose after a single contingency is the last resort. To plan on it in the next five years, you have to explain it publicly, answer questions in writing, keep it under 75 MW, and — for Year One — if it is 25 MW or more or involves an EHV contingency, get the regulators' non-objection and send the package to NERC.
Extreme events
Table 1 also lists extreme events. They have no pass/fail criteria; instead, R3 Part 3.2 and R4 Part 4.2 require that if they cause Cascading, the PC/TP evaluates possible actions to reduce the likelihood or mitigate the consequences. For all extreme events, simulate removal of what protection and automatic controls disconnect, with Normal Clearing unless specified.
| Steady-state extreme events | Stability extreme events |
|---|---|
| 1. Loss of a generator, circuit, DC pole, shunt or transformer, followed by another such element, prior to System adjustments (N-1-1 with no re-dispatch) | 1. With one generator, circuit, DC pole, shunt or transformer out, a 3Ø fault on another such element prior to System adjustments |
| 2. Local area events: (a) tower line with three or more circuits (fn 11); (b) all lines on a common right-of-way (fn 11); (c) a switching station or substation — one voltage level plus transformers; (d) all units at a generating station; (e) a large Load or major Load center | 2. Local or wide-area events: 3Ø faults with a stuck breaker on a generator, circuit, transformer or bus section (a–d); 3Ø faults with failure of a non-redundant protection component on a generator, circuit, transformer or bus section (e–h); 3Ø internal breaker fault (i); other events based on operating experience (j) |
| 3. Wide-area events: (a) loss of two generating stations from conditions such as loss of a large gas pipeline into a region with significant gas-fired generation, loss of a large cooling-water source, wildfires, severe weather such as hurricanes and tornadoes, a successful cyber attack, or shutdown of nuclear plants for a day or more for common causes; (b) other events based on operating experience | — |
Plain English. Extreme events are the "what if the worst happens" list — a whole substation lost, a gas pipeline rupture taking out two plants, a hurricane. You must look at them, and if they cascade, think seriously about what could reduce the risk. You are not required to build your way out of every extreme event.
Practical US examples. The 2021 winter event in Texas and the South Central US, Winter Storm Elliott in December 2022, and recurring Western wildfire de-energizations all fit the wide-area extreme-event pattern of common-cause generation loss. Many PCs now use the gas pipeline and severe weather items to study the simultaneous loss of several gas-fired plants, which also connects to the newer extreme temperature planning standard discussed later.
Stuck breakers with 3Ø faults. Note the difference between planning event P4 (SLG fault with a stuck breaker) and extreme stability event 2a–2d (3Ø fault with a stuck breaker). The 3Ø version is far more severe and is treated as an extreme event — studied, but without mandatory performance criteria.
Building the cases: what goes into a TPL-001 study
The quality of a Planning Assessment is set long before the first contingency is run. This section explains how the cases are built and who supplies each ingredient.
The case matrix
A typical annual TPL-001 case set for a mid-sized US TP looks like this:
| Case | Horizon | Study types | Required by |
|---|---|---|---|
| Year 2 summer peak | Near-Term | Steady state, Stability, short circuit | R2 Parts 2.1.1, 2.4.1, 2.3 |
| Year 5 summer peak | Near-Term | Steady state | R2 Part 2.1.1 |
| Year 2 or 5 winter peak (if winter-critical) | Near-Term | Steady state | Good practice; required where winter governs |
| Year 3 off-peak (light load, high renewables) | Near-Term | Steady state, Stability | R2 Parts 2.1.2, 2.4.2 |
| Sensitivities on each of the above | Near-Term | Steady state, Stability | R2 Parts 2.1.3, 2.4.3 |
| Known outage cases | Near-Term | Steady state (P0, P1), Stability (P1) | R2 Parts 2.1.4, 2.4.4 |
| Spare equipment cases | Near-Term | Steady state (P0–P2), Stability (selected P1, P2) | R2 Parts 2.1.5, 2.4.5 |
| Year 10 summer peak | Long-Term | Steady state | R2 Part 2.2 |
| Long-Term Stability (if material generation changes) | Long-Term | Stability | R2 Part 2.5 |
Ingredients and their sources
| Ingredient | Source entity | Standard or vehicle |
|---|---|---|
| Line impedances, ratings, transformer data | TO | MOD-032; FAC-008 for ratings |
| Generator steady-state data and dynamic models | GO | MOD-032; verified models under MOD-026 (controls) and MOD-027 (real power/frequency) in effect for the entity |
| Ride-through settings | GO | PRC-024 for frequency and voltage protection settings; PRC-029 for IBR ride-through |
| Load forecasts (real and reactive) | DP, load-serving entities, RP | MOD-032; regional forecasting processes |
| Load composition for dynamic load models | DP, PC research | MOD-032; load model studies |
| UFLS and UVLS data | DP, TO | PRC-006 (UFLS); PRC-010 (UVLS) |
| Planned generation and retirements | RP, GO, interconnection queue | MOD-032; FAC-002 interconnection studies |
| Firm Transmission Service and Interchange | TSP, BA | MOD-032; transmission service reservations |
| Relay loadability and swing relay models | TO, GO | Settings data; PRC-023, PRC-026 |
| Protection system redundancy (for P5) | TO, GO | Protection records |
| Model validation against events | PC | MOD-033 |
| CAP projects from prior assessments | TP, PC | Previous Planning Assessments |
Dispatch: the hardest assumption
The load forecast is set by others; the dispatch is the planner's choice, and it drives results. US practice usually follows a defined method:
- Peak cases: dispatch by merit order or by a market-based method from the RTO, with renewable output set to a stated percentile of historical peak-hour output.
- Off-peak cases: high renewable output, low synchronous dispatch, many units off-line — conditions that stress voltage control and stability.
- Stress or "deliverability" style dispatches: generators near a constraint set high to test the transmission's ability to deliver.
The assessment must document the dispatch, because Part 2.1.3 sensitivities include "generation additions, retirements, or other dispatch scenarios." Whatever method is used, consistency with neighbors (R3 Part 3.4.1, R4 Part 4.4.1) is essential.
The inverter-based resource era: new challenges inside an old standard
TPL-001-5.1's text was written largely before solar, wind and battery storage became the majority of new US interconnection requests. It still applies fully to them, and several requirements bite harder in a high-IBR system.
Ride-through and voltage tripping (R3 Part 3.3.1.1, R4 Part 4.3.1.2)
Both requirements require simulating generator tripping when voltages fall below known or assumed limits. For synchronous units, these limits are usually wide. For IBRs, legacy settings, momentary cessation and plant-level protection have caused large unexpected losses of generation in real events. The planner must therefore know — or document assumptions about — each IBR's ride-through settings and behavior. That information comes from Generator Owners through MOD-032 data and is constrained by PRC-024 and, for IBRs, PRC-029.
Models that match the equipment
A TPL-001 stability study is only as good as the dynamic models. Generic positive-sequence IBR models may not reproduce plant-specific behavior, particularly in weak-grid conditions. Many US PCs now require model quality tests, MOD-026 verification of plant controls and, for weak areas, electromagnetic transient (EMT) studies alongside the positive-sequence analysis. TPL-001 itself does not mandate EMT simulation, but R6's requirement to define a method for identifying instability, and R4's requirement to simulate dynamic controls, leave room — and in practice create pressure — for EMT screening where short-circuit ratios are low.
Off-peak and low-inertia conditions
Part 2.4.2 requires an off-peak Stability case. In a high-IBR region, the off-peak case often has the fewest synchronous machines on line, the lowest short-circuit strength and the highest IBR output — exactly the conditions where control interactions, voltage oscillations and frequency issues show up. Planners increasingly add sensitivities on synchronous unit commitment (a "generation dispatch scenario" under Part 2.4.3).
Short-circuit studies with IBRs
IBRs contribute limited, controlled fault current — often around 1.0 to 1.5 times rated current — and their negative-sequence behavior depends on the control design. The R2 Part 2.3 breaker duty check is usually not driven by IBRs, but the loss of synchronous generation (retirements) reduces fault levels, which can affect protection performance even as it relieves breaker duty. Planners should keep this in mind when studying P5 protection-failure events.
Large loads
Data centers, crypto-mining facilities, hydrogen electrolyzers and large battery-charging loads are changing load forecasts and load behavior. A 300 MW data center campus that rides through some faults but transfers to backup on others is a voltage-sensitive load for note (i) purposes. Large loads also affect R1 Part 1.1.3 (real and reactive load forecasts) and R2 Part 2.4.1 (dynamic load models). Recent NERC activity on large loads suggests more specific guidance may follow; for now, TPL-001 requires realistic representation through existing language.
Corrective Action Plans in depth
What makes a good CAP
A CAP is a list of actions and an associated timetable. Under R2 Part 2.7, auditors and stakeholders look for five qualities:
| Quality | What it means | Evidence |
|---|---|---|
| Specific | Names the deficiency (element, contingency, case, magnitude) and the action | CAP table linking each violation to an action |
| Timely | In-service date aligned with the year the deficiency appears | Schedule compared with the study year of first violation |
| Effective | Studies show the System meets Table 1 with the action in place | Re-run cases with the CAP modeled |
| Tracked | Reviewed every year for validity and status (Part 2.7.4) | Status column updated in each assessment |
| Honest about interim risk | If the project slips, interim measures are documented (Part 2.7.3) | Operating Procedures with stated duration; footnote 12 process if load loss is used |
Types of corrective actions, with typical US uses
| Action type (Part 2.7.1) | Typical US uses | Cautions |
|---|---|---|
| New or modified Transmission Facilities | New 345 kV or 230 kV line, reconductor, new autotransformer, capacitor bank, STATCOM, series reactor | Long lead times; permitting; interconnection with regional planning and cost allocation |
| Generation Facilities | Retain a unit, add a synchronous condenser, convert a retiring unit | Requires GO agreement; may involve reliability-must-run arrangements |
| Protection Systems or RAS | Redundant relays for P5, IPO breakers for P4, RAS for P7 | RAS adds complexity; must meet PRC-012 |
| Automatic generation tripping (Stability) | Trip generators for a double-circuit loss | Must be coordinated with GO and RC |
| Generation runback/tripping (steady state) | Runback wind or solar output after a line loss | Must avoid NCLL and respect footnote 9 |
| Operating Procedures | Post-contingency switching, pre-contingency re-dispatch | Must state how long they will be needed |
| Rate applications, DSM, new technologies | Demand response, storage, dynamic line ratings, advanced power flow control | Firmness and availability must be shown |
The operating procedure trap
Operating Procedures are a valid CAP element, but Part 2.7.1 requires that they specify how long they will be needed. A permanent "operating guide" with no end date and no long-term solution behind it is one of the most common weaknesses found in audits and stakeholder reviews. If the procedure is meant to be permanent, the assessment should explain why it is an acceptable long-term solution and confirm it meets Table 1 — including that it does not rely on Non-Consequential Load Loss where that is not allowed.
Part 2.7.3 — when things go wrong outside your control
Transmission projects slip. Transformers arrive late, a state siting board takes longer than expected, or right-of-way litigation delays construction. Part 2.7.3 allows the PC/TP to use Non-Consequential Load Loss and Firm Transmission Service curtailment that Table 1 would not normally allow, only when the situation is beyond its control and only if it documents three things: the situation causing the problem, the alternatives evaluated, and the use of load loss or curtailment — while showing it is acting to resolve the situation. This is a bridge, not a destination.
CAPs and regional planning
Under FERC Order No. 1000 and, more recently, FERC Order No. 1920 (long-term regional transmission planning), US regions run planning processes that select and allocate costs for regional transmission projects. TPL-001 CAPs are a major input: many "reliability projects" in RTO regional plans are CAPs from TPL-001 assessments. Order No. 1920 adds long-term scenario planning over a 20-year horizon, which is far longer than TPL-001's ten years and not a NERC compliance obligation. The two processes are related but legally distinct — a TPL-001 CAP must meet the NERC standard regardless of how it is selected or paid for in a tariff process.
Short-circuit duty in depth
The principle
For each breaker, the planner compares the fault current it may be required to interrupt with its interrupting rating. Using a simple ratio:

If the duty ratio exceeds 100 percent, Part 2.8 requires a CAP. Many TOs set screening thresholds below 100 percent — for example, flagging breakers above 90 or 95 percent for more detailed calculation — because simplified short-circuit models can understate duty.
What the model must include
Part 2.3 says the study must use the short-circuit model "with any planned generation and Transmission Facilities in service which could impact the study area." In practice:
- all generators in service, including planned ones in the Near-Term horizon;
- all planned lines and transformers in service;
- normally open ties studied closed if they can be closed in operation;
- appropriate source impedances for neighboring systems;
- X/R ratios at each fault location, since asymmetrical duty depends on them.
Who does what
The TP or PC runs the system study. The TO is usually responsible for comparing duty against the breaker's actual rating — including adjustments for X/R ratio, reclosing duty and breaker age — under the applicable IEEE/ANSI breaker standards. Close coordination is essential: a TP that reports "fault current 38 kA at Bus X" is only halfway there; the TO must confirm what the 40 kA breaker can actually interrupt at that X/R and reclosing duty.
Worked examples
The following examples are simplified for teaching. Real assessments use full network models, but the logic is the same.
Example 1: a P1 overload and its CAP
A 138 kV line A–B has a normal rating of 240 MVA and a four-hour emergency rating of 287 MVA. In the year-two summer peak case, loss of parallel 230 kV line C–D (a P1 event) pushes flow on A–B to 301 MVA.

The flow exceeds the emergency rating immediately, so note (e) planned adjustments cannot help unless they act instantly. P1 allows no Non-Consequential Load Loss (except footnote 12) and no Firm Transmission Service interruption (except footnote 9 re-dispatch).
Option 1 — re-dispatch. Two generators on the A side are obligated to re-dispatch. The distribution factor of each generator on line A–B, after loss of C–D, is 0.35. To relieve 14 MW plus a 5 percent margin, the planner needs:

But re-dispatch would have to be pre-contingency because the emergency limit is exceeded immediately, and the planner must show that the re-dispatch does not overload facilities elsewhere (footnote 9). That is workable as an interim measure, not as a long-term solution.
Option 2 — reconductor A–B with a high-temperature conductor raising the emergency rating to 410 MVA:

CAP entry."Deficiency: overload of 138 kV A–B for P1 loss of 230 kV C–D, 104.9 percent of emergency rating, year two summer peak and later. Action: reconductor A–B, in service before summer of year two. Interim: pre-contingency re-dispatch of units G1 and G2 by up to 81 MW per Operating Procedure OP-xx, needed until the reconductor is in service."
Example 2: a P4 stuck breaker at a 345 kV station
A 345 kV breaker-and-a-half station has bays with line L1 and transformer T1 sharing middle breaker M. An SLG fault on L1 occurs and breaker M is stuck (gang-operated). Breaker failure protection opens the adjacent breakers, so L1 and T1(a 345/138 kV autotransformer) are lost, with Delayed Fault Clearing.
Classification. The removed elements include a 345/138 kV transformer. By footnotes 1 and 5, the lowest voltage — the 138 kV low side — governs. The event is HV, so P4 allows Firm Transmission Service interruption and Non-Consequential Load Loss.
Stability check. The planner simulates a 12-cycle total clearing time instead of the normal 4 cycles. A nearby 600 MW generator shows a rotor angle peak of 132 degrees and remains in synchronism, with oscillations damping to the PC's criterion. Voltage at the nearest 138 kV load bus recovers above 0.80 per unit within 0.9 seconds — compliant with an R5 criterion of "no bus below 0.80 per unit for more than 1.0 second after fault clearing."
If it had failed. Options would include replacing breaker M with an IPO breaker (footnote 10: only one pole stuck), reducing breaker failure timer settings where coordination allows, rearranging the bay so a line and a transformer do not share a middle breaker, or adding a RAS.
Example 3: checking voltage criteria
A TP's R5 criteria are: steady-state pre-contingency 0.95–1.05 per unit; post-contingency 0.92–1.05 per unit; maximum post-contingency deviation 8 percent; transient voltage not below 0.70 per unit for more than 0.5 seconds and recovering above 0.90 per unit within 2.0 seconds after fault clearing.
At 115 kV bus K, pre-contingency voltage is 1.01 per unit. After a P1 transformer loss, it falls to 0.925 per unit.

The post-contingency voltage (0.925) is within the 0.92 lower limit, but the deviation(8.4 percent) exceeds the 8 percent criterion. The planner must either show that automatic devices (switched capacitors under Part 3.3.2) act to restore voltage within the criterion, or include a CAP — for example, a 30 Mvar capacitor bank at bus K. With the capacitor modeled to switch automatically, voltage recovers to 0.97 per unit and the deviation becomes:

Lesson. Voltage criteria have three parts under R5 — limits, deviation and transient response — and each can drive a CAP independently.
Example 4: a short-circuit duty check
A 138 kV substation has breakers rated at 40 kA symmetrical interrupting current. A new 250 MVA synchronous combustion turbine and a new 138 kV line to an adjacent substation are planned for year three. The short-circuit study (Part 2.3), with all planned facilities in service, shows a maximum three-phase fault current of 41.6 kA at the bus, at an X/R ratio of 22.

The duty exceeds the rating before any X/R adjustment, so Part 2.8 requires a CAP. Options include: replacing the affected breakers with 63 kA breakers; adding a current-limiting series reactor in the new line; or splitting the bus with a normally open bus tie (which must then be studied for its own steady-state and stability effects). The CAP lists the breakers, the action and the in-service date before the generator's commercial operation date.
Example 5: the annual cycle timeline
Assume an assessment is completed on November 15. R8 sets the following deadlines:

A neighboring TP sends documented comments on March 1:

A Generator Owner submits a written request, citing a reliability need, on January 10:

Delivery on February 25 — 46 days after the request — would fall in the Moderate VSL band (more than 40 but not more than 50 days).
How TPL-001 connects to other standards and policies
TPL-001 sits at the center of a web of standards. The table summarizes the main links.
| Standard or policy | Relationship to TPL-001 |
|---|---|
| MOD-032 | Data for models (R1 requires consistency with MOD-032). Newer versions add IBR and DER data and a Distribution Provider obligation |
| MOD-026 / MOD-027 | Verified generator control and real power/frequency models used in Stability studies |
| MOD-033 | PC validation of planning models against actual events |
| FAC-002 | Interconnection studies for new facilities; often reuse TPL-001 methods and criteria |
| FAC-008 / FAC-014 | Facility Ratings used in steady state; System Operating Limits methodology consistent with planning criteria |
| PRC-006 | UFLS programs, modeled in stability and extreme events |
| PRC-010 | UVLS programs |
| PRC-012 | RAS used as CAP elements |
| PRC-023 / PRC-026 | Relay loadability and power swing settings that link to R3 Part 3.3.1.2 and R4 Part 4.3.1.3 |
| PRC-024 / PRC-029 | Generator and IBR ride-through settings that feed R3 Part 3.3.1.1 and R4 Part 4.3.1.2 |
| TPL-007 | Planning for geomagnetic disturbance (GMD) events — a separate assessment with its own benchmark and supplemental events |
| TPL-008 | Planning for extreme heat and extreme cold weather events — a separate assessment of extreme temperature scenarios |
| NUC-001 | Nuclear plant interface requirements that often set voltage criteria (R5) at nuclear switchyards |
| FERC Order No. 1000 / 1920 | Regional and long-term regional planning, cost allocation; CAPs feed regional plans |
| FERC Order No. 2023 | Interconnection queue reform (cluster studies); interconnection studies apply TPL-style criteria to proposed generation |
TPL-007 — geomagnetic disturbances
TPL-007 requires PCs and TPs to assess the impact of benchmark and supplemental GMD events, including transformer thermal assessments and the effects of reactive power losses from geomagnetically induced currents. It is a separate standard with separate deliverables, but it reuses the same models and often the same CAP process. Many PCs schedule GMD studies alongside the TPL-001 cycle.
TPL-008 — extreme temperature
NERC developed TPL-008 under Project 2023-07 to require transmission planning studies of extreme heat and extreme cold events — conditions in which load is very high and generation (particularly gas-fired) may be unavailable. It responds to lessons from the 2021 and 2022 winter events. TPL-008 was filed with FERC (Docket No. RD25-4-000); readers should check the current NERC and FERC records for approval status and the phased implementation dates that apply to their entity. TPL-001's extreme-event list already includes severe weather and gas pipeline loss; TPL-008 adds a structured, benchmark-based approach.
FERC Order No. 2023 and cluster interconnection studies
Order No. 2023 reformed generator interconnection procedures, moving US transmission providers toward cluster studies with firmer deadlines. Interconnection studies are not TPL-001 Planning Assessments, but they almost always apply TPL-001 performance criteria and Table 1 events to determine network upgrades. Once a generator signs an interconnection agreement, it and its upgrades enter the TPL-001 models as planned facilities (R1 Part 1.1.2).
Pending changes and what to watch
TPL-001-5.1 is the version in effect for US entities as of this writing. Several developments may change how it is applied; readers should verify current status on the NERC standards project pages and in FERC dockets.
- FERC Order No. 901 work on IBRs. NERC's Order No. 901 work plan includes standards on IBR data and modeling (Project 2022-02, whose scope was framed as modifications to both TPL-001-5.1 and MOD-032-1), and a later milestone addressing the validation of IBR models and their use in planning and operational studies. Any successor TPL-001 version that results will have its own implementation plan. Until a successor becomes effective, TPL-001-5.1 governs.
- Extreme weather. TPL-008 adds extreme temperature assessments alongside TPL-001.
- Large loads. NERC has been studying the reliability effects of very large computational and industrial loads; changes to data and modeling requirements may follow.
- Implementation details of version 5. TPL-001-5 introduced the expanded P5 single-point-of-failure analysis and spare equipment requirements, with phased compliance dates for some CAP elements set in its implementation plan. Entities should consult that implementation plan for the dates that applied to CAPs addressing P5 and related deficiencies.
Evidence and audit tips
TPL-001 audits are document audits. The table lists what auditors typically request and what strong evidence looks like.
| Requirement | Typical audit request | Strong evidence |
|---|---|---|
| R1 | Show the models and that they contain Parts 1.1.1–1.1.5 | Dated case files; model build memo listing sources; CAP items mapped to study years |
| R2 | Show the annual Planning Assessment | A single dated report with assumptions, summarized results, case list, sensitivity descriptions, known outage and spare equipment sections, CAPs |
| R2.1.3 / 2.4.3 | Show the sensitivities "stress" the system | Description of each sensitivity, magnitude of change, comparison of results |
| R2.1.4 / 2.4.4 | Show how known outages were selected | Outage coordination procedure or technical rationale; list of outages studied |
| R2.1.5 / 2.4.5 | Show spare equipment analysis | Inventory of long-lead equipment without spares; studies of P0/P1/P2 |
| R2.6 | Show past studies qualify | Study dates; material-change rationale |
| R2.7 / 2.8 | Show CAPs and their review | CAP table with deficiency, action, date, status; re-run results |
| R3 / R4 | Show contingency lists and studies | Lists with rationale; adjacent-system coordination emails or meeting notes; result summaries for every P category |
| R5 / R6 | Show criteria | Dated criteria documents referenced in the assessment |
| R7 | Show agreed responsibilities | Signed agreement, charter or dated correspondence |
| R8 | Show distribution and responses | Transmittal emails, portal logs, comment logs with response dates |
Practical tips.
- Put a requirement cross-reference at the front of the Planning Assessment: one table pointing every requirement and part to the section or appendix that satisfies it.
- Date everything. M2–M4 ask for "dated evidence."
- Keep the rationale for contingency lists and extreme events (Parts 3.4, 3.5, 4.4, 4.5) in writing; "engineering judgment" without explanation is weak evidence.
- For P5, keep the protection-redundancy survey that defines which stations have single points of failure, and the date it was last updated.
- Track R8 deadlines in a calendar or compliance tool, since lateness is measured in days.
- For footnote 12, keep the full Attachment 1 record — notices, agendas, comments, responses, regulatory non-objection and the ERO submission.
- Retain three calendar years of evidence at minimum, and longer if the last audit was more than three years ago, since the Compliance Enforcement Authority may ask for evidence covering the full period since the last audit.
Readiness checklist for Planning Coordinators and Transmission Planners
| Item | Done? |
|---|---|
| R7 agreement between PC and each TP current and signed | |
| MOD-032 data requirements current; data received from all providers | |
| R5 voltage criteria include limits, deviation, transient level and duration | |
| R6 instability, Cascading and islanding method documented | |
| Damping criterion for R4 Part 4.1.3 documented | |
| Case list covers Parts 2.1.1, 2.1.2, 2.2.1, 2.4.1, 2.4.2 | |
| Sensitivities defined that measurably stress the system | |
| Known-outage selection procedure or rationale documented | |
| Long-lead equipment without spares identified; P0/P1/P2 studied | |
| Dynamic load model with induction motor behavior in peak Stability | |
| Generator voltage-trip and relay loadability tripping simulated | |
| High-speed reclosing (successful and unsuccessful) simulated | |
| Protection-redundancy survey current for P5 | |
| Contingency lists coordinated with adjacent PCs/TPs | |
| Extreme events studied; Cascading evaluated with possible actions | |
| Short-circuit duty compared with ratings; CAPs where exceeded | |
| CAPs with timetables; Operating Procedures state duration | |
| Footnote 12 uses documented with Attachment 1 records | |
| R8 distribution and comment responses tracked | |
| Three calendar years of evidence retained |
Part C — Three Anonymous US Case Studies
The three cases below are composites based on typical US planning situations. Names, locations and identifying details have been removed. The numbers are illustrative but realistic.
Case study 1: A suburban load pocket and the footnote 12 question
Situation
A Transmission Planner in a fast-growing suburban area serves a load pocket of about 650 MW at summer peak through three 138 kV lines from a 345/138 kV hub. Two large data center campuses have signed electric service agreements, adding about 180 MW over three years. The year-two summer peak case shows that loss of any one of the three 138 kV lines (P1) overloads one of the remaining lines to 108 percent of its emergency rating. The long-term fix — a new 345/138 kV substation inside the pocket — needs a certificate from the state siting authority and a large autotransformer with a lead time of more than two years. Its realistic in-service date is year four.
Options considered
| Option | Result |
|---|---|
| Pre-contingency re-dispatch | No generation inside the pocket; re-dispatch outside is ineffective (distribution factors under 0.05) |
| Reconductor the 138 kV lines | Helps for two years; outage windows for reconductoring cannot be scheduled before the year-two summer without violating P0 during construction |
| Battery storage inside the pocket | 75 MW / 4-hour unit could cover the deficit; procurement and interconnection achievable for year three, not year two |
| Post-contingency load shed under footnote 12 | 45 MW would relieve the overload in year two |
What the planner did
The planner adopted a staged CAP. For year two, it used footnote 12 for up to 45 MW of planned Non-Consequential Load Loss after the P1 event — below the 75 MW cap for US entities. Because the amount was 25 MW or more and Year One was not involved in the first assessment (the deficiency first appeared in year two), the Attachment 1 Section III regulatory non-objection was not yet triggered — but the planner recognized that it would be triggered in the following year's assessment, when the year-two deficiency became Year One. Because the use fell within the Near-Term horizon, Attachment 1 Section I applied immediately, so the planner ran the stakeholder process in the first year, with notices to the state commission and local officials, an agenda naming the specific substations, a comment period and written responses.
The Section II documentation estimated that load would be at or above the critical level for about 40 hours per year, listed the customer classes affected and included a health and safety section confirming that hospitals and water treatment plants were on unaffected circuits.
In the next assessment, when the deficiency moved into Year One, the planner obtained written confirmation that the state commission did not object and submitted items II.1–II.8 to the ERO for an Adverse Reliability Impacts determination. Meanwhile, the CAP added a 75 MW battery in year three and the new 345/138 kV substation in year four, after which footnote 12 was no longer needed.
Lessons
- Footnote 12 is workable, but it is a process, not a switch. Start the stakeholder process early, before the deficiency reaches Year One.
- Large new loads change load-pocket planning quickly; R1 Part 1.1.3 load forecasts should reflect signed service agreements.
- A staged CAP — interim measure, intermediate fix, permanent solution — is common and acceptable, provided each stage is documented and reviewed annually under Part 2.7.4.
Case study 2: P5 single points of failure in an older 230 kV system
Situation
A Transmission Planner in the Southeast had a 230 kV and 115 kV system with many stations built in the 1970s and 1980s. When TPL-001-5's expanded P5 requirements came into force, the TP worked with the Transmission Owner's protection group to survey every BES station for the four footnote 13 components.
Survey results (simplified)
| Footnote 13 component | Stations with a non-redundant, unmonitored component |
|---|---|
| (a) Single protective relay without a comparable alternative | 6 of 48 |
| (b) Single unmonitored communications system for pilot protection | 11 of 48 |
| (c) Single station DC supply not monitored for both low voltage and open circuit | 19 of 48 |
| (d) Single control circuitry, trip coil not monitored | 23 of 48 |
Study results
For most stations, simulating the P5 event with remote backup clearing produced acceptable steady-state results at HV, where Table 1 allows Non-Consequential Load Loss and Firm Transmission Service interruption for P5. The Stability results were different. At four 230 kV stations near a large combined-cycle plant, a single station battery failure meant that a fault would be cleared only by remote zone 2 relays — after about 25 cycles — and the plant's units lost synchronism. Because the event was HV, the generator loss itself was acceptable under note (b), but in two of the cases the resulting swing caused distance relays on a 230 kV line to trip — a violation of R4 Part 4.1.2 — and the simulation showed voltage collapse in an adjacent 115 kV area, violating note (a).
What the planner did
The CAP did not include new lines. It included:
- installation of DC monitoring for low voltage and open circuit, reported to the Control Center, at all 19 stations — which, under footnote 13(c), removed the batteries from the non-redundant list;
- a second station battery at the four critical 230 kV stations;
- trip-coil monitoring and dual trip coils at stations where control-circuit failure drove violations;
- redundant communications for two pilot schemes;
- out-of-step blocking review on the 230 kV line that tripped on swings.
The work was scheduled over three years, with the four critical stations first. Each annual assessment reviewed status under Part 2.7.4.
Lessons
- P5 is as much a protection engineering exercise as a planning one. The TP depends on the TO for the redundancy data, and the TO depends on the TP for which failures matter.
- Monitoring and reporting at a Control Center is an explicit exception in footnote 13(b), (c) and (d). Adding monitoring is often the most cost-effective CAP.
- HV allowances for load loss do not relax the requirements that the system remain stable and not cascade.
Case study 3: An off-peak stability problem in a high-IBR region
Situation
A Planning Coordinator in the West covers a region where solar and battery storage now exceed half of the generation online at spring midday. The PC's R7 agreement assigns it responsibility for Near-Term Stability analysis. In the off-peak Stability case required by Part 2.4.2, it chose a spring midday condition with high solar, moderate load and only eight synchronous units online in a 500/230 kV area.
Findings
- For a P1 3Ø fault on a 500 kV line with Normal Clearing, all generators remained in synchronism, but three solar plants totaling 610 MW entered momentary cessation and did not return to pre-fault output for several seconds because of legacy inverter settings. Voltage at a 230 kV bus remained below 0.80 per unit for 1.4 seconds — beyond the PC's R5 transient criterion of 1.0 second.
- The off-peak sensitivity (Part 2.4.3, "generation dispatch scenarios") with two fewer synchronous units online showed poorly damped 0.8 Hz oscillations, below the PC's damping criterion under R4 Part 4.1.3.
- Positive-sequence results for one plant did not match the Generator Owner's EMT model, suggesting a model-quality issue.
What the planner did
- The PC requested updated MOD-032 data and models from the Generator Owners of the three plants. Two GOs confirmed that firmware updates and setting changes had already been made to eliminate momentary cessation for faults of this depth, but had not been reflected in the models. With the corrected models, the transient voltage violation disappeared for those plants.
- For the third plant, the GO committed to a setting change consistent with its ride-through obligations; the PC documented the change as part of the CAP with a timetable, and in the interim documented an operating limit on area solar output under low-commitment conditions, specifying how long it would be needed.
- For the damping problem, the CAP included a synchronous condenser at a 230 kV substation and tuning of power system stabilizers on two units, with grid-forming controls on a planned battery project studied as an alternative.
- The PC added an EMT screening step to its R6 methodology for areas with low short-circuit ratios.
Lessons
- In a high-IBR system, the off-peak Stability case is often the hardest case, not peak.
- Data quality is a CAP issue. Many apparent violations are model problems; the fix is better data through MOD-032 and verified models through MOD-026.
- Generator Owners have no TPL-001 obligation, but their settings, models and cooperation decide whether the PC can meet its obligations.