
A Coordinated Electric System Interconnection Review—the utility’s deep-dive on technical and cost impacts of your project.
Challenge: Frequent false tripping using conventional electromechanical relays
Solution: SEL-487E integration with multi-terminal differential protection and dynamic inrush restraint
Result: 90% reduction in false trips, saving over $250,000 in downtime
The three operating regions you have to design to
| Device | Output vs voltage | Response | Best suited to | Main limitations |
|---|---|---|---|---|
| Mechanically switched capacitor or reactor | Proportional to voltage squared | Seconds; discrete steps; limited switching operations per day | Steady-state reactive supply, voltage profile, loss reduction | No dynamic capability; step voltage change on switching; capability collapses when most needed |
| Static var compensator | Capacitive branches proportional to voltage squared | A few cycles; continuously controllable | Continuous control where cost matters and deep voltage support is not the driver | Square-law capability loss; harmonic filters are part of the plant and interact with the network |
| STATCOM | Approximately proportional to voltage — constant current capability | One to two cycles closed loop; converter response faster still | Voltage stability margin, weak interconnections, fast disturbance recovery, flicker and unbalance compensation | Higher capital cost; converter losses; adds a converter and its control dynamics to the network |
| Synchronous condenser | Governed by machine capability and excitation | Excitation response in the hundreds of milliseconds; inherent inertial response instantaneous | System strength and inertia, short-circuit contribution, black start support | Rotating plant with maintenance and losses; slower controlled response than a converter |
| STATCOM with energy storage | Reactive as a STATCOM, plus real power within the storage rating | As STATCOM for reactive; real power limited by storage | Where a real power deficiency is part of the problem | Cost and complexity of the storage; different failure and maintenance profile |
| Stage | Keentel scope | Outcome |
|---|---|---|
| Screening | Series-compensation proximity, radial contingency review, UIF and short-circuit ratio screening, frequency scans | Early identification of which SSO types apply |
| Detailed studies | PSCAD/EMTDC EMT studies with vendor real-code models, impedance-based and frequency-scan analysis | Clear evidence of stability margins or risk |
| Model quality | EMT model review, benchmarking against positive-sequence models, model acceptance support | Models that system operators accept |
| Mitigation | Control retuning recommendations with vendors, SSDC and bypass logic requirements, protection and monitoring specifications | Practical, coordinated solutions |
| Interconnection support | SSR and SSO study reports for ISO and utility requirements, response to reviewer comments | Fewer delays in the interconnection process |
Resilience: designing CDUs to the facility Tier objective
Liquid cooling makes heat removal more critical, not less. Cold plates hold only seconds of thermal buffer. If TCS flow stops, processors throttle or shut down very quickly. Resilience design must therefore cover:
- Pump redundancy: N+1 pumps at minimum, with automatic changeover.
- CDU redundancy: N+1 CDUs on a common TCS header, or 2N CDUs serving A and B manifolds for fault-tolerant designs.
- Power to CDUs: dual-corded CDUs fed from A and B sources, with pumps and controls on UPS power so coolant keeps flowing through a utility failure and generator start. This is the liquid-cooling equivalent of continuous cooling.
- Facility water continuity: chilled water or condenser water must also continue, through thermal storage, UPS-backed pumps or a high enough FWS temperature that the TCS can coast on stored thermal mass for the transfer period.
- Concurrent maintainability: isolation valves so any CDU, pump, filter or manifold section can be serviced without stopping the others.
- Leak management: leak detection, drip trays, automatic isolation valves and procedures for fluid spills.
Electrical engineering considerations
CDUs and liquid-cooling plants are electrical loads with their own design requirements:
- Pump motors and VFDs. Large CDUs use variable-frequency drives on their pump motors. These introduce harmonic current that must be included in the facility's harmonic study and IEEE 519 evaluation.
- Critical mechanical load on UPS. Putting CDU pumps on UPS increases UPS and battery sizing. The mechanical UPS load must be included in redundancy and ride-through calculations.
- Feeder and protection design. Dual feeds, automatic transfer, selective coordination and arc-flash labelling apply to CDU power distribution just as they do to IT power.
- Generator transient response. CDU pumps restarting together after a transfer create motor inrush on the generators. Staged restarts and soft acceleration reduce the step load.
- Load dynamics. AI training loads can swing rapidly between high and low power. Cooling controls must track those swings without temperature overshoot, and electrical systems must handle both the IT and the cooling load changes.
Commissioning a liquid-cooled data hall
- Flush and clean the TCS piping and manifolds to the specified cleanliness, using high-purity flush water.
- Fill and vent with the specified coolant, verifying glycol concentration and chemistry.
- Pressure test for leaks at design and test pressures, including quick-disconnect fittings.
- Verify sensors and controls: flow meters, temperature sensors, pressure transmitters, leak detection and BMS points.
- Load test with heat load banks connected through the cold-plate interfaces or rack manifolds, across the operating range.
- Prove the heat balance on both loops at several load steps, and the approach temperature against the design.
- Test failure scenarios: pump failure, CDU failure, power transfer to generator, valve failure and loss of facility water, confirming temperatures stay within the IT vendor's limits.
How Keentel Engineering helps
Keentel Engineering supports data center owners, developers and EPCs with the electrical engineering that liquid-cooled facilities depend on, and coordinates with the mechanical engineer of record and cooling vendors on the integrated design.
BESS DC Sizing: Power, Energy, Current and C-Rate — An Engineering Guide for US Projects
October 10, 2026 | Blog
Part A — BESS DC Sizing at a Glance
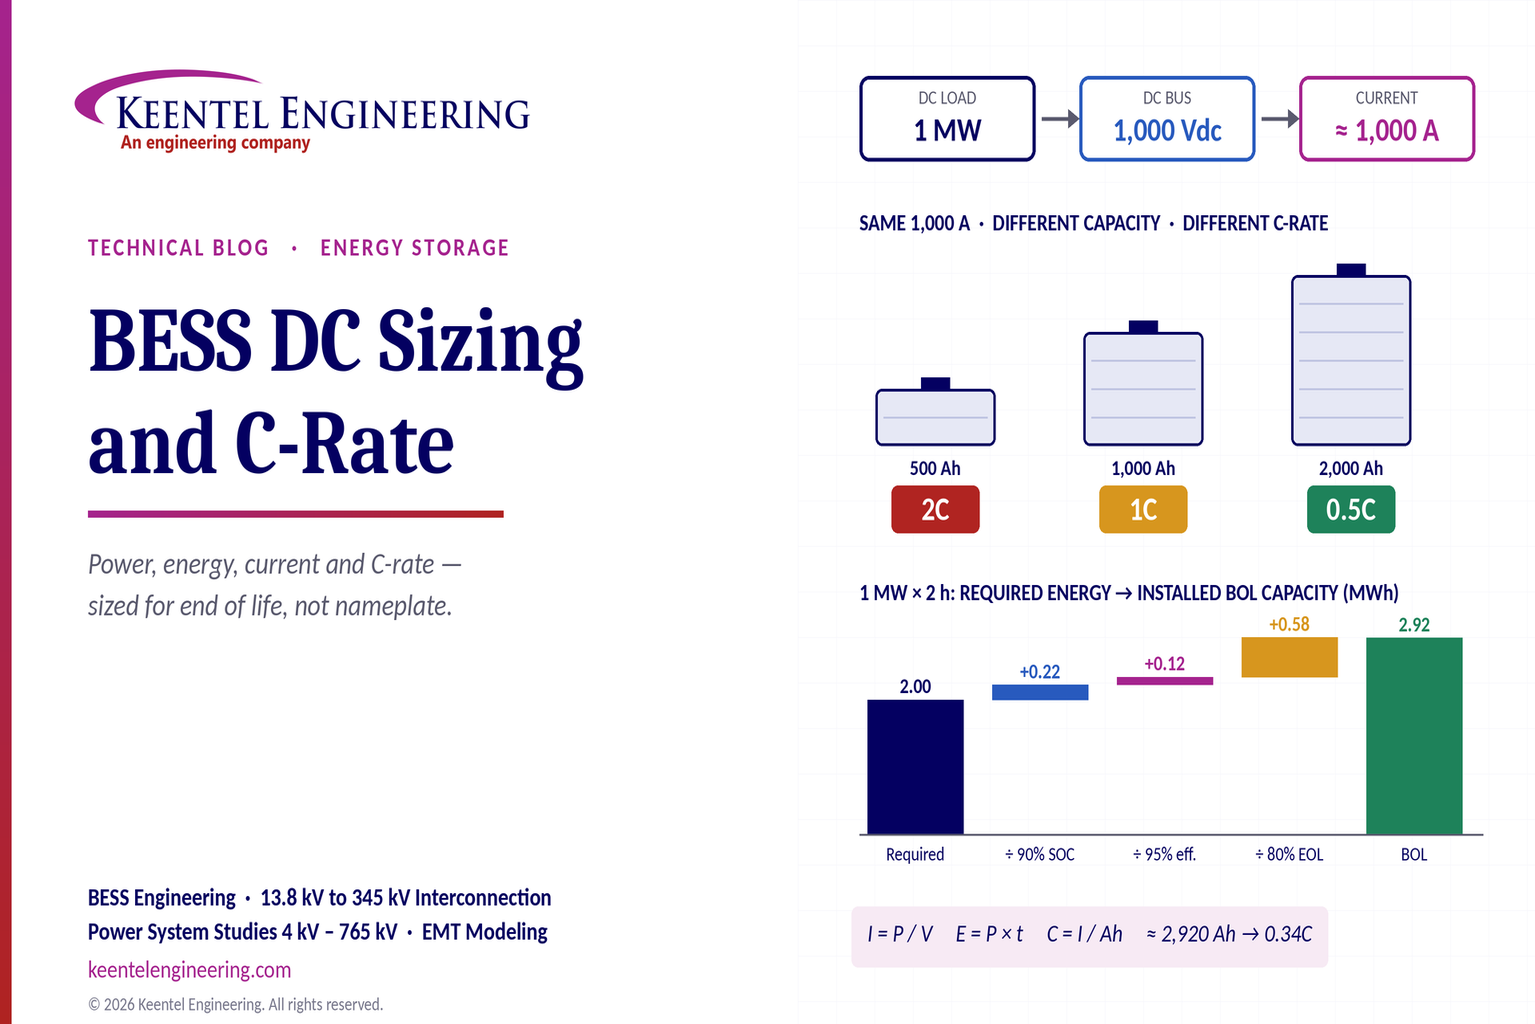
Battery energy storage projects are usually described by two numbers: power in MW and energy in MWh. A third parameter, C-rate, determines whether the battery can actually deliver that power. Two batteries with the same MWh can behave very differently if one must discharge at twice the current of the other.
Same load, different duration, different battery
| Discharge duration at 1 MW | Required energy (MWh) | Implied C-rate if battery energy equals required energy |
|---|---|---|
| 15 minutes | 0.25 | about 4C |
| 30 minutes | 0.50 | about 2C |
| 1 hour | 1.00 | about 1C |
| 2 hours | 2.00 | about 0.5C |
| 4 hours | 4.00 | about 0.25C |
Same load current, different battery capacity
At 1 MW and 1,000 Vdc the battery delivers about 1,000 A:
| Battery capacity | C-rate at 1,000 A |
|---|---|
| 500 Ah | 2C |
| 1,000 Ah | 1C |
| 2,000 Ah | 0.5C |
The key relationships (DC side)
- Current: I = P ÷ V. The load and the DC voltage determine the current.
- Energy: E = P × t. Power and duration determine the energy.
- C-rate: C = I ÷ Ah. The current and the battery capacity determine the C-rate.
The load determines the current. The battery capacity determines the C-rate. The right BESS design matches load demand with current-delivery capability — not just stored energy.
Part B — BESS DC Sizing: Power, Energy, Current and C-Rate — An Engineering Guide for US Projects
From a 1 MW microgrid battery at an industrial plant to a 400 MWh battery connected at 230 kV or 345 kV, every BESS design must answer the same questions. How much power must it deliver, for how long, at what point in the system, and for how many years? This guide walks through BESS DC sizing step by step: from power and duration, to DC current, C-rate, usable energy, losses and degradation. It then shows how the same principles apply to US utility-scale projects and to the substation DC batteries engineers have sized under IEEE 485 for decades.
Step 1: determine the DC current
DC current follows directly from power and voltage:
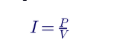
For a 1 MW DC load at 1,000 Vdc, the current is 1,000,000 W ÷ 1,000 V = 1,000 A.
Battery voltage is not constant
A lithium-ion battery's DC voltage changes with state of charge (SOC), temperature and current. A string of 312 lithium iron phosphate (LFP) cells has a nominal voltage of about 1,000 V, but its operating voltage varies between about 875 V near empty and 1,125 V near full charge. The current needed for constant power is highest at the lowest voltage:

| Operating point | DC voltage | Current at 1 MW |
|---|---|---|
| Full charge | ≈ 1,125 V | ≈ 890 A |
| Nominal | ≈ 1,000 V | ≈ 1,000 A |
| Near empty | ≈ 875 V | ≈ 1,145 A |
Cables, fuses, DC contactors, busbars and the PCS DC input must be rated for the maximum current at minimum voltage, not the nominal current. Many US utility-scale systems now use DC voltages up to 1,500 V to reduce current, cable size and losses for the same power.
Step 2: match the current with battery capacity — the C-rate
C-rate expresses discharge or charge current relative to battery capacity:

A 1C current fully discharges the battery in about one hour; 0.5C in about two hours; 2C in about 30 minutes. For the same 1,000 A, a 500 Ah battery operates at 2C, a 1,000 Ah battery at 1C and a 2,000 Ah battery at 0.5C.
Why C-rate matters
- Cell capability: every cell has a maximum continuous and peak C-rate. Energy-optimized LFP cells used in utility storage are commonly rated around 0.25C to 1C continuous; power-optimized cells can deliver several C.
- Heat: internal heating rises with the square of current. Higher C-rates increase cooling requirements and auxiliary consumption.
- Usable capacity: at higher C-rates, voltage sags more and the battery reaches its minimum voltage sooner, so less energy is available.
- Degradation: high C-rates and high temperatures accelerate capacity fade.
- Cost: high-power systems need more PCS, cabling and cooling per MWh; long-duration systems need more cells per MW.
C-rate versus P-rate
Industry datasheets often quote a power-to-energy ratio, sometimes called P-rate, in MW per MWh. A 1 MW / 4 MWh system has a P-rate of 0.25P. C-rate is current-based and P-rate is power-based, so they differ when voltage varies. Near the end of discharge, a battery operating at 0.25P may be operating at a higher C-rate because voltage has fallen and current has risen.
Step 3: determine the energy requirement
For a constant load, the ideal energy requirement is:
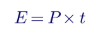
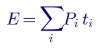
For a 1 MW load, this is 0.25 MWh for 15 minutes, 1.0 MWh for 1 hour, 2.0 MWh for 2 hours and 4.0 MWh for 4 hours. For a variable load, the energy is the sum over the duty cycle:
But the required energy is not the installed battery capacity. Practical margins come next.
Step 4: apply practical sizing margins
For the 1 MW, 2-hour example, required delivered energy is 2.0 MWh. Three factors increase the installed capacity:
| Factor | Typical value | Why it matters |
|---|---|---|
| Usable SOC window | 90% (for example 5% to 95%) | Cells are not fully charged or discharged, to protect life and maintain power capability |
| Discharge-path efficiency | 95% (DC side, including battery losses and auxiliaries) | Energy is lost between the cells and the delivery point |
| End-of-life capacity retention | 80% | Capacity fades over life; the system must still deliver the requirement at end of life |
The nominal beginning-of-life (BOL) energy is:

For the example: 2.0 ÷ (0.90 × 0.95 × 0.80) ≈ 2.92 MWh. At a nominal 1,000 Vdc, this corresponds to about 2,920 Ah:

A 1,000 A discharge then corresponds to a nominal C-rate of about 0.34C at beginning of life. At the minimum operating voltage, the current rises to about 1,145 A, or about 0.39C, and at end of life the same current is a larger fraction of the remaining capacity. The cells must be rated for the worst combination, not the nominal case.
The required energy is not the installed capacity. SOC window, losses and degradation can increase installed capacity by 40% or more.
Step 5: account for the full AC loss chain
Most US projects define energy and power at the point of interconnection (POI) or revenue meter, not at the battery terminals. Every element between the cells and the POI consumes energy:
| Element | Typical one-way efficiency |
|---|---|
| Battery (DC, at moderate C-rate) | 97 to 99% |
| PCS (inverter) | 98 to 99% |
| Medium-voltage step-up transformer (to 34.5 kV) | 99 to 99.5% |
| 34.5 kV collection system | 99 to 99.7% |
| Main power transformer (34.5 kV to 230 or 345 kV) | 99.5 to 99.7% |
| Auxiliary loads (HVAC, controls, lighting) | 1 to 3% of throughput, higher in hot climates |
The DC power required for a POI power commitment is:

The PCS must also supply reactive power. If the interconnection requires 0.95 power factor at the POI, the PCS MVA rating must cover both the active power and reactive power, plus transformer and collector reactive losses.
Step 6: plan for degradation — oversize or augment
There are two common strategies for meeting a long-term energy requirement:
- Oversize at beginning of life: install enough capacity to meet the requirement at end of life, as in the 80% retention example. This has a higher upfront cost but simpler operations.
- Augmentation: install less capacity initially and add containers or modules over time to restore usable energy. This reduces upfront cost and takes advantage of future cell price declines, but requires space, electrical capacity and a commercial plan for future additions.
Many US utility-scale projects with 15 to 20-year capacity contracts use augmentation. Either way, the degradation model must reflect the actual duty cycle: cycles per day, depth of discharge, C-rate, temperature and rest SOC.
Worked example: 100 MW / 400 MWh at a 230 kV POI
Consider a 4-hour battery supplying 100 MW and 400 MWh at a 230 kV POI, a typical configuration for US resource adequacy and capacity products.
| Parameter | Value |
|---|---|
| POI power / energy | 100 MW / 400 MWh |
| Loss chain, DC to POI (PCS, MV transformer, collector, main transformer) | ≈ 96.8% |
| Auxiliary allowance | ≈ 1% |
| Required DC energy delivered | 400 ÷ (0.968 × 0.99) ≈ 417 MWh |
| Usable SOC window 90% | ≈ 464 MWh |
| Augmentation strategy (maintain at least 90% state of health) | ≈ 515 MWh BOL plus scheduled additions |
| No augmentation (70% state of health at year 20) | ≈ 662 MWh BOL |
| DC power required | 100 ÷ 0.968 ≈ 103 MW |
| P-rate at BOL (augmentation case) | 103 MW ÷ 515 MWh ≈ 0.20P |
The example shows why a "400 MWh" battery is rarely 400 MWh of installed cells. A project that installs only nameplate DC energy may fall short of its POI energy obligation from day one.
Lessons from substation DC systems: IEEE 485
Utility engineers have sized stationary batteries for decades using IEEE 485, the recommended practice for sizing lead-acid batteries for stationary applications such as substation 125 Vdc systems. Its method applies the same logic as BESS sizing:
- Duty cycle: a defined profile of loads and durations, including momentary breaker tripping, continuous relay and SCADA loads, and emergency loads over the required backup time.
- Temperature correction: additional capacity for the minimum electrolyte temperature.
- Design margin: typically 10 to 15% for unforeseen load growth.
- Aging factor: commonly 1.25, so the battery still meets the duty cycle at 80% capacity, the same 80% end-of-life assumption used in the BESS example.
IEEE 1115 applies similar methods to nickel-cadmium batteries. Lithium-ion BESS sizing adds SOC windows, C-rate limits, thermal management and power conversion, but the principle is identical: size for the worst-case duty at end of life, not the nameplate at beginning of life.
Thermal design and auxiliary loads
C-rate and heat are directly linked. Each cell generates heat roughly in proportion to I²R, so doubling current roughly quadruples resistive heating. Thermal design affects sizing in several ways:
- Cooling capacity: liquid-cooled enclosures support higher C-rates and tighter temperature uniformity than air-cooled designs.
- Auxiliary energy: cooling, heating and controls draw power continuously, which reduces net energy at the POI, particularly in hot Southwest or Texas summers.
- Temperature derating: cell capability and available capacity fall at low and high temperatures; the BMS limits current accordingly.
- Degradation: sustained high temperature accelerates capacity fade, increasing augmentation needs.
Codes and standards for US BESS projects
| Standard | Scope |
|---|---|
| UL 1973 | Batteries for stationary applications |
| UL 9540 | Energy storage systems and equipment |
| UL 9540A | Thermal runaway fire propagation test method |
| UL 1741 | Inverters and power conversion equipment |
| NFPA 855 | Installation of stationary energy storage systems |
| NFPA 70, Article 706 | Energy storage systems wiring and protection |
| IEEE 1547-2018 | Interconnection of distribution-connected resources |
| IEEE 2800-2022 | Interconnection of transmission-connected inverter-based resources |
| IEEE 2030.2.1 | Guide for design, operation and maintenance of battery energy storage systems |
| IEEE 485 and IEEE 1115 | Sizing of stationary lead-acid and nickel-cadmium batteries |
A complete BESS sizing checklist
- Define the requirement at the right point: power and energy at the POI, the meter or the DC bus.
- Define the duty cycle: constant power, peak shaving profile, capacity product, backup or frequency response.
- Calculate DC current at minimum voltage for every operating mode, including charging.
- Check C-rate against cell continuous and peak ratings, at beginning and end of life and across temperature.
- Apply SOC window, loss chain and auxiliary allowances.
- Choose a degradation strategy: oversizing or augmentation, with a duty-cycle-based degradation model.
- Size the PCS in MVA for active power, reactive power and voltage range.
- Verify thermal design for site climate and duty.
- Confirm compliance with UL, NFPA, NEC and interconnection requirements.
- Validate with the manufacturer's tools and warranty terms, including throughput limits and capacity guarantees.
How Keentel Engineering helps
Keentel Engineering provides independent BESS engineering for utilities, independent power producers, developers and commercial and industrial owners, with
power system studies from 4 kV to 765 kV.
| Stage | Keentel scope | Outcome |
|---|---|---|
| Sizing and feasibility | Duty cycle definition, DC and AC sizing, C-rate and thermal checks, degradation and augmentation planning | A battery that meets its obligation for its full life |
| Owner's engineer | Vendor proposal review, capacity guarantees, warranty and technical specification review | Protection against undersized or overpromised systems |
| Electrical design | DC system design, 34.5 kV collection, substation and main power transformer design, grounding and protection | Constructible, code-compliant designs |
| Interconnection studies | Load flow, short circuit, dynamic and EMT studies, IEEE 2800 and IEEE 1547 compliance | Interconnection approvals at 13.8 kV to 345 kV |
| Substation DC systems | IEEE 485 and IEEE 1115 battery and charger sizing for substations and switchyards | Reliable protection and control power |
| Testing and commissioning | Capacity tests, round-trip efficiency verification and performance reports | Proof that the system delivers what was purchased |
Why owners and developers choose Keentel Engineering
- Independent of battery vendors: sizing recommendations are based on the owner's requirements, not a product line.
- From cells to the grid: one team covers DC sizing, power conversion, collection systems, substations and transmission interconnection.
- Utility-grade engineering: experience with substation DC systems, protection and NERC compliance brings utility rigor to storage projects.
- Licensed professional engineering: a Florida-registered firm with offices in Tampa, Austin, Sacramento and Baltimore, supporting projects nationwide.
Sizing a battery or reviewing a vendor proposal? Talk to Keentel Engineering at (813) 389-7871, contact@keentelengineering.com, or book a 15-minute scoping call at calendly.com/keentel-engineering/15min.
Part C — Case Studies
The following are illustrative scenarios based on conditions typical of US storage and substation projects. They show how Keentel Engineering approaches sizing problems; site details are generalised and figures are rounded.
Case Study 1 — 100 MW / 400 MWh capacity project at 230 kV: the missing megawatt-hours
Situation
A developer has a 100 MW, 4-hour resource adequacy contract measured at a 230 kV POI. The vendor proposal offers 400 MWh of DC nameplate capacity.
Analysis
Keentel's review applies the SOC window, PCS and transformer losses, collector losses, auxiliary loads and degradation. The proposal would deliver roughly 85% of the contracted energy at the POI in the first year and less every year after.
Engineered solution
Keentel resizes the system to about 515 MWh beginning-of-life DC capacity with an augmentation schedule, reserves space and electrical capacity for future containers, and adds POI energy guarantees and capacity test procedures to the supply contract.
Outcome
The project meets its POI energy obligation from commercial operation, with a defined plan to maintain it for the contract term.
Case Study 2 — 2 MW industrial microgrid: when C-rate, not energy, sets capacity
Situation
An industrial plant wants 2 MW of battery power for 15 minutes to ride through utility disturbances and support generator start-up. The initial estimate sizes the battery at about 0.6 MWh from energy alone.
Analysis
At 0.6 MWh, the battery would need to discharge at more than 3C, well above the continuous rating of the energy-optimized LFP cells proposed. Voltage sag and heating at that current would also reduce available energy.
Engineered solution
Keentel compares two options: power-optimized cells at about 0.6 MWh, or energy-optimized LFP cells at about 2.2 MWh operating near 1C. The larger LFP system is selected because it also supports daily peak shaving, improving the project's economics.
Outcome
The system delivers its ride-through function well within cell limits and earns additional revenue from peak shaving.
Case Study 3 — 230/69 kV substation: 125 Vdc battery replacement under IEEE 485
Situation
A utility is replacing a 20-year-old 125 Vdc lead-acid battery at a 230/69 kV substation that has added breakers, relays and communications equipment since construction.
Analysis
Keentel develops a new duty cycle with simultaneous breaker tripping, continuous relay, SCADA and communications loads, and an 8-hour backup requirement. The existing battery size, unchanged since construction, would not meet the new duty cycle once temperature correction, design margin and a 1.25 aging factor are applied.
Engineered solution
Keentel sizes a new battery and charger under IEEE 485, specifies battery monitoring, and checks voltage drop to the most distant trip coils.
Outcome
The substation has a DC system that meets the full duty cycle at end of life, with documented calculations for future expansion.
Part D — Technical FAQ: BESS DC Sizing and C-Rate
1. What is C-rate?
C-rate is battery current divided by capacity in amp-hours. A 1C current discharges the full capacity in about one hour, 2C in about 30 minutes and 0.5C in about two hours.
2. How is DC current calculated for a BESS?
Current equals power divided by voltage. A 1 MW DC load at 1,000 Vdc draws about 1,000 A. Because battery voltage varies, the maximum current occurs at the minimum operating voltage.
3. Why is the minimum battery voltage important?
For constant power, current increases as voltage falls. Cables, fuses, contactors and the PCS must be rated for the current at minimum voltage, and cell C-rate must be checked at that current.
4. What is the difference between C-rate and P-rate?
C-rate is based on current and amp-hour capacity. P-rate is power divided by energy, in MW per MWh. They differ because battery voltage changes during discharge.
5. Why can't the battery energy equal the required energy?
Batteries are operated within a limited SOC window, energy is lost in conversion and auxiliaries, and capacity fades with age. Installed capacity must exceed the requirement to cover all three.
6. What is a typical usable SOC window?
Many lithium-ion BESS designs use about 85 to 95% of nominal capacity, depending on chemistry, warranty terms and duty cycle.
7. How is beginning-of-life capacity calculated?
Divide the required energy by the product of the usable SOC window, discharge-path efficiency and end-of-life capacity retention. For 2.0 MWh, 90%, 95% and 80%, the result is about 2.92 MWh.
8. How does C-rate affect battery life?
Higher C-rates increase heating and mechanical stress in the cells, which accelerates degradation. Operating at moderate C-rates and temperatures extends life.
9. What C-rates do utility-scale LFP batteries use?
Energy-optimized LFP systems for 2 to 4-hour applications commonly operate around 0.25C to 0.5C, with cells rated up to about 1C. Short-duration, high-power applications use power-optimized cells.
10. Where should BESS energy be measured?
It depends on the contract or application. Utility-scale projects usually define energy at the POI or revenue meter, so all losses between the cells and that point must be included.
11. What losses occur between the battery and the POI?
Battery internal losses, PCS losses, medium-voltage transformer losses, collector system losses, main power transformer losses and auxiliary loads such as cooling and controls.
12. What is augmentation?
Augmentation is adding battery capacity over time to offset degradation, instead of oversizing the system at beginning of life to meet the end-of-life requirement.
13. How does temperature affect BESS sizing?
Low temperatures reduce available capacity and allowable charge current; high temperatures accelerate degradation and increase cooling loads. Sizing must reflect site climate and thermal design.
14. Why does the PCS need a higher MVA rating than the battery's MW rating?
The PCS must supply reactive power for voltage and power factor requirements, plus transformer and collector losses, in addition to active power.
15. What is IEEE 485?
IEEE 485 is the recommended practice for sizing lead-acid batteries for stationary applications, such as substation 125 Vdc systems. It uses a duty cycle, temperature correction, design margin and an aging factor.
16. Why is a 1.25 aging factor used?
It ensures the battery can still meet the duty cycle when its capacity has fallen to 80% of rated, which is the typical end-of-life criterion for stationary batteries.
17. What standards apply to US BESS equipment?
UL 1973 for batteries, UL 1741 for inverters, UL 9540 for the complete system, UL 9540A for fire propagation testing, NFPA 855 for installation and NEC Article 706 for wiring and protection.
18. How does DC voltage choice affect design?
Higher DC voltage, such as 1,500 V, reduces current for the same power, which reduces cable size, losses and the number of parallel strings, but requires equipment rated for the higher voltage.
19. How is BESS capacity verified after construction?
Through commissioning capacity tests at the POI or specified measurement point, following the contract test procedure, along with round-trip efficiency testing and periodic capacity tests over life.
20. What is the most common BESS sizing mistake?
Treating DC nameplate MWh as delivered energy. Ignoring the SOC window, losses, auxiliary loads, degradation and C-rate limits leads to systems that cannot meet their obligations.
References and Further Reading
Links were current at publication (October 2026).
- IEEE Std 485, Recommended Practice for Sizing Lead-Acid Batteries for Stationary Applications. IEEE.
- IEEE Std 1115, Recommended Practice for Sizing Nickel-Cadmium Batteries for Stationary Applications. IEEE.
- IEEE Std 2030.2.1, Guide for Design, Operation, and Maintenance of Battery Energy Storage Systems, both Stationary and Mobile, and Applications Integrated with Electric Power Systems. IEEE.
- IEEE Std 1547-2018 and IEEE Std 2800-2022. IEEE.
- UL 1973, UL 1741, UL 9540 and UL 9540A. UL Solutions.
- NFPA 855, Standard for the Installation of Stationary Energy Storage Systems; NFPA 70, National Electrical Code, Article 706. National Fire Protection Association.
Disclaimer
This article is general technical information for educational purposes. It is not engineering advice for any specific project and does not create a professional relationship. Voltages, efficiencies, C-rates, SOC windows, degradation factors and capacities are illustrative; actual designs must follow manufacturer data and warranty terms, applicable codes and standards, interconnection requirements and project-specific engineering analysis, sealed by a licensed professional engineer where required. Verify the current edition of any standard before relying on it.
Case studies are illustrative scenarios based on typical project conditions, not records of specific client projects. Figures are rounded and indicative.
IEEE, UL, NFPA and other names are the property of their respective owners.
Keentel Engineering is not affiliated with or endorsed by these organisations or any battery or equipment manufacturer.
| Office | Address | Phone |
|---|---|---|
| Head Office — Tampa | 400 N Ashley Dr STE #2600, Tampa FL 33602 | (813) 389-7871 |
| Austin | 5900 Balcones Drive STE 100, Austin TX 78731 | (512) 591-0752 |
| Sacramento | 1401 21st St Ste R, Sacramento CA 95811 | (916) 913-4524 |
| Baltimore | 306 W Redwood St STE 200, Baltimore MD 21201 | (410) 225-2181 |
contact@keentelengineering.com · keentelengineering.com · calendly.com/keentel-engineering/15min
State of Florida — Registry No. 36853, KEENTEL LLC, DBA: KEENTEL ENGINEERING
Copyright 1995–2026 Keentel Engineering. All Rights Reserved.

About the Author:
Sandip "Sonny" R. Patel, P.E.
IEEE Senior Member · Founder & CEO, Keentel Engineering
In 1995, Sonny Patel earned his Electrical Engineering degree from the University of Illinois. But degrees don't build legacies — action does.
For three decades, he has worked the power industry from every side of the table: 16 years as a utility engineer at Exelon/Commonwealth Edison; generation leadership across hydroelectric, industrial steam turbine, and a 9 GW renewable fleet; NERC Regional Entity Senior Compliance Engineer and Audit Team Lead, auditing some of the nation's largest utilities; and testing and commissioning lead on equipment up to 765 kV — the very top of the North American grid.Utility. Generator. Regulator. Consultant. Few engineers have seen all four seats. Fewer still have sat in them.
His experience spans nuclear, hydro, conventional generation, renewables, oil and gas, mining — and today's data centers, where he is authoring a three-book series on data center design. He is a Licensed Professional Engineer in six states and a Licensed Electrical Contractor in Florida (Unlimited EC) — he doesn't just design the work; he's qualified to stand behind its execution.Today, as Founder and CEO of Keentel Engineering, Sonny leads a nationwide team of engineers delivering substation design, power system studies, NERC compliance, and commissioning — done right, coast to coast.Three decades. Every side of the table. One standard: accountable engineering.
Services

Let's Discuss Your Project
Let's book a call to discuss your electrical engineering project that we can help you with.
About the Author:
Sandip "Sonny" R. Patel, P.E.
IEEE Senior Member · Founder & CEO, Keentel Engineering
In 1995, Sonny Patel earned his Electrical Engineering degree from the University of Illinois. But degrees don't build legacies — action does.
For three decades, he has worked the power industry from every side of the table: 16 years as a utility engineer at Exelon/Commonwealth Edison; generation leadership across hydroelectric, industrial steam turbine, and a 9 GW renewable fleet; NERC Regional Entity Senior Compliance Engineer and Audit Team Lead, auditing some of the nation's largest utilities; and testing and commissioning lead on equipment up to 765 kV — the very top of the North American grid.
Utility. Generator. Regulator. Consultant. Few engineers have seen all four seats. Fewer still have sat in them.
His experience spans nuclear, hydro, conventional generation, renewables, oil and gas, mining — and today's data centers, where he is authoring a three-book series on data center design. He is a Licensed Professional Engineer in six states and a Licensed Electrical Contractor in Florida (Unlimited EC) — he doesn't just design the work; he's qualified to stand behind its execution.
Today, as Founder and CEO of Keentel Engineering, Sonny leads a nationwide team of engineers delivering substation design, power system studies, NERC compliance, and commissioning — done right, coast to coast.Three decades. Every side of the table. One standard: accountable engineering.
Leave a Comment
Thank you for contacting us.
We will get back to you as soon as possible.
We will get back to you as soon as possible.
Oops, there was an error sending your message.
Please try again later.
Please try again later.
Related Posts
By SANDIP R PATEL
•
October 11, 2026
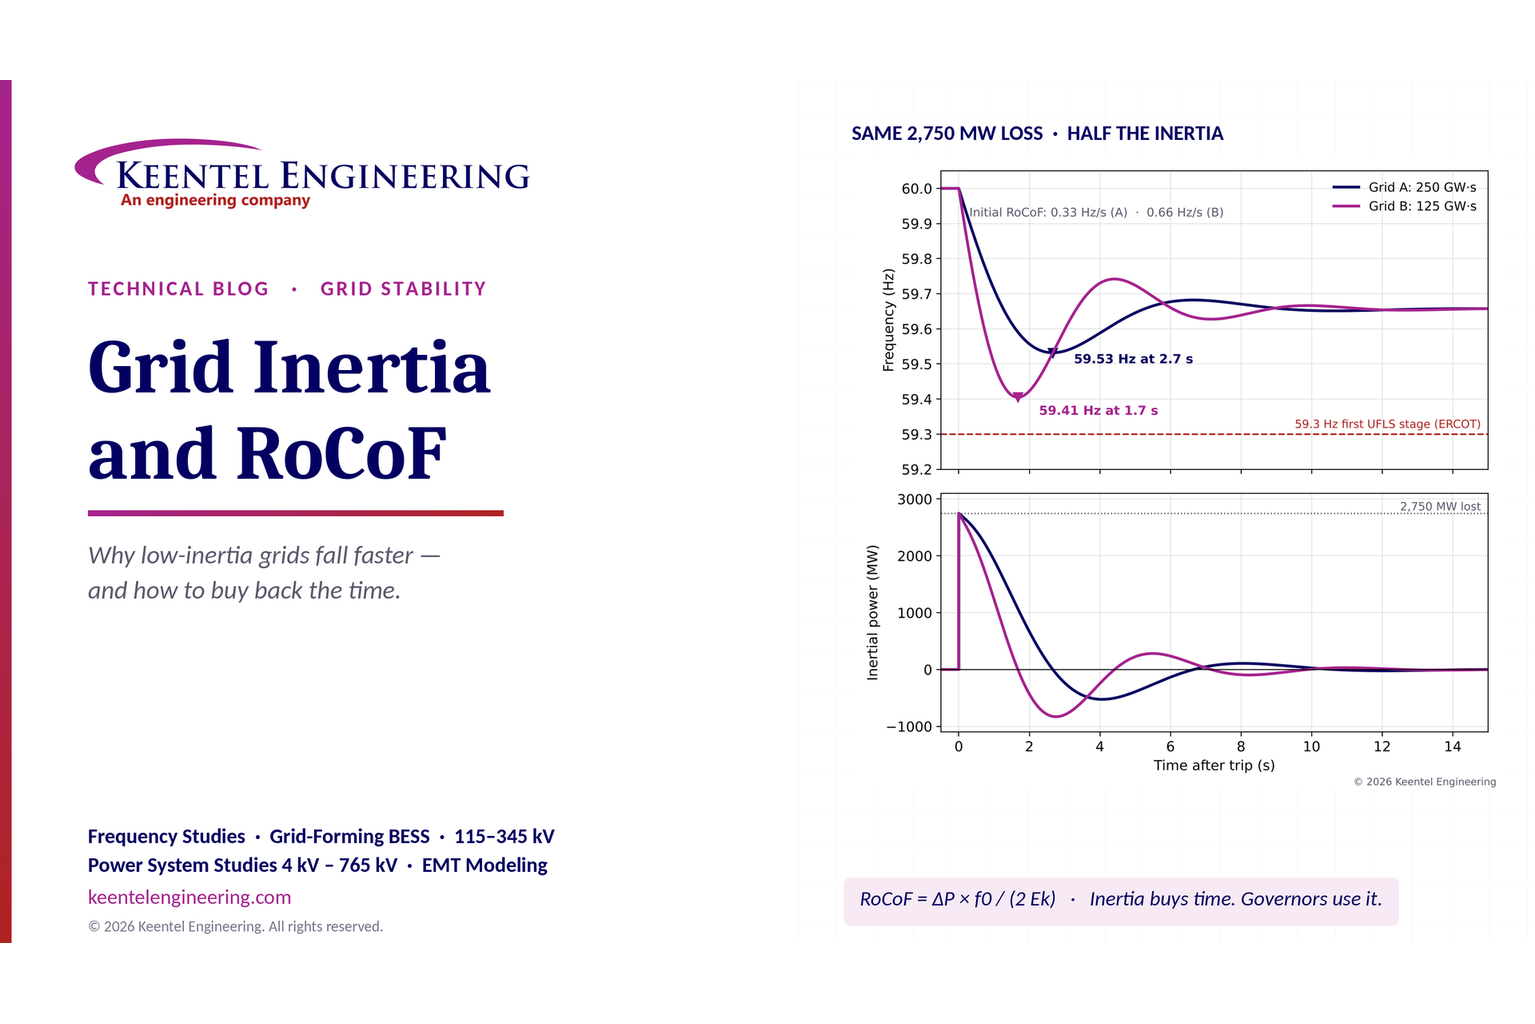
Explore grid inertia, RoCoF and frequency response, with swing equation calculations, frequency nadir analysis and US power system simulation examples.
By SANDIP R PATEL
•
October 10, 2026
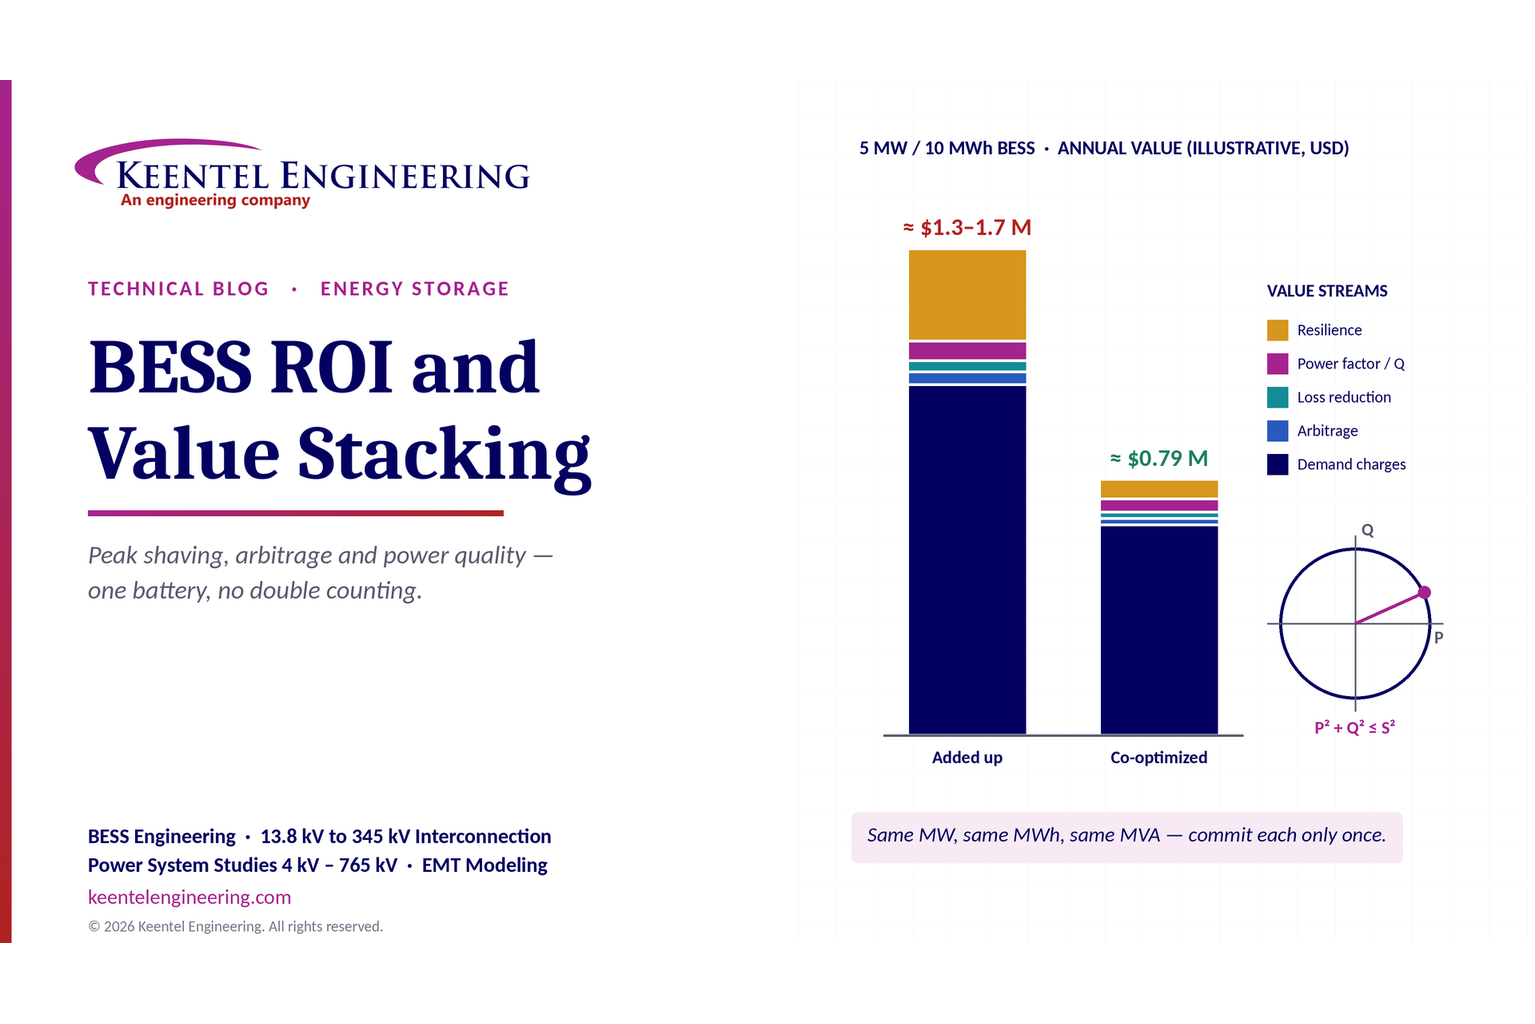
Learn how BESS ROI is calculated using peak shaving, energy arbitrage, power quality and battery storage economics, with a practical 5 MW/10 MWh example.
By SANDIP R PATEL
•
October 10, 2026
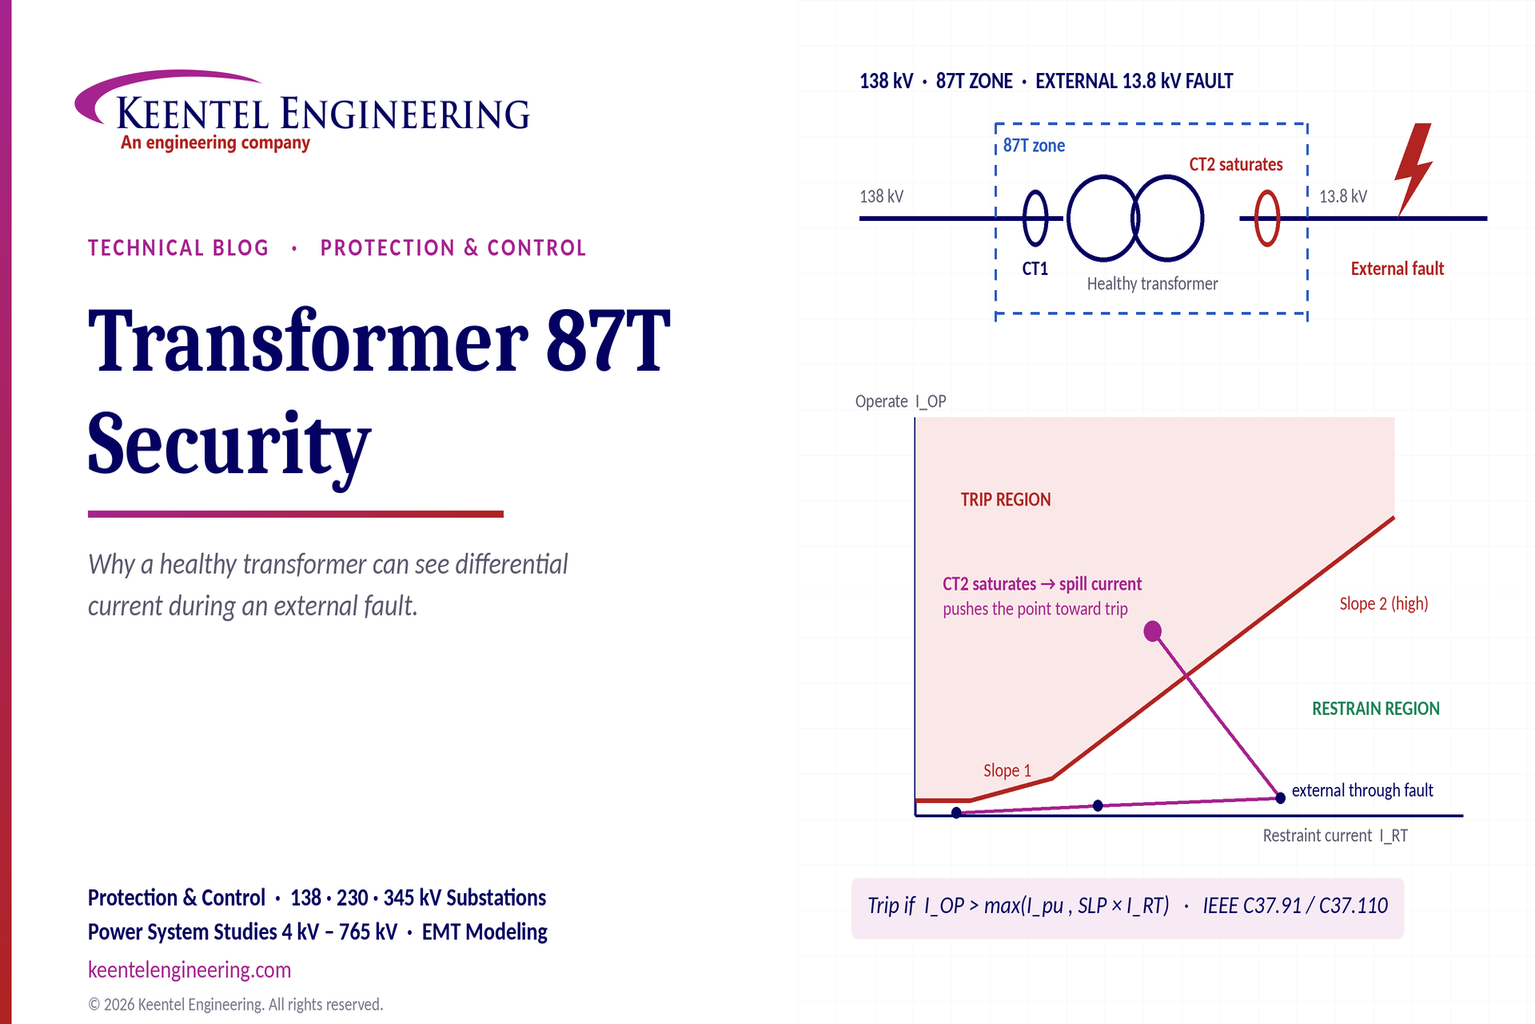
Learn why transformer differential relays detect current during external faults, how CT saturation causes spill current, and how secure 87T protection prevents trips.
By SANDIP R PATEL
•
October 10, 2026
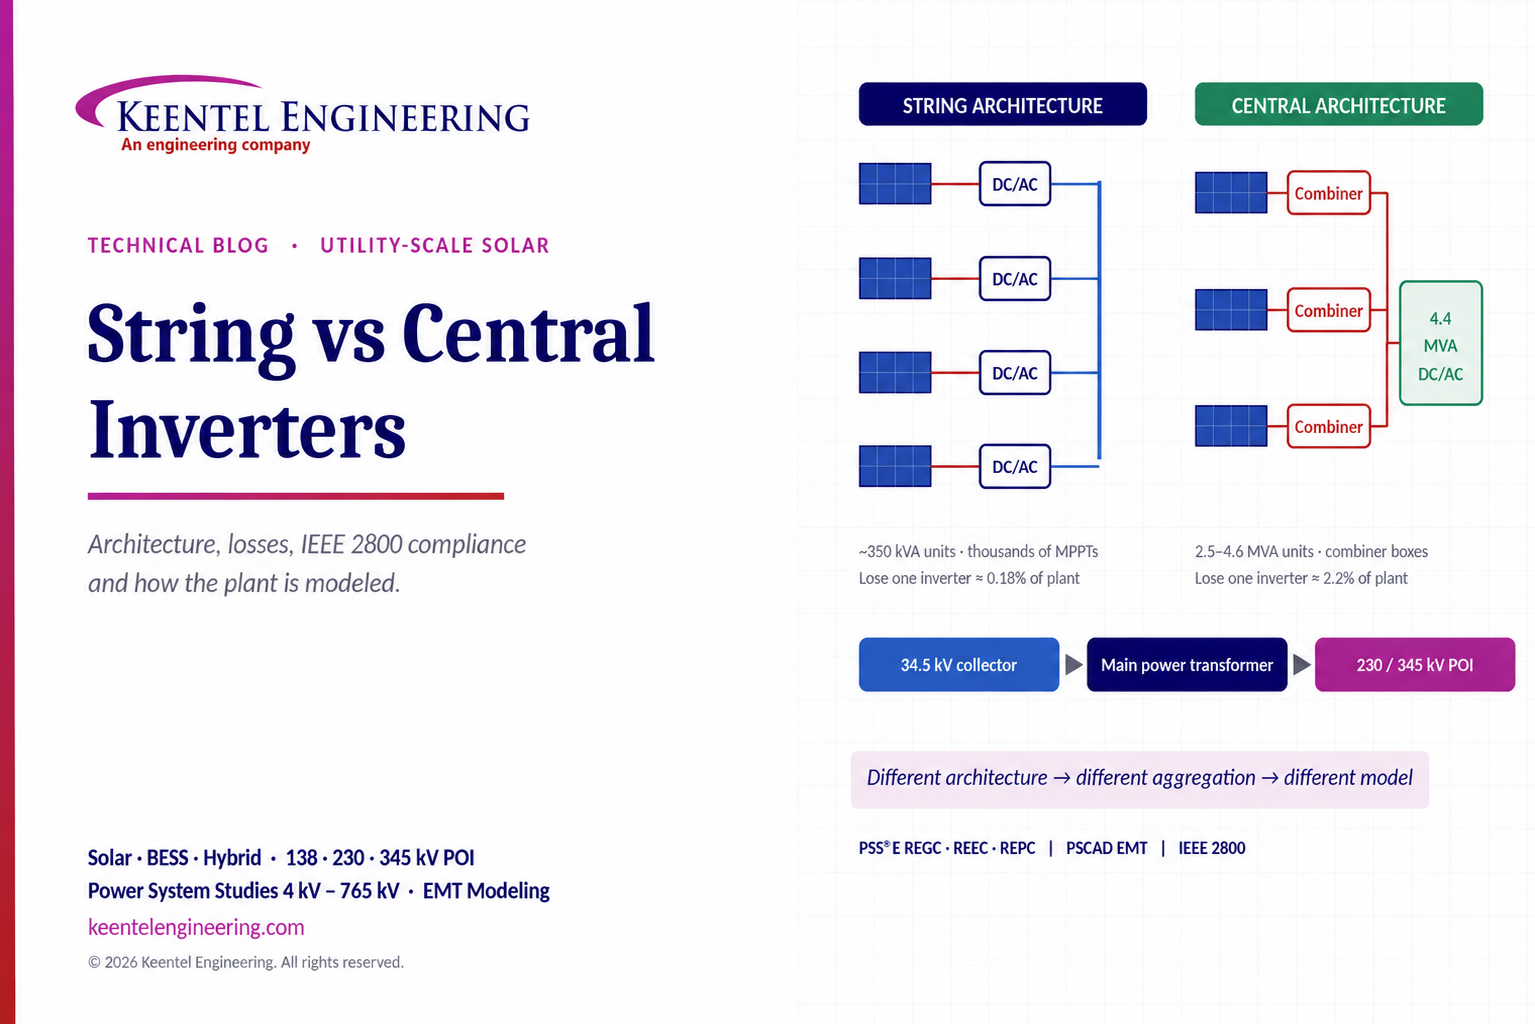
Compare string vs central inverters for utility-scale solar, including efficiency, maintenance, grid compliance, reactive power and interconnection studies.
By SANDIP R PATEL
•
October 3, 2026
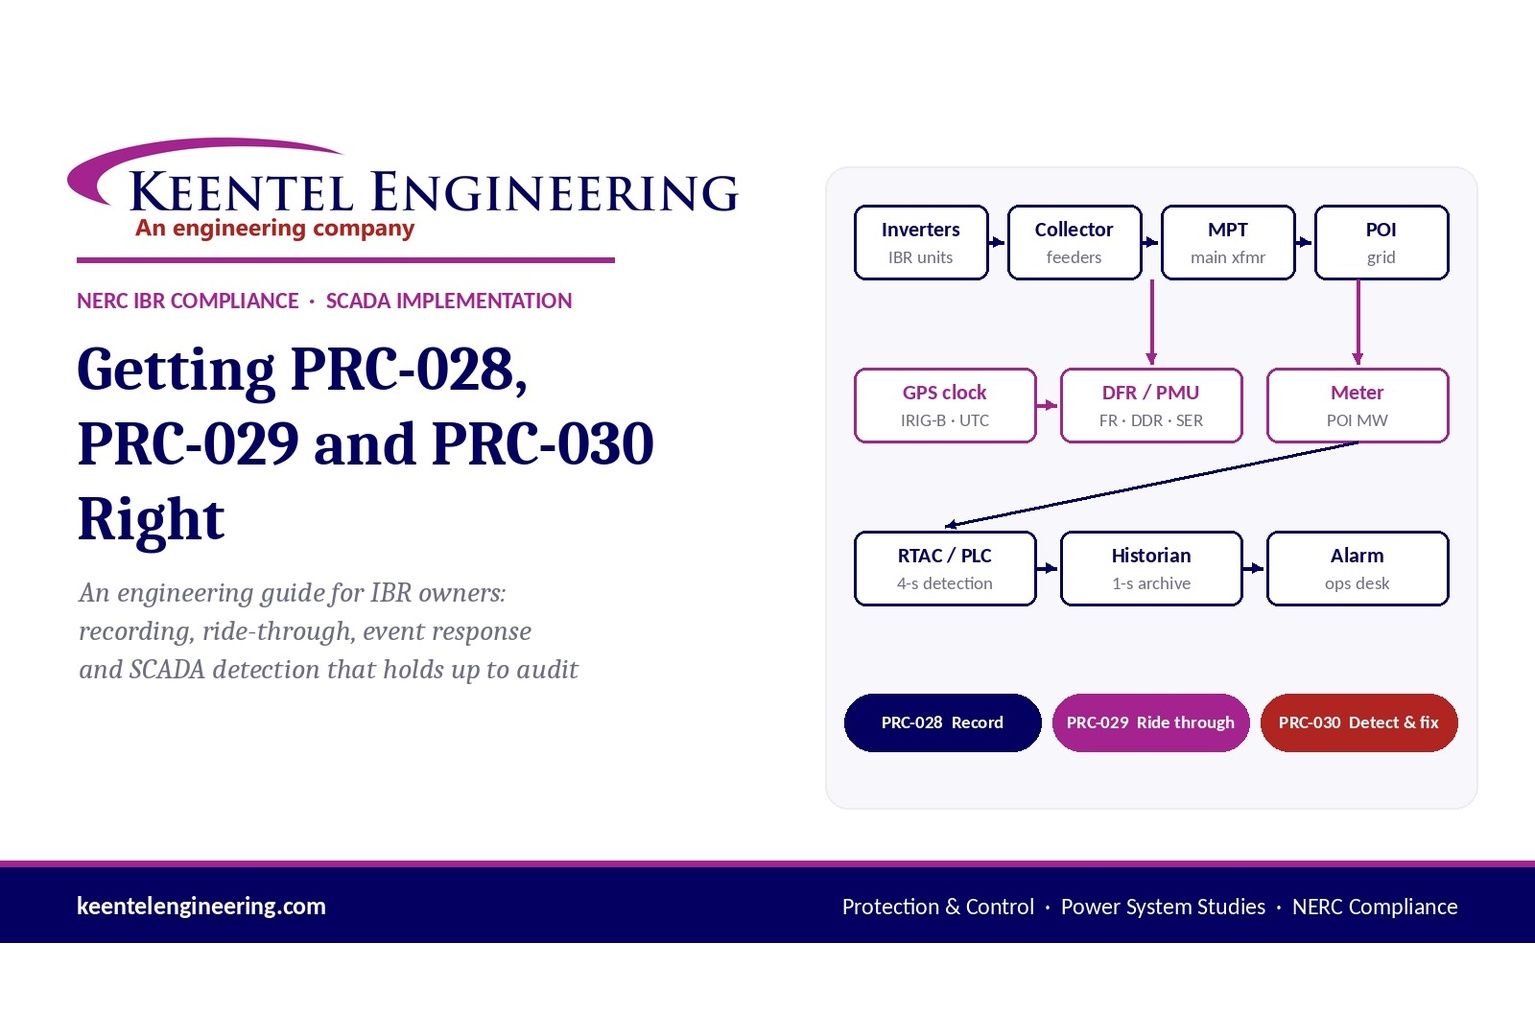
Engineering guide to PRC-028 disturbance recording, PRC-029 ride-through and PRC-030 event detection for inverter-based resources.
By SANDIP R PATEL
•
October 3, 2026
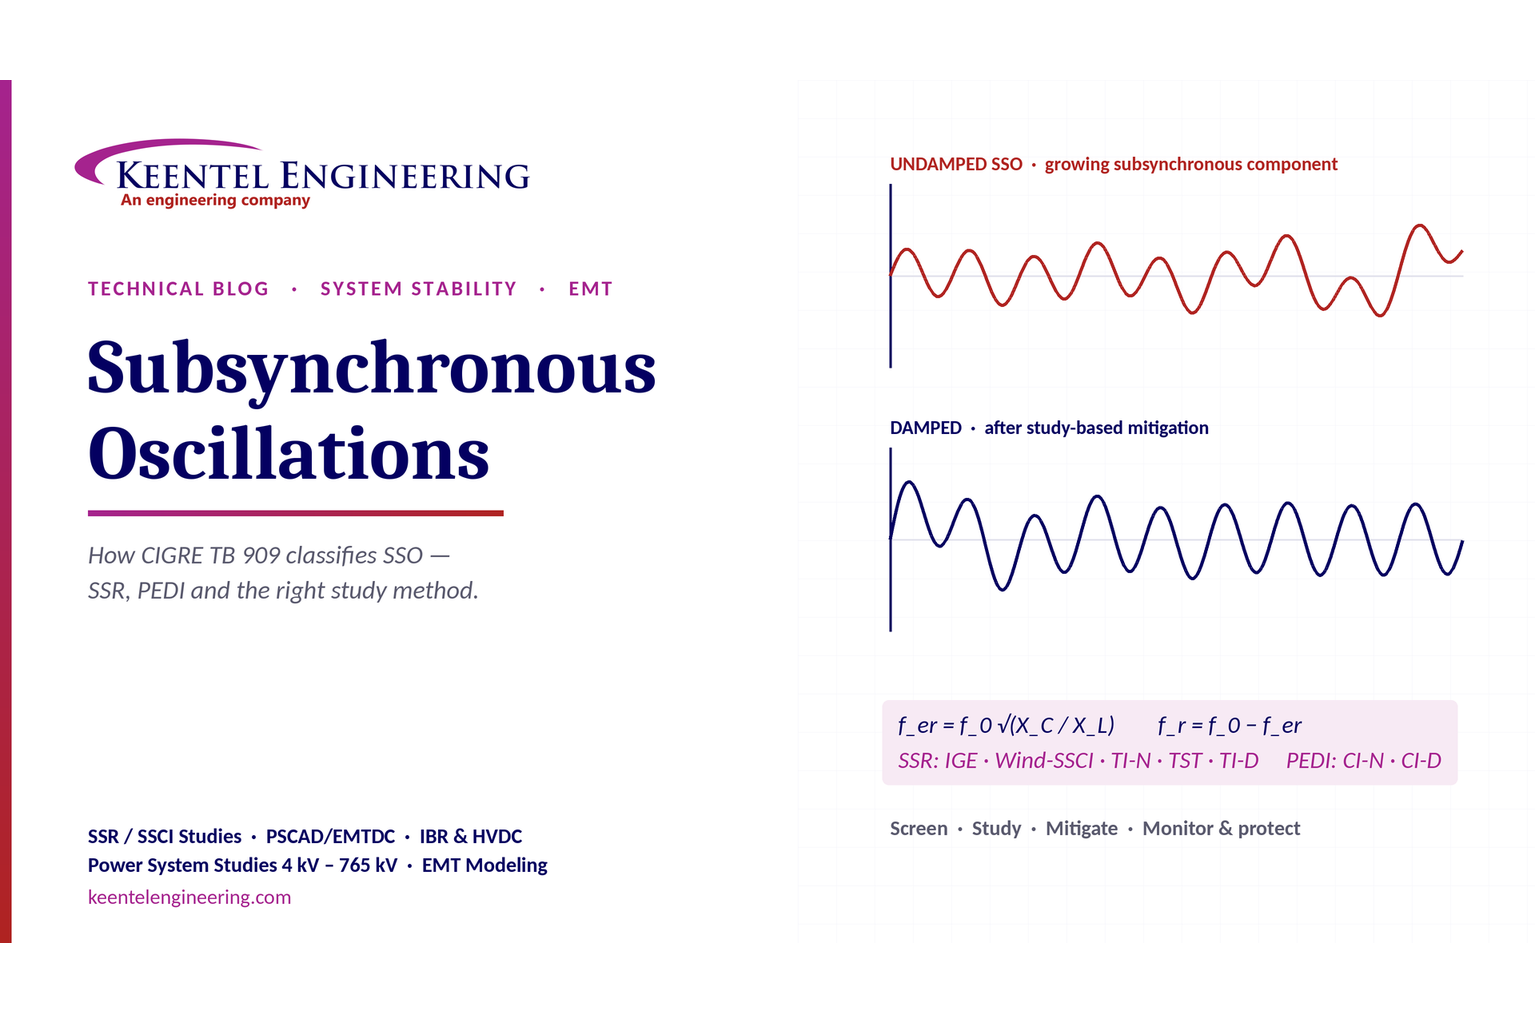
A practical guide to SSO classification, SSR, PEDI, Wind-SSCI, EMT analysis, mitigation and protection based on CIGRE TB 909.
By SANDIP R PATEL
•
October 3, 2026
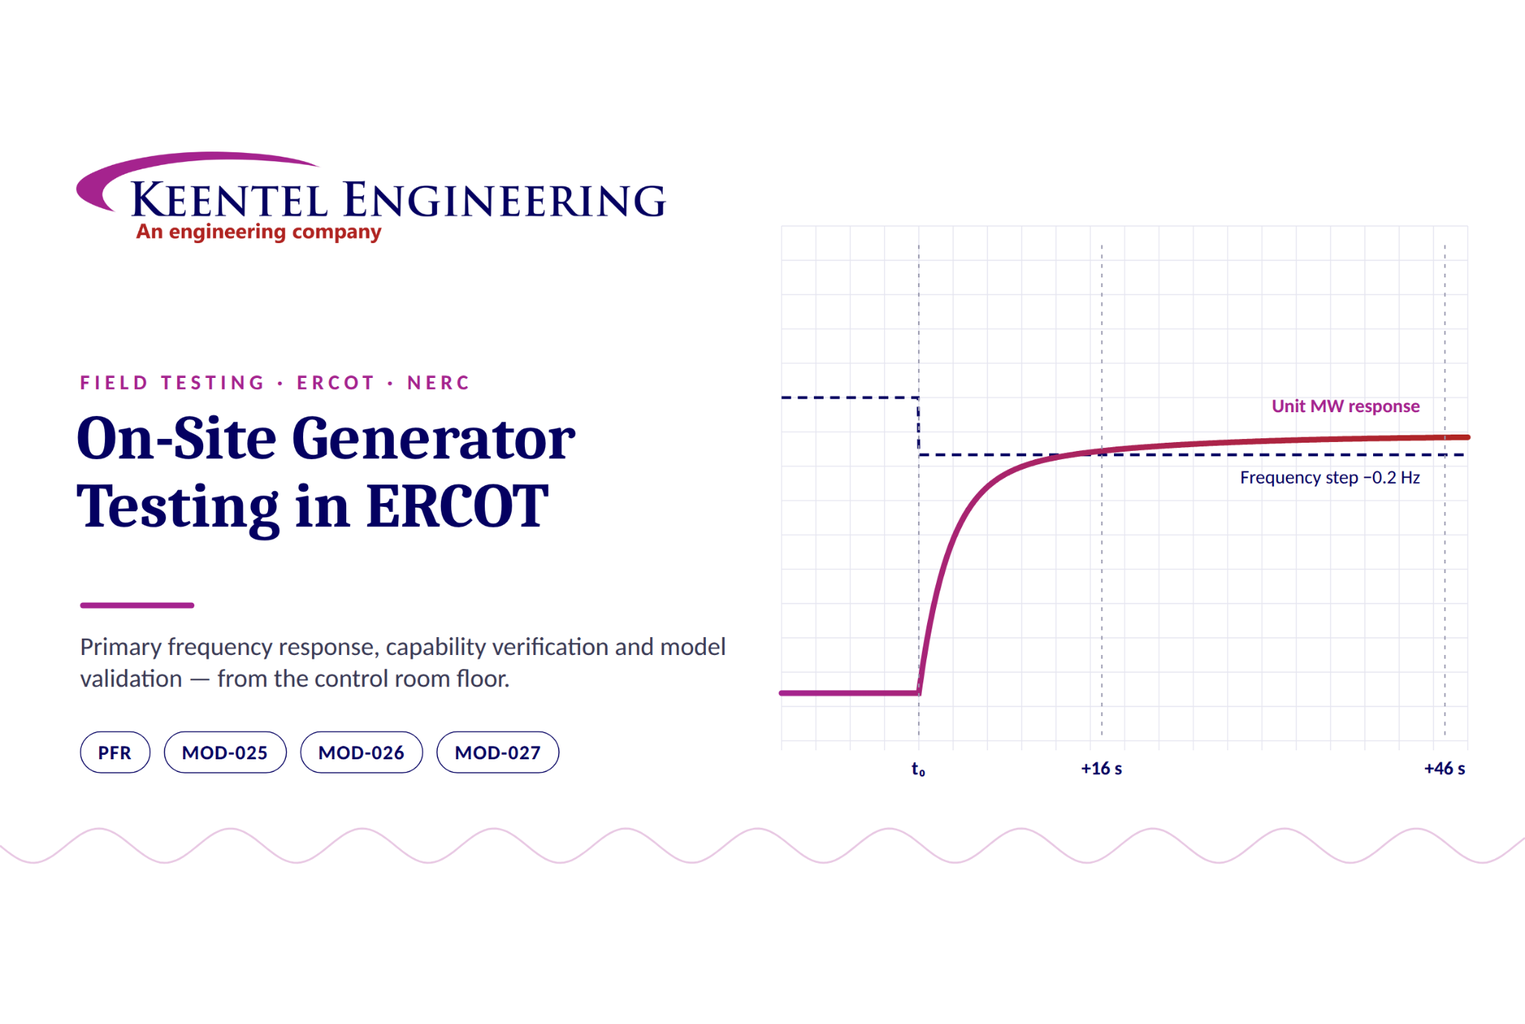
Learn ERCOT generator testing for PFR, MOD-025 and MOD-026/027, including staged tests, capability verification, dynamic models and field testing.
By SANDIP R PATEL
•
October 3, 2026
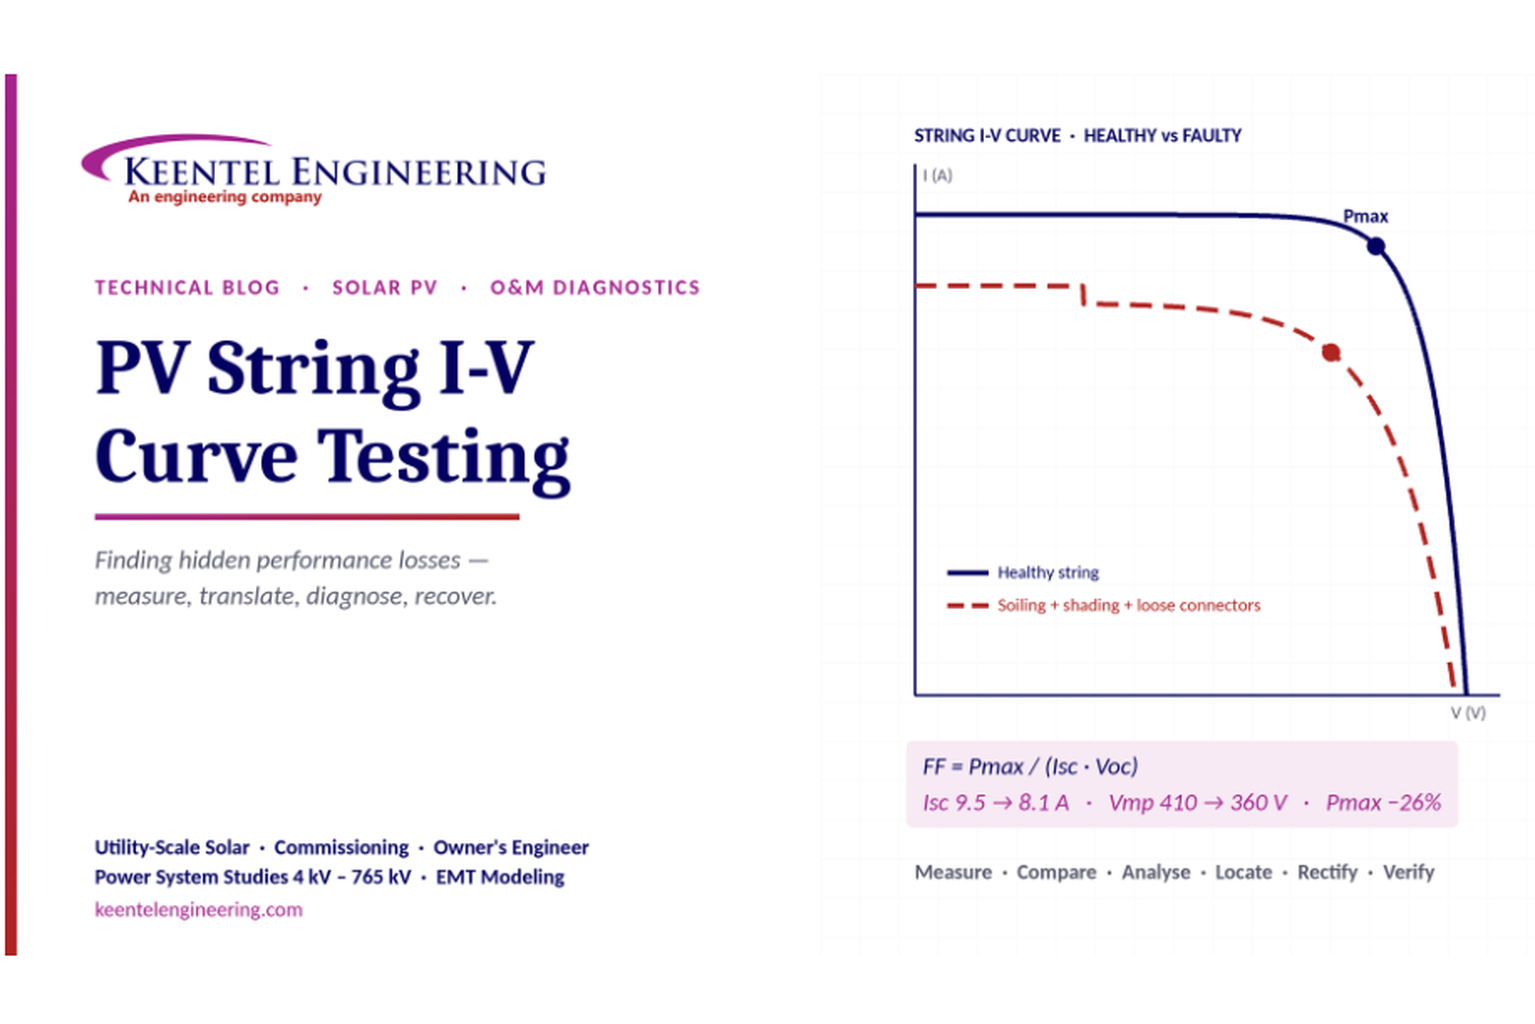
Learn how PV string I-V curve testing identifies hidden solar performance losses, including soiling, shading, mismatch, degradation, and wiring faults.

By SANDIP R PATEL
•
October 3, 2026
Learn how active harmonic filters work, how to size AHF systems, reduce VFD harmonics, calculate losses, and meet IEEE 519 TDD limits at the PCC.





