
A Coordinated Electric System Interconnection Review—the utility’s deep-dive on technical and cost impacts of your project.
Challenge: Frequent false tripping using conventional electromechanical relays
Solution: SEL-487E integration with multi-terminal differential protection and dynamic inrush restraint
Result: 90% reduction in false trips, saving over $250,000 in downtime
The three operating regions you have to design to
| Device | Output vs voltage | Response | Best suited to | Main limitations |
|---|---|---|---|---|
| Mechanically switched capacitor or reactor | Proportional to voltage squared | Seconds; discrete steps; limited switching operations per day | Steady-state reactive supply, voltage profile, loss reduction | No dynamic capability; step voltage change on switching; capability collapses when most needed |
| Static var compensator | Capacitive branches proportional to voltage squared | A few cycles; continuously controllable | Continuous control where cost matters and deep voltage support is not the driver | Square-law capability loss; harmonic filters are part of the plant and interact with the network |
| STATCOM | Approximately proportional to voltage — constant current capability | One to two cycles closed loop; converter response faster still | Voltage stability margin, weak interconnections, fast disturbance recovery, flicker and unbalance compensation | Higher capital cost; converter losses; adds a converter and its control dynamics to the network |
| Synchronous condenser | Governed by machine capability and excitation | Excitation response in the hundreds of milliseconds; inherent inertial response instantaneous | System strength and inertia, short-circuit contribution, black start support | Rotating plant with maintenance and losses; slower controlled response than a converter |
| STATCOM with energy storage | Reactive as a STATCOM, plus real power within the storage rating | As STATCOM for reactive; real power limited by storage | Where a real power deficiency is part of the problem | Cost and complexity of the storage; different failure and maintenance profile |
| Stage | Keentel scope | Outcome |
|---|---|---|
| Screening | Series-compensation proximity, radial contingency review, UIF and short-circuit ratio screening, frequency scans | Early identification of which SSO types apply |
| Detailed studies | PSCAD/EMTDC EMT studies with vendor real-code models, impedance-based and frequency-scan analysis | Clear evidence of stability margins or risk |
| Model quality | EMT model review, benchmarking against positive-sequence models, model acceptance support | Models that system operators accept |
| Mitigation | Control retuning recommendations with vendors, SSDC and bypass logic requirements, protection and monitoring specifications | Practical, coordinated solutions |
| Interconnection support | SSR and SSO study reports for ISO and utility requirements, response to reviewer comments | Fewer delays in the interconnection process |
Motor Protection and Relay Coordination: Reading and Building a TCC for US Medium-Voltage Systems
October 03, 2026 | Blog
Part A — PV String I-V Curve Testing at a Glance
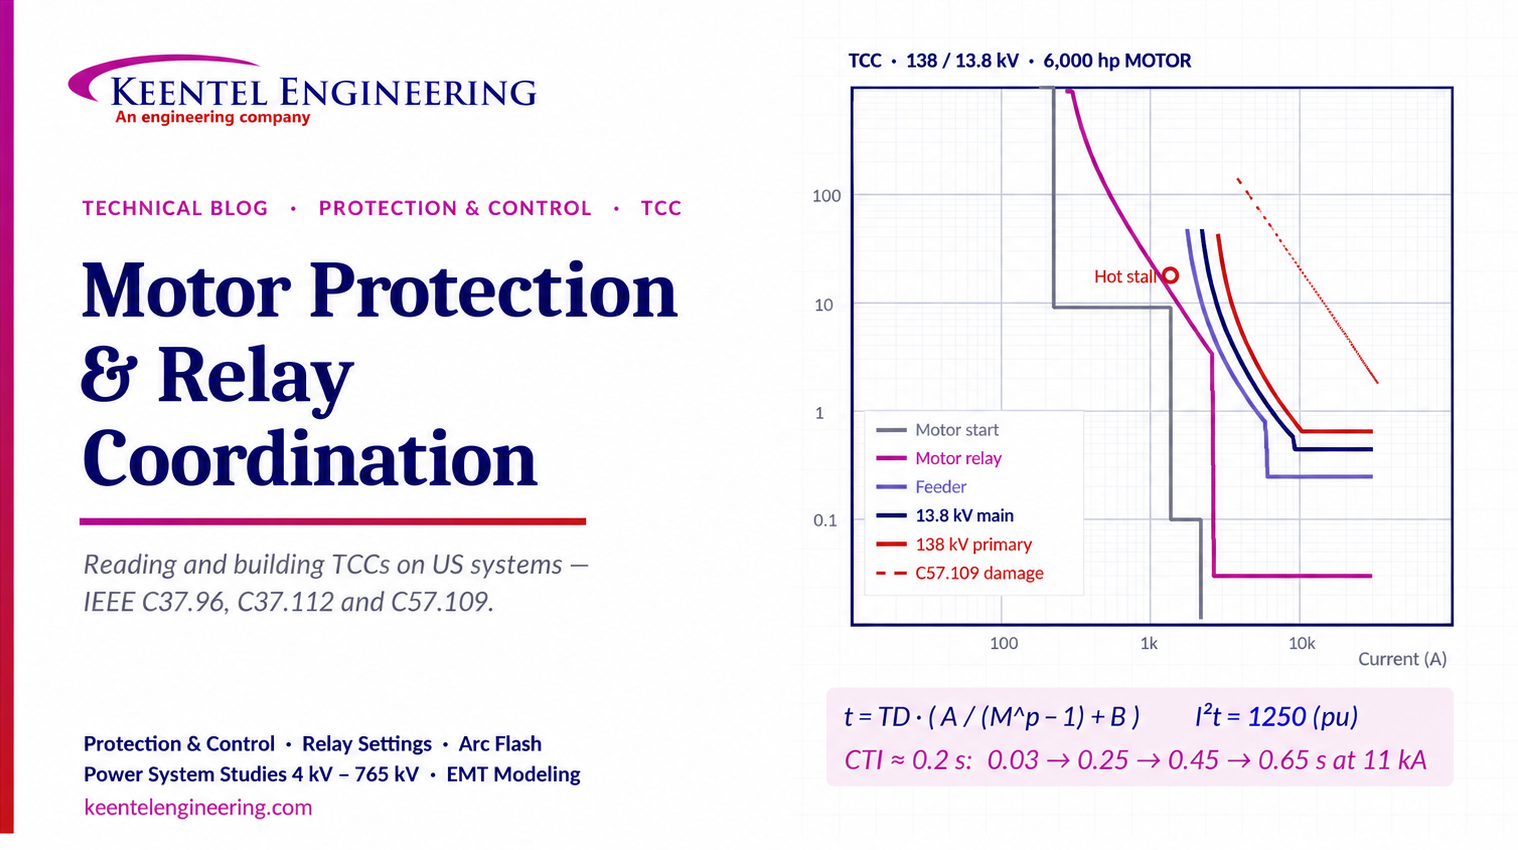
A time-current coordination (TCC) study answers one question: when a fault or overload occurs, does the device closest to it operate first, while every upstream device waits, ready to act as backup? For a large medium-voltage motor fed from a utility substation transformer, the answer depends on five curves: the motor's starting curve, its hot and cold thermal limits, the motor protection relay, the upstream relays separated by a coordination time interval, and the transformer's through-fault damage curve.
This article works through a typical US system: a 138 kV utility supply, a 138–13.8 kV substation transformer, and a 6,000 hp, 13.2 kV induction motor on the 13.8 kV bus.
The five things a motor TCC must show
| Element | What it represents | Coordination rule |
|---|---|---|
| Motor starting curve | Locked-rotor current during acceleration, including the asymmetrical peak at energisation | No protective device may trip during a normal start |
| Hot-start and cold-start thermal limits | Safe locked-rotor and overload time for a hot and a cold motor | The motor relay must operate before the hot-start limit, the more restrictive case |
| Motor protection relay | Thermal overload (49/51), instantaneous (50), unbalance (46) and other functions | Sits between the starting curve and the thermal limit, and clears faults fast |
| Upstream relays | Feeder, transformer secondary main, transformer primary and utility line relays | Each is separated from the next downstream device by a coordination time interval of about 0.2–0.3 s |
| Transformer damage curve | IEEE C57.109 through-fault capability | The transformer relay must clear before the damage curve is reached |
Selectivity and protection pull in opposite directions. Good coordination finds settings that are slow enough to be selective and still fast enough to protect equipment and limit arc-flash energy.
The example system
| Item | Value |
|---|---|
| Utility supply | 138 kV, three-phase, 60 Hz |
| Substation transformer T1 | 30 MVA, 138–13.8 kV, delta–wye resistance grounded, 10% impedance |
| T1 rated current | 125.5 A at 138 kV; 1,255 A at 13.8 kV |
| Maximum three-phase fault on the 13.8 kV bus | About 11 kA (1,100 A referred to 138 kV) |
| Motor M1 | 6,000 hp, 13,200 V nameplate on the 13.8 kV system, service factor 1.15 |
| Motor full-load current | About 227 A |
| Locked-rotor current | About 6 × FLA ≈ 1,360 A symmetrical |
| Acceleration time | About 8 s at rated voltage, longer at reduced voltage |
Any deviation from expected values needs attention. Small losses repeated across hundreds of strings add up to a large loss of generation.
Common faults and their curve signatures
| Fault | Isc | Voc | Curve shape |
|---|---|---|---|
| Uniform soiling or dust | Reduced | About normal | Normal shape, scaled down in current |
| Partial shading | Reduced on part of the curve | About normal | Steps or multiple knees where bypass diodes conduct |
| Module mismatch | Slightly reduced | About normal | Step-like or rounded knee |
| Weak or degraded module | Reduced | Reduced | Lower, smaller curve overall |
| Open or shorted cell, failed bypass diode | Normal or reduced | Reduced by about one substring | Voltage step; irregular curve |
| High series resistance (loose or poor connectors) | Normal | Normal | Softer slope near Voc, lower Vmp and fill factor |
| Low shunt resistance (cracked cells, PID) | Normal | Often reduced | Sloping plateau near Isc, lower fill factor |
Part B — Motor Protection and Relay Coordination: Reading and Building a TCC for US Medium-Voltage Systems
How to coordinate motor protection relays with upstream feeder and transformer protection, using IEEE and NEMA practice, US system voltages and a fully worked 138/13.8 kV example.
Why coordination studies matter
A large medium-voltage motor is often the most expensive single load in a plant and one of the hardest on the power system. It draws six or more times its full-load current when starting. It can be damaged in seconds if it stalls. And it sits at the bottom of a chain of protective devices that must all respond correctly to the same fault.
If the motor relay is set too sensitive, the motor trips during a normal start. If it is set too slow, a stalled or overloaded motor overheats. If upstream relays are not coordinated, a motor fault can trip the whole 13.8 kV bus or even the substation transformer. And if the transformer relay is too slow, a through fault can damage a transformer that may take a year or more to replace.
A time-current coordination study, plotted on a log-log TCC chart, is how engineers check all of these requirements at once. IEEE Std C37.96 (AC motor protection), IEEE Std C37.91 (transformer protection), IEEE Std C57.109 (transformer through-fault duration), NEMA MG 1 (motor performance) and NEC Articles 430 and 450 together define the US framework.
US system voltages and reference currents
A TCC plots time against current, so every curve must be referred to a common voltage base. On a 138/13.8 kV chart, the current scale for 138 kV devices is one-tenth of the 13.8 kV scale. Standard US nominal voltages from ANSI C84.1 used in industrial and utility work include 480 V, 4.16 kV, 13.8 kV, 34.5 kV, 69 kV, 115 kV, 138 kV and 230 kV. Medium-voltage motors are rated at utilisation voltages a little below the system nominal: 4,000 V motors on 4.16 kV systems and 13,200 V motors on 13.8 kV systems.
Rated current is calculated in the usual way:

For the motor, using a typical efficiency of 96% and power factor of 0.90:

Use nameplate full-load current for settings whenever it is available. The calculation is only a check.
1. The motor curve and starting current
The motor starting curve shows the current the motor draws from energisation until it reaches full speed. At standstill, the rotor presents a low impedance, so the motor draws locked-rotor current, typically 5–7 times full-load current for medium-voltage induction motors. NEMA MG 1 code letters define the locked-rotor kVA per horsepower for each design.
The curve has three parts:
- The asymmetrical inrush. For the first few cycles, the current contains a decaying DC offset that depends on the point on the voltage wave at which the breaker closes and on the X/R ratio of the circuit. The RMS asymmetrical current can reach about 1.5–1.6 times the symmetrical locked-rotor current. This is why the starting curve on the TCC has a short, higher step at the left of the time axis.
- Acceleration. Current stays near locked-rotor value while the motor accelerates, then falls as slip decreases. Acceleration time depends on load inertia, load torque and terminal voltage.
- Running. Current settles at the load current, at or below full-load current.
Voltage dip during starting matters. Locked-rotor torque varies with the square of terminal voltage, so a 10% voltage dip reduces torque by about 19% and lengthens acceleration time. Starting studies should model the actual source impedance and the transformer tap position.
For the example motor, locked-rotor current is about 1,360 A symmetrical and the initial asymmetrical current up to about 2,180 A.
2. Cold-start and hot-start thermal limits
During a start or a stall, rotor bars carry very high current and heat rapidly. The motor manufacturer supplies the safe stall time and thermal limit curves:
- Cold start: the motor starts from ambient temperature, so it has the most thermal margin.
- Hot start: the motor starts after running at rated load, so its windings and rotor are already hot and the allowable locked-rotor time is shorter.
NEMA MG 1 assumes a medium-voltage motor can make two starts in succession from cold, or one start from hot. Many motors also have a limited number of starts per hour.
The protection must be coordinated with the hot-start limit, because it is the more restrictive condition. Where the safe stall time is shorter than the acceleration time, which is common for high-inertia loads such as large fans, a time-overcurrent relay alone cannot separate a normal start from a stall. A speed switch or zero-speed input (device 14), an impedance-based stall element or a thermal model that tracks rotor heating is then needed.
3. The motor protection relay
A modern multifunction motor relay provides many protective elements. The ANSI/IEEE device numbers below are the standard US labels.
| Device | Function | Typical setting approach |
|---|---|---|
| 49 / 51 | Thermal overload / time overcurrent | Pickup about 1.05–1.15 × FLA, depending on service factor; curve below the hot-start limit and above the starting curve |
| 50 | Instantaneous phase overcurrent | Above the asymmetrical starting current; well below the minimum fault current |
| 50G / 51G | Ground fault | Low pickup on a zero-sequence CT; short delay coordinated with the grounding resistor rating |
| 46 | Current unbalance / negative sequence | Protects the rotor from unbalanced supply and single phasing |
| 48 | Incomplete sequence / locked rotor | Trips if the motor does not reach speed in the allowed time |
| 66 | Starts per hour / time between starts | Enforces the manufacturer's starting limits |
| 37 | Undercurrent / underpower | Detects loss of load, for example a dry-running pump |
| 27 / 59 | Under / overvoltage | Prevents operation outside the motor's voltage range |
| 87M | Motor differential | Fast, sensitive internal fault protection on large motors |
| 38 / 49T | Bearing and winding temperature (RTDs) | Biases the thermal model and gives alarms |
Setting the overload curve
The 49/51 curve on the TCC must:
- pass to the right of, and above, the motor starting curve, with margin for reduced-voltage starts;
- pass to the left of, and below, the hot-start thermal limit;
- allow the motor's service factor rating, consistent with NEC 430.32 overload limits.
Modern relays use a thermal model that tracks the motor's heat in real time, so the TCC curve is a snapshot. The real protection also remembers previous starts and running load.
Setting the instantaneous element
The instantaneous 50 element must ride through the asymmetrical starting current. For relays that respond to total RMS current, a pickup of about 1.6–2.0 times symmetrical locked-rotor current is common. Many digital relays filter the DC offset and allow a lower multiple; follow the relay manufacturer's guidance. For the example motor, a pickup near 2,200–2,700 A at 13.8 kV, with a short definite delay or none, clears motor terminal faults in about 2 cycles while ignoring starts.
Where the motor is fed by a fused contactor, the fuse provides short-circuit protection and the relay's 50 element must be blocked above the contactor's interrupting rating.
4. Coordination time interval: the ~200 ms rule
Moving upstream from the motor, each relay must wait long enough for the downstream device to clear the fault first. The difference in operating time between two devices at the same fault current is the coordination time interval (CTI). It must cover:
- the downstream breaker's interrupting time, typically 3–5 cycles (50–83 ms) for medium-voltage vacuum breakers;
- relay overtravel, which is essentially zero for digital relays but significant for electromechanical relays;
- relay timing tolerance, CT error and a safety margin.
Common practice is a CTI of about 0.2–0.3 s between digital relays on modern breakers, and 0.3–0.4 s where electromechanical relays are involved.
Inverse-time relays follow standard curve equations. IEEE Std C37.112 defines the US curve family:
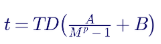
Here M is the multiple of pickup current, TD the time dial, and A, B and p the curve constants:
| IEEE curve | A | B | p |
|---|---|---|---|
| U1 Moderately inverse | 0.0515 | 0.1140 | 0.02 |
| U2 Inverse | 5.95 | 0.180 | 2.0 |
| U3 Very inverse | 3.88 | 0.0963 | 2.0 |
| U4 Extremely inverse | 5.67 | 0.0352 | 2.0 |
| U5 Short-time inverse | 0.00342 | 0.00262 | 0.02 |
Very inverse and extremely inverse curves coordinate well with fuses and motor thermal limits; moderately inverse curves suit systems where fault current varies widely.
The worked coordination ladder
For a three-phase fault of about 11 kA on the 13.8 kV system, the example settings give:
| Device | Location | Operating time at 11 kA (s) | Margin to next device (s) |
|---|---|---|---|
| Motor relay 50 | 13.8 kV motor feeder | 0.03 | 0.22 |
| Bus feeder relay 51 | 13.8 kV switchgear feeder | 0.25 | 0.20 |
| Transformer secondary main 51 | 13.8 kV main breaker | 0.45 | 0.20 |
| Transformer primary 51 | 138 kV, T1 high side | 0.65 | 0.20 |
| Utility line relay (backup) | 138 kV line terminal | ≥ 0.85 | — |
Each step keeps a 0.2 s interval at the maximum fault current, where curves are closest together. The check must be repeated at minimum fault current and at the instantaneous pickup thresholds, because inverse curves can converge or cross at lower currents.
5. The transformer damage curve
IEEE Std C57.109 defines how long a transformer can carry a through fault, a fault beyond its secondary terminals, before thermal or mechanical damage. Transformers are grouped into four categories by kVA:
| Category | Single-phase (kVA) | Three-phase (kVA) |
|---|---|---|
| I | 5–500 | 15–500 |
| II | 501–1,667 | 501–5,000 |
| III | 1,668–10,000 | 5,001–30,000 |
| IV | Above 10,000 | Above 30,000 |
The thermal part of the curve follows a constant I²t, anchored at 25 times rated current for 2 seconds:

For Categories II and III, a mechanical (frequent-fault) curve also applies when faults are expected to be frequent, for example on overhead-line or long cable feeders. For Category IV, the mechanical curve always applies. The mechanical curve shifts the protection requirement to shorter times at high fault currents, because winding forces scale with current squared.
Applying it to T1
T1 is 30 MVA, so it is a Category III transformer. For the 11 kA bus fault:

The transformer primary relay at 0.65 s operates well before the thermal limit. If the feeders are exposed to frequent faults, the mechanical curve governs and the margin must be checked against it as well.
The delta–wye ground-fault shift
For a single-line-to-ground fault on the wye-connected secondary of a delta–wye transformer, the per-unit current seen in each primary line is only about 58% of the per-unit secondary winding current. The primary phase relay therefore sees less current, and operates more slowly, than the secondary fault suggests. To check protection for this case, the damage curve plotted against the primary relay is shifted to the left by a factor of 0.58. A primary relay that clears three-phase faults comfortably can still fail to protect the transformer for secondary ground faults. Where the secondary is resistance grounded, as in this example, ground-fault current is limited and secondary ground protection carries the burden.
Inrush and the transformer instantaneous element
Energising T1 draws magnetising inrush current. A traditional rule of thumb is 8–12 times rated current for 0.1 s, plotted as a point that the primary relay curve must clear. The primary instantaneous element must also stay above the maximum through-fault current for a secondary fault, so that it only operates for faults on the high side or inside the transformer, usually with a margin of about 25–50%. Differential protection (87T) provides fast, selective clearing of internal faults on transformers of this size.
Building a coordination study step by step
- Gather data. One-line diagram, utility fault data at the point of interconnection, transformer nameplates and impedances, cable data, CT ratios, relay types, motor data sheets with starting and thermal curves.
- Calculate fault currents at every bus for maximum and minimum conditions, three-phase and ground, following IEEE Std 551 or ANSI C37 methods.
- Run a motor starting study to confirm acceleration time and voltage dip.
- Plot each protection path on its own TCC: motor, feeder, main, transformer primary and utility relay, with the motor starting curve, thermal limits and the transformer damage curve.
- Select settings that respect the CTI at maximum fault current and keep protection fast at minimum fault current.
- Check arc-flash results. Clearing times drive incident energy calculated by IEEE Std 1584; slow main breakers often produce the highest incident energy.
- Document and verify. Issue setting sheets, TCC plots and a report; confirm settings in the field during commissioning.
Common mistakes
| Mistake | Consequence |
|---|---|
| Using the cold-start limit instead of the hot-start limit | Motor can be damaged on a hot restart |
| Ignoring asymmetrical inrush when setting 50 elements | Nuisance trips on motor energisation |
| Checking CTI only at maximum fault current | Curves cross at lower currents and lose selectivity |
| Forgetting the 0.58 delta–wye shift | Transformer unprotected for secondary ground faults |
| Mixing voltage bases on one TCC | Curves plotted in the wrong place |
| Leaving long delays on main breakers | High arc-flash incident energy on the switchgear |
| Not updating the study after system changes | Utility fault current or new loads silently break coordination |
How Keentel Engineering helps
Keentel Engineering delivers protection and control engineering and power system studies from 4 kV to 765 kV.
| Stage | Keentel scope | Outcome |
|---|---|---|
| Short-circuit and motor starting studies | Maximum and minimum fault duty, motor acceleration and voltage dip | A correct basis for every setting |
| Protective device coordination | TCC studies for motors, feeders, mains, transformers and utility interfaces | Selective, fast and documented protection |
| Relay settings | Setting calculations and files for multifunction motor, feeder, transformer and line relays | Settings ready for commissioning |
| Arc-flash studies | IEEE 1584 incident energy, mitigation options and labels | Safer switchgear without losing selectivity |
| Field support | Commissioning support and witnessing, event analysis after misoperations | Confidence that the protection works as designed |
Planning a motor installation, substation upgrade or protection review? Talk to Keentel Engineering at (813) 389-7871, contact@keentelengineering.com, or book a 15-minute scoping call at calendly.com/keentel-engineering/15min.
Part C — Case Studies
The following are illustrative scenarios based on conditions typical of US industrial and utility facilities. They show how Keentel Engineering approaches protection coordination problems; site details are generalised and figures are rounded.
Case Study 1 — High-inertia fan motor tripping on hot restarts
Situation. A 4,000 hp, 4,000 V induced-draft fan motor on a 4.16 kV bus starts normally from cold but trips on overload during restarts after short outages.
Analysis. A motor starting study shows that, at the voltage dip seen during starting, acceleration takes about 22 s, while the manufacturer's hot safe stall time is about 18 s. No overload curve can both allow the start and protect the motor against a hot stall. The relay was set on the cold-start limit, with the thermal model's hot-start bias disabled.
Engineered solution. Add a zero-speed switch input so the relay can tell a stalled rotor from an accelerating one, enable the thermal model with hot/cold ratio and RTD biasing from the manufacturer's data, and add a starts-per-hour and time-between-starts limit (device 66).
Outcome. The motor can restart hot while remaining protected against a true stall, and the TCC shows clear separation between the starting curve and the protection.
Case Study 2 — Transformer exposed for secondary ground faults
Situation. An industrial substation with a 20 MVA, 69–13.8 kV delta–wye transformer has 13.8 kV feeders running overhead around the site. A protection review is triggered by a new utility fault-current notice.
Analysis. The coordination study shows the transformer primary phase relay clears three-phase secondary faults inside the IEEE C57.109 limits. Once the 0.58 delta–wye shift is applied for secondary ground faults, and the frequent-fault mechanical curve is used because of the overhead feeders, the primary relay curve crosses the damage curve at high currents.
Engineered solution. Add a dedicated secondary-side ground overcurrent element on the neutral CT with a short delay, retune the primary phase relay to a faster curve within the utility's coordination limits, and confirm that transformer differential protection covers internal faults.
Outcome. The transformer is protected for every fault type considered, and coordination with the utility's 69 kV line relays is maintained with a documented coordination interval.
Case Study 3 — Plant expansion with high arc-flash energy
Situation. A manufacturing plant adds two 13.2 kV process motors to its 13.8 kV switchgear. The updated arc-flash study shows very high incident energy at the switchgear main breaker section.
Analysis. To keep coordination with the new motor feeders, the main breaker relay had been set with a long time delay, so the main bus clears slowly for arcing faults. The coordination margin at the bus was larger than needed, and there was no fast bus protection.
Engineered solution. Implement zone-selective interlocking between the feeder and main relays, so the main trips fast for bus faults unless a feeder relay sees the fault, and add an arc-flash detection scheme with light sensors supervised by overcurrent. Re-check all TCCs to confirm selectivity is unchanged for feeder faults.
Outcome. Incident energy at the main bus falls substantially, the new motors start without nuisance trips, and every protection path keeps at least a 0.2 s coordination interval.
Ranges depend on module technology and test conditions. Use the module datasheet and the plant's own baseline curves as the primary reference.
Part D — Technical FAQ: Motor Protection and Relay Coordination
A time-current characteristic (TCC) curve shows how long a protective device takes to operate at each value of current. Plotted together on log-log axes, the TCC curves of all devices in a protection path show whether they are selective and whether they protect equipment within its damage limits.
Current changes with voltage across a transformer. On a 138/13.8 kV chart, 1,100 A at 138 kV is the same fault as 11,000 A at 13.8 kV. Plotting all devices on one voltage base, with a second current scale for the other voltage, keeps the curves in their true relative positions.
When a motor is energised, the current includes a decaying DC component that depends on the point on the voltage wave at closing and on the X/R ratio. For the first few cycles, the RMS current can be about 1.5–1.6 times the symmetrical locked-rotor current. Instantaneous elements must ride through that peak.
A cold-start limit applies when the motor starts from ambient temperature; a hot-start limit applies when it starts after running at full load. The hot motor has less thermal margin, so its allowable locked-rotor time is shorter. Protection must coordinate with the hot-start limit.
It is set from nameplate full-load current and service factor, typically about 1.05–1.15 times FLA, and must comply with NEC 430.32 overload limits. The curve must stay above the starting curve and below the hot-start thermal limit across the whole starting period.
Then an overcurrent curve cannot distinguish a normal start from a stall. Use a zero-speed switch, an impedance-based stall element or a thermal model that tracks rotor heating. This situation is common with high-inertia loads such as large fans and some compressors.
It is the minimum time difference between a downstream and an upstream device at the same current. It must cover the downstream breaker's clearing time, relay timing tolerances and a safety margin. With digital relays and modern vacuum breakers, about 0.2–0.3 s is common; electromechanical relays usually need 0.3–0.4 s.
At the maximum fault current where the devices overlap, and also at lower currents, including minimum fault and the pickup of each instantaneous element. Inverse curves with different shapes can come closer together, or cross, away from the maximum fault point.
IEEE Std C37.112 defines five: U1 moderately inverse, U2 inverse, U3 very inverse, U4 extremely inverse and U5 short-time inverse. Each follows t = TD × (A ÷ (M p
− 1) + B) with standard constants, so relays from different manufacturers produce the same curve for the same setting.
It is the through-fault capability curve defined in IEEE Std C57.109, showing how long the transformer can carry a fault current beyond its terminals before thermal or mechanical damage. The transformer's primary protection must operate before the curve is reached.
Category I covers 15–500 kVA three-phase; Category II covers 501–5,000 kVA; Category III covers 5,001–30,000 kVA; and Category IV covers units above 30,000 kVA. Larger categories require the mechanical, frequent-fault curve more often; Category IV always uses it.
For a secondary single-line-to-ground fault on a delta–wye transformer, the per-unit current in each primary line is about 58% of the secondary per-unit winding current. The primary phase relay sees less current, so the damage curve is shifted left by 0.58 to check that the relay still protects the transformer for that fault.
Inrush is commonly represented as a point at about 8–12 times rated current for 0.1 s. The primary relay's time and instantaneous elements must stay above that point so the transformer can be energised without tripping. Harmonic restraint in transformer differential relays handles the same problem for 87T protection.
Incident energy depends on arcing current and clearing time. Long delays added for selectivity, especially on main breakers, increase incident energy. Zone-selective interlocking, bus differential protection, arc-flash detection relays and maintenance switches reduce clearing time without sacrificing coordination.
Whenever the system changes: new motors or transformers, changes in utility fault current, relay replacements or setting changes. Many owners also review the study periodically, often every five years, in line with arc-flash study review practice under NFPA 70E.
References and Further Reading
Links were current at publication (October 2026).
- IEEE Std C37.96, IEEE Guide for AC Motor Protection. IEEE.
- IEEE Std C37.91, IEEE Guide for Protecting Power Transformers. IEEE.
- IEEE Std C57.109, IEEE Guide for Liquid-Immersed Transformers Through-Fault-Current Duration. IEEE.
- IEEE Std C37.112, IEEE Standard for Inverse-Time Characteristics Equations for Overcurrent Relays. IEEE.
- IEEE Std 1584, IEEE Guide for Performing Arc-Flash Hazard Calculations. IEEE.
- ANSI C84.1, Electric Power Systems and Equipment — Voltage Ratings (60 Hz). ANSI/NEMA.
- NEMA MG 1, Motors and Generators. NEMA.
- NFPA 70, National Electrical Code, Articles 430 and 450; NFPA 70E, Standard for Electrical Safety in the Workplace. NFPA.
- Transformer Overcurrent Protection Coordination (summary of IEEE C57.109 categories and curves). R. W. Patterson. https://relayman.org/papers/Transformer%20Overcurrent%20Protection%20Final%20Final%202015.pdf
Disclaimer
This article is general technical information for educational purposes. It is not engineering advice for any specific project and does not create a professional relationship. The example system, settings and operating times are illustrative; actual settings must be calculated from verified equipment data, utility fault information and manufacturer curves, and sealed by a licensed professional engineer where required. Verify the current edition of any standard or code before relying on it.
Case studies are illustrative scenarios based on typical project conditions, not records of specific client projects. Figures are rounded and indicative.
IEEE, ANSI, NEMA and NFPA standards are the property of their respective organisations. Keentel Engineering is not affiliated with or endorsed by these organisations or any equipment manufacturer.
| Office | Address | Phone |
|---|---|---|
| Head Office — Tampa | 400 N Ashley Dr STE #2600, Tampa FL 33602 | (813) 389-7871 |
| Austin | 5900 Balcones Drive STE 100, Austin TX 78731 | (512) 591-0752 |
| Sacramento | 1401 21st St Ste R, Sacramento CA 95811 | (916) 913-4524 |
| Baltimore | 306 W Redwood St STE 200, Baltimore MD 21201 | (410) 225-2181 |
contact@keentelengineering.com · keentelengineering.com · calendly.com/keentel-engineering/15min
State of Florida — Registry No. 36853, KEENTEL LLC, DBA: KEENTEL ENGINEERING
Copyright 1995–2026 Keentel Engineering. All Rights Reserved.

About the Author:
Sandip "Sonny" R. Patel, P.E.
IEEE Senior Member · Founder & CEO, Keentel Engineering
In 1995, Sonny Patel earned his Electrical Engineering degree from the University of Illinois. But degrees don't build legacies — action does.
For three decades, he has worked the power industry from every side of the table: 16 years as a utility engineer at Exelon/Commonwealth Edison; generation leadership across hydroelectric, industrial steam turbine, and a 9 GW renewable fleet; NERC Regional Entity Senior Compliance Engineer and Audit Team Lead, auditing some of the nation's largest utilities; and testing and commissioning lead on equipment up to 765 kV — the very top of the North American grid.Utility. Generator. Regulator. Consultant. Few engineers have seen all four seats. Fewer still have sat in them.
His experience spans nuclear, hydro, conventional generation, renewables, oil and gas, mining — and today's data centers, where he is authoring a three-book series on data center design. He is a Licensed Professional Engineer in six states and a Licensed Electrical Contractor in Florida (Unlimited EC) — he doesn't just design the work; he's qualified to stand behind its execution.Today, as Founder and CEO of Keentel Engineering, Sonny leads a nationwide team of engineers delivering substation design, power system studies, NERC compliance, and commissioning — done right, coast to coast.Three decades. Every side of the table. One standard: accountable engineering.
Services

Let's Discuss Your Project
Let's book a call to discuss your electrical engineering project that we can help you with.
About the Author:
Sandip "Sonny" R. Patel, P.E.
IEEE Senior Member · Founder & CEO, Keentel Engineering
In 1995, Sonny Patel earned his Electrical Engineering degree from the University of Illinois. But degrees don't build legacies — action does.
For three decades, he has worked the power industry from every side of the table: 16 years as a utility engineer at Exelon/Commonwealth Edison; generation leadership across hydroelectric, industrial steam turbine, and a 9 GW renewable fleet; NERC Regional Entity Senior Compliance Engineer and Audit Team Lead, auditing some of the nation's largest utilities; and testing and commissioning lead on equipment up to 765 kV — the very top of the North American grid.
Utility. Generator. Regulator. Consultant. Few engineers have seen all four seats. Fewer still have sat in them.
His experience spans nuclear, hydro, conventional generation, renewables, oil and gas, mining — and today's data centers, where he is authoring a three-book series on data center design. He is a Licensed Professional Engineer in six states and a Licensed Electrical Contractor in Florida (Unlimited EC) — he doesn't just design the work; he's qualified to stand behind its execution.
Today, as Founder and CEO of Keentel Engineering, Sonny leads a nationwide team of engineers delivering substation design, power system studies, NERC compliance, and commissioning — done right, coast to coast.Three decades. Every side of the table. One standard: accountable engineering.
Leave a Comment
Thank you for contacting us.
We will get back to you as soon as possible.
We will get back to you as soon as possible.
Oops, there was an error sending your message.
Please try again later.
Please try again later.
Related Posts
By SANDIP R PATEL
•
October 3, 2026
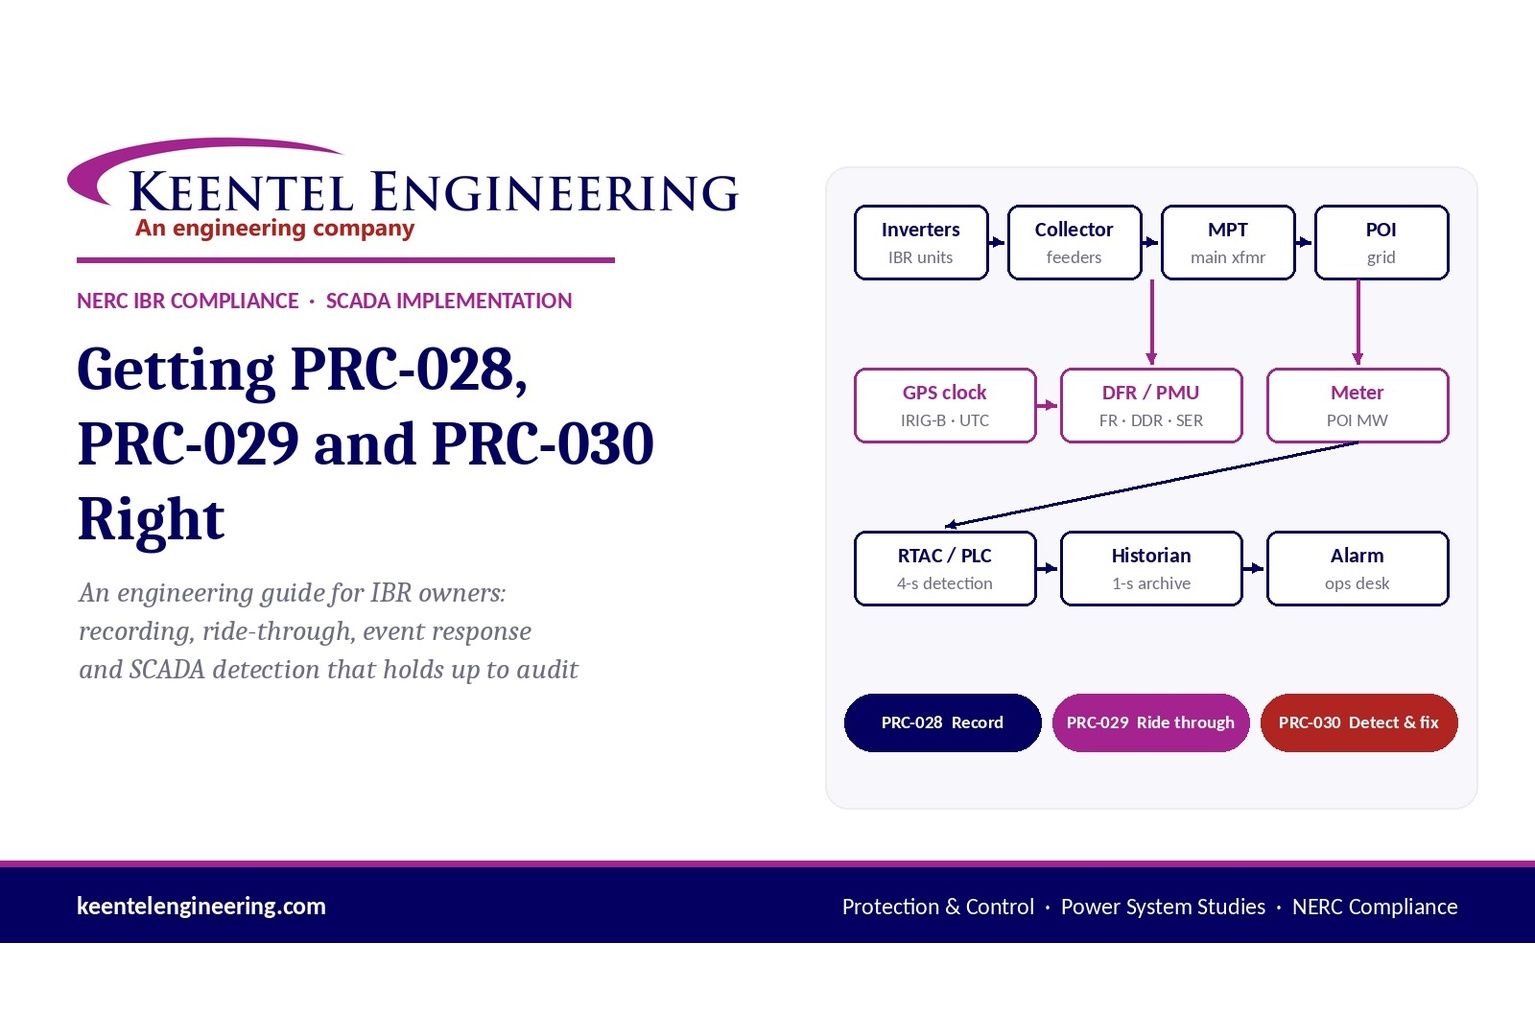
Engineering guide to PRC-028 disturbance recording, PRC-029 ride-through and PRC-030 event detection for inverter-based resources.
By SANDIP R PATEL
•
October 3, 2026
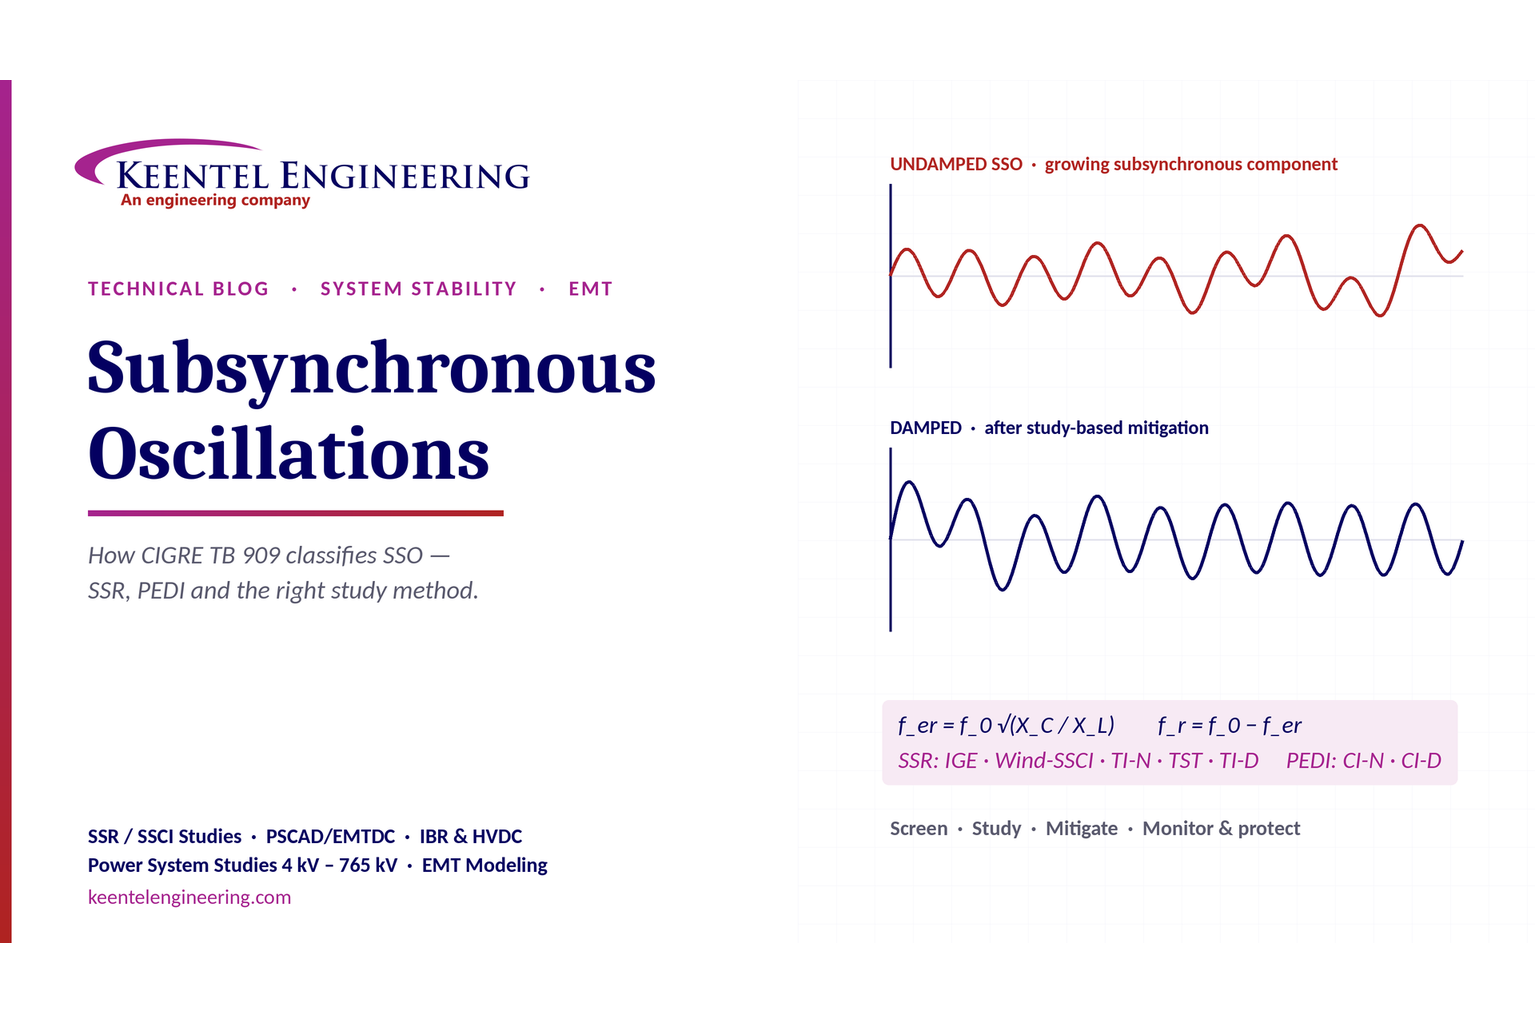
A practical guide to SSO classification, SSR, PEDI, Wind-SSCI, EMT analysis, mitigation and protection based on CIGRE TB 909.
By SANDIP R PATEL
•
October 3, 2026
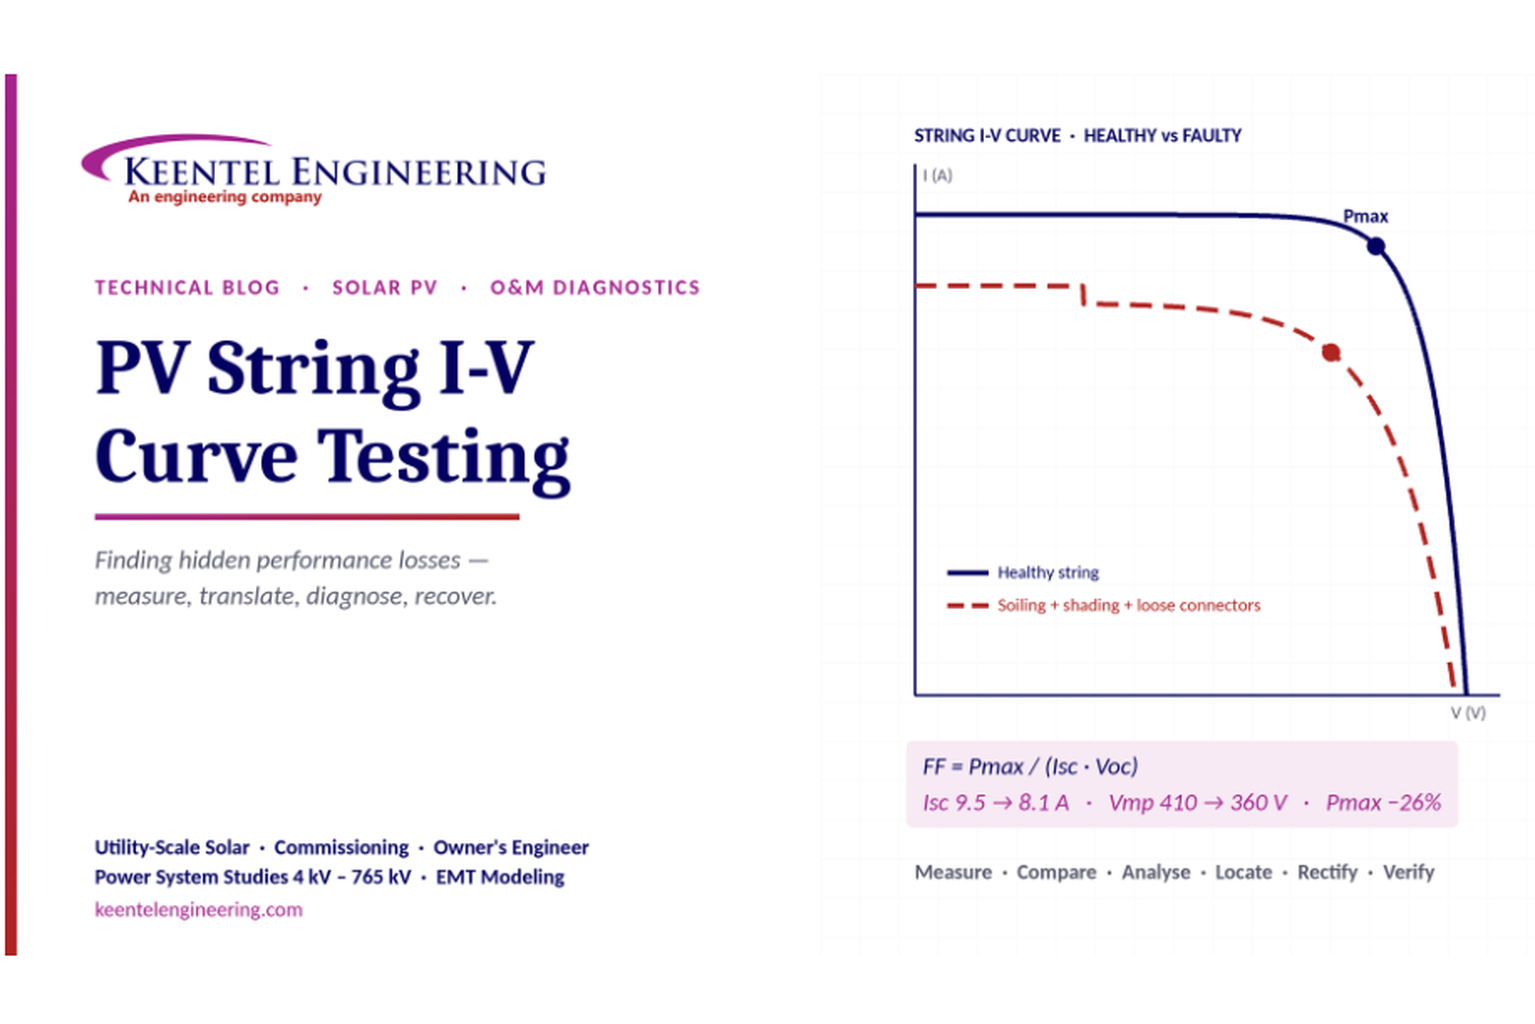
Learn how PV string I-V curve testing identifies hidden solar performance losses, including soiling, shading, mismatch, degradation, and wiring faults.
By SANDIP R PATEL
•
October 3, 2026
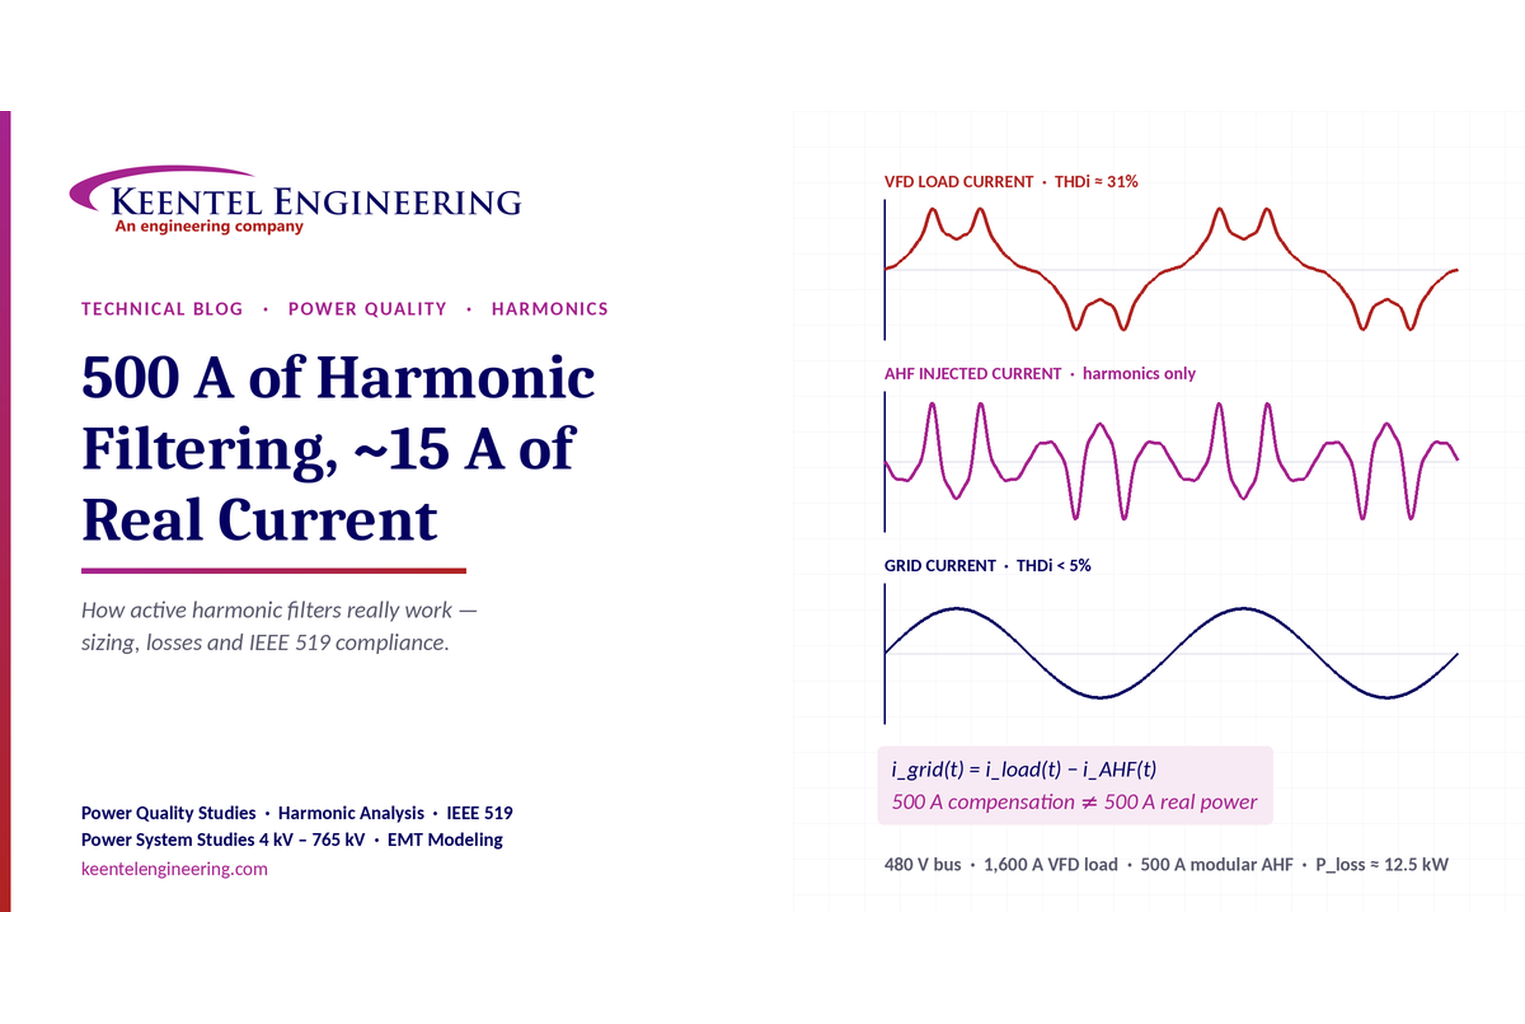
Learn how active harmonic filters work, how to size AHF systems, reduce VFD harmonics, calculate losses, and meet IEEE 519 TDD limits at the PCC.
By SANDIP R PATEL
•
October 3, 2026
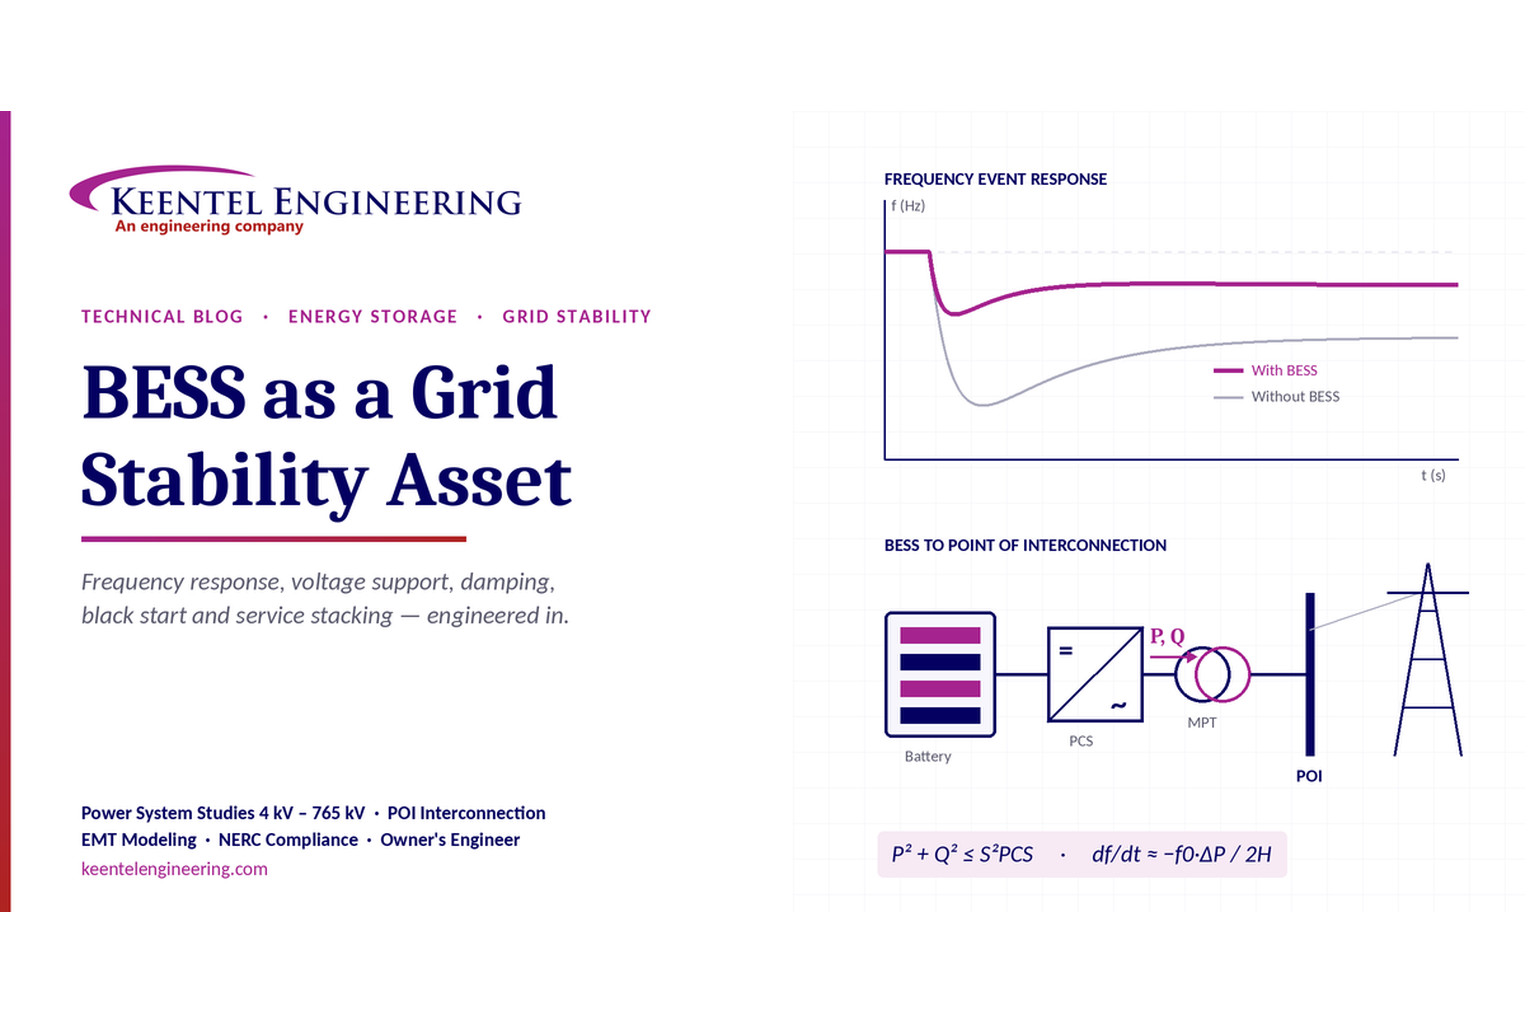
Learn how BESS supports grid stability through fast frequency response, voltage support, oscillation damping, black start, grid-forming controls and EMT studies.
By SANDIP R PATEL
•
September 30, 2026
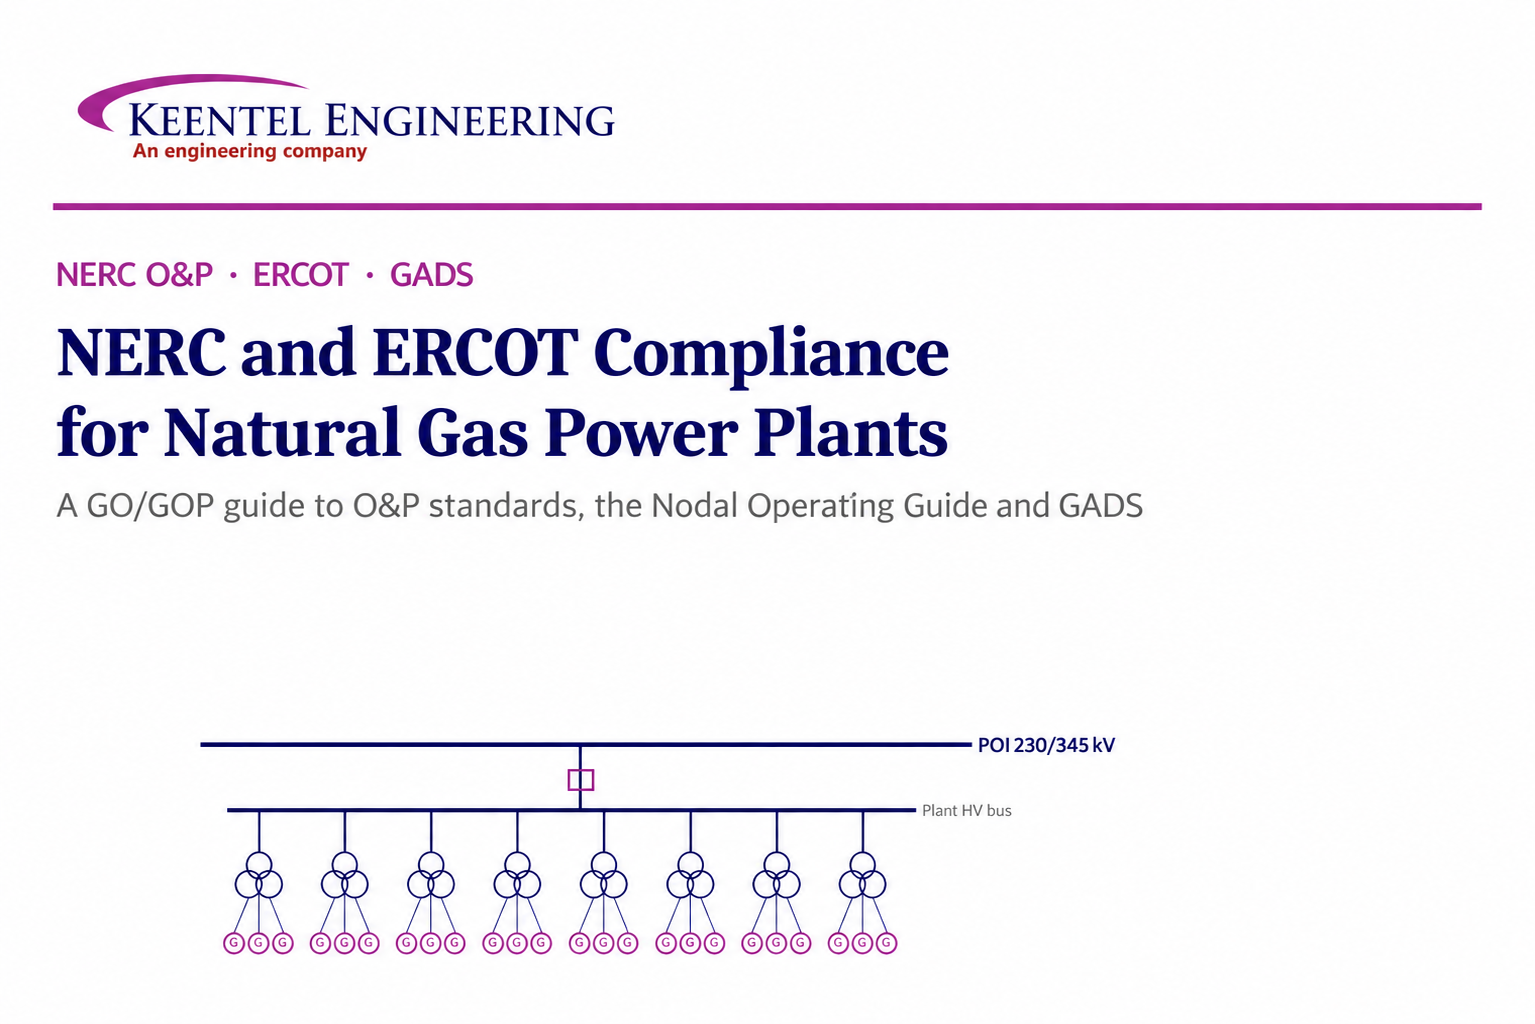
Learn NERC and ERCOT compliance requirements for natural gas power plants, including GO/GOP obligations, O&P standards, GADS reporting, and audits.
By SANDIP R PATEL
•
September 26, 2026
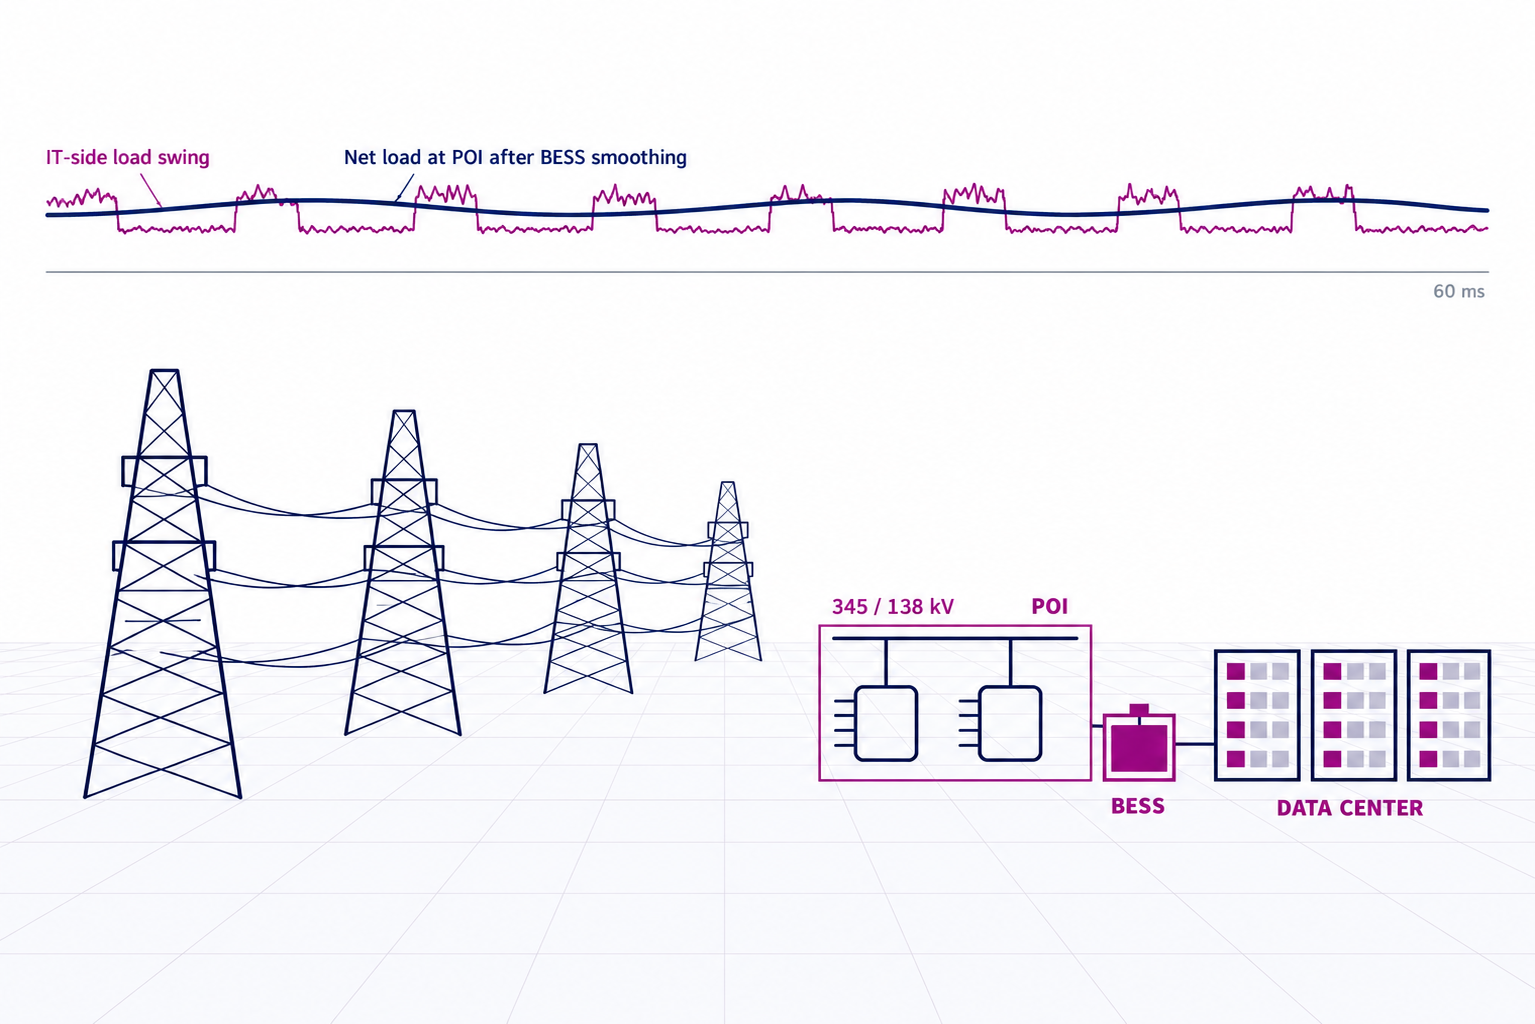
Learn how to prepare a MISO large-load interconnection package, including PSS®E models, BESS smoothing, harmonic data and transmission-owner requirements.

By SANDIP R PATEL
•
September 26, 2026
Learn where storage belongs in an 800 VDC AI data center, including capacitors, flywheels, BESS, fault current, protection, grounding, and EMT design.
By SANDIP R PATEL
•
September 26, 2026
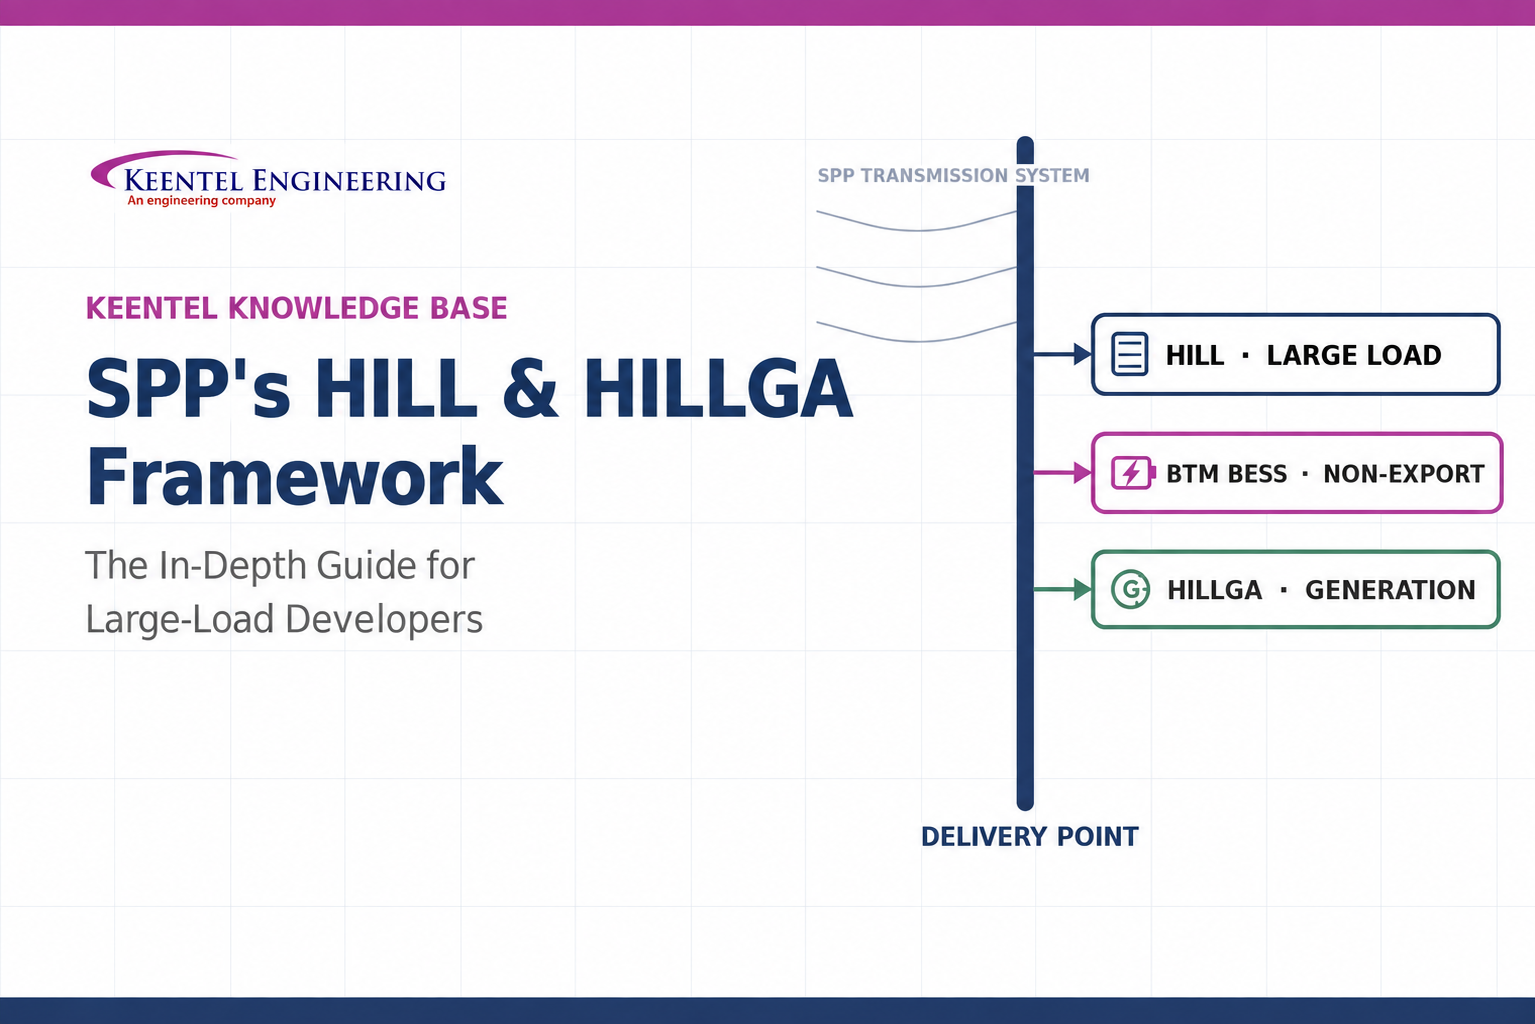
Learn how SPP’s HILL and HILLGA framework works for large-load projects, including studies, BTM generation, modeling, EMT requirements, and firm service.





