
A Coordinated Electric System Interconnection Review—the utility’s deep-dive on technical and cost impacts of your project.
Challenge: Frequent false tripping using conventional electromechanical relays
Solution: SEL-487E integration with multi-terminal differential protection and dynamic inrush restraint
Result: 90% reduction in false trips, saving over $250,000 in downtime
The three operating regions you have to design to
| Device | Output vs voltage | Response | Best suited to | Main limitations |
|---|---|---|---|---|
| Mechanically switched capacitor or reactor | Proportional to voltage squared | Seconds; discrete steps; limited switching operations per day | Steady-state reactive supply, voltage profile, loss reduction | No dynamic capability; step voltage change on switching; capability collapses when most needed |
| Static var compensator | Capacitive branches proportional to voltage squared | A few cycles; continuously controllable | Continuous control where cost matters and deep voltage support is not the driver | Square-law capability loss; harmonic filters are part of the plant and interact with the network |
| STATCOM | Approximately proportional to voltage — constant current capability | One to two cycles closed loop; converter response faster still | Voltage stability margin, weak interconnections, fast disturbance recovery, flicker and unbalance compensation | Higher capital cost; converter losses; adds a converter and its control dynamics to the network |
| Synchronous condenser | Governed by machine capability and excitation | Excitation response in the hundreds of milliseconds; inherent inertial response instantaneous | System strength and inertia, short-circuit contribution, black start support | Rotating plant with maintenance and losses; slower controlled response than a converter |
| STATCOM with energy storage | Reactive as a STATCOM, plus real power within the storage rating | As STATCOM for reactive; real power limited by storage | Where a real power deficiency is part of the problem | Cost and complexity of the storage; different failure and maintenance profile |
| Stage | Keentel scope | Outcome |
|---|---|---|
| Screening | Series-compensation proximity, radial contingency review, UIF and short-circuit ratio screening, frequency scans | Early identification of which SSO types apply |
| Detailed studies | PSCAD/EMTDC EMT studies with vendor real-code models, impedance-based and frequency-scan analysis | Clear evidence of stability margins or risk |
| Model quality | EMT model review, benchmarking against positive-sequence models, model acceptance support | Models that system operators accept |
| Mitigation | Control retuning recommendations with vendors, SSDC and bypass logic requirements, protection and monitoring specifications | Practical, coordinated solutions |
| Interconnection support | SSR and SSO study reports for ISO and utility requirements, response to reviewer comments | Fewer delays in the interconnection process |
PV String I-V Curve Testing: Finding Hidden Performance Losses
October 03, 2026 | Blog
Part A — PV String I-V Curve Testing at a Glance
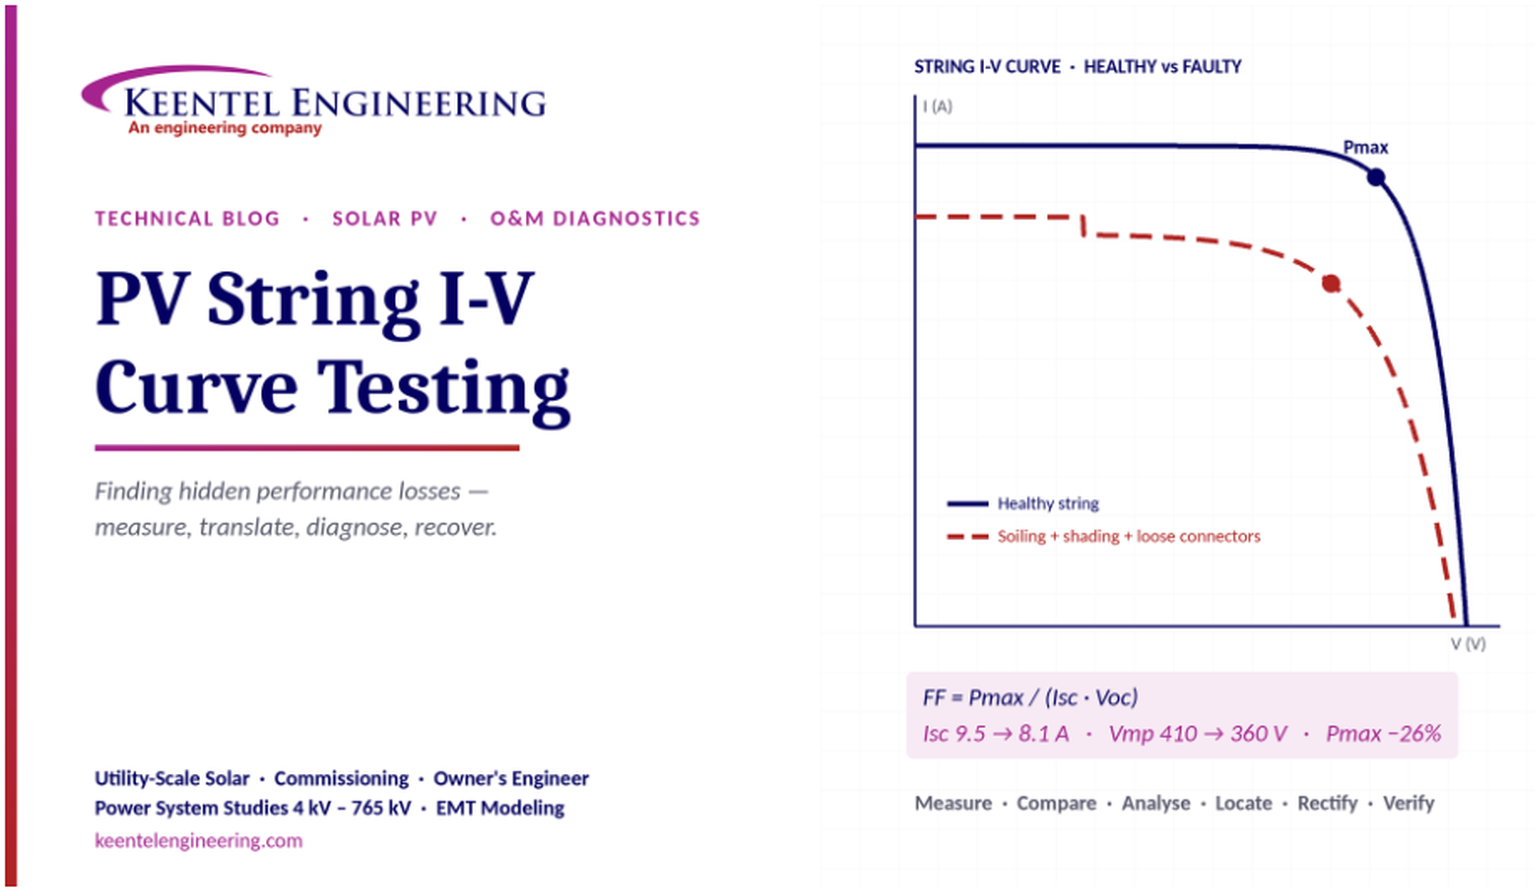
Same sun, same plant, different results. Two strings side by side can see identical irradiance yet deliver very different energy. Plant SCADA usually cannot tell you why. A string I-V curve can: it shows the full current–voltage behaviour of the string and exposes soiling, shading, mismatch, failed bypass diodes, degradation and high-resistance connections, each with its own recognisable signature.
The five parameters that define a string
| Parameter | Definition | What it tells you |
|---|---|---|
| Isc | Short-circuit current, at V = 0 | Total current; driven by irradiance, reduced by soiling, shading and weak modules |
| Voc | Open-circuit voltage, at I = 0 | Total voltage; affected by temperature, module count, open or shorted cells and bypass diodes |
| Imp | Current at the maximum power point | Current delivered at the operating point |
| Vmp | Voltage at the maximum power point | Voltage at the operating point; sensitive to series resistance |
| Pmax | Maximum power, Imp × Vmp | Overall string health |
| FF | Fill factor, Pmax ÷ (Isc × Voc) | How "square" the curve is; falls with resistive and mismatch losses |
Any deviation from expected values needs attention. Small losses repeated across hundreds of strings add up to a large loss of generation.
Common faults and their curve signatures
| Fault | Isc | Voc | Curve shape |
|---|---|---|---|
| Uniform soiling or dust | Reduced | About normal | Normal shape, scaled down in current |
| Partial shading | Reduced on part of the curve | About normal | Steps or multiple knees where bypass diodes conduct |
| Module mismatch | Slightly reduced | About normal | Step-like or rounded knee |
| Weak or degraded module | Reduced | Reduced | Lower, smaller curve overall |
| Open or shorted cell, failed bypass diode | Normal or reduced | Reduced by about one substring | Voltage step; irregular curve |
| High series resistance (loose or poor connectors) | Normal | Normal | Softer slope near Voc, lower Vmp and fill factor |
| Low shunt resistance (cracked cells, PID) | Normal | Often reduced | Sloping plateau near Isc, lower fill factor |
The six-step field troubleshooting flow
- Measure: run the I-V curve test and record irradiance, temperature and the curve.
- Compare: compare with neighbouring strings, the expected model and historical baselines.
- Analyse: identify the loss type from the curve signature and quantify its severity.
- Locate: find the exact fault: string, module, connector or cable.
- Rectify: clean, repair or replace as needed.
- Verify: re-test and confirm the string has recovered.
Part B — PV String I-V Curve Testing: Finding Hidden Performance Losses
How to measure, translate and read string I-V curves, and how to turn them into recovered energy on utility-scale and commercial PV plants.
Why SCADA alone is not enough
A utility-scale plant may have thousands of strings feeding a few dozen inverters. Plant SCADA typically sees inverter or combiner-level data, where a 20% loss on a few strings disappears into the average. Even string-level current monitoring reports only the operating point the inverter's MPPT chose, not why that point moved.
An I-V curve tracer sweeps the string from short circuit to open circuit and records the entire characteristic. Each type of fault distorts that curve in a recognisable way. That is what makes the I-V curve the most diagnostic single test available at string level.
The physics behind the curve
A PV cell, module or string is commonly modelled with the single-diode equation:

- I_L is the light-generated current, proportional to irradiance.
- I_0 and n describe the diode; N_s is the number of cells in series and V_t is the thermal voltage.
- R_s is series resistance: cell metallisation, ribbons, connectors and cables.
- R_sh is shunt resistance: leakage paths through cell defects and cracks.
Two simple slope rules make field interpretation much easier:
- Near Isc, the slope of the curve is set mainly by shunt resistance. A plateau that tilts downward signals low R_sh.
- Near Voc, the slope is set mainly by series resistance. A curve that leans over instead of dropping steeply signals high R_s.
The fill factor summarises how square the curve is:
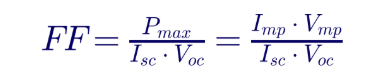
Healthy crystalline silicon strings typically show a fill factor of roughly 0.75–0.82. A falling fill factor with normal Isc and Voc almost always points to resistive or mismatch losses.
Irradiance and temperature: why raw readings mislead
Isc rises almost linearly with irradiance. Voc falls as cell temperature rises, typically by about 0.25–0.30% per °C for modern crystalline modules, and Pmax falls by about 0.29–0.40% per °C, depending on technology. Use the module datasheet coefficients.
A string measured at 820 W/m² and 52 °C cell temperature cannot be compared directly with its datasheet values at STC (1,000 W/m², 25 °C). Measurements must be translated to a common reference. IEC 60891 gives standard translation procedures. In simplified form:


Here G is irradiance, T is cell temperature, α and β are the current and voltage temperature coefficients, and κ is a curve-correction factor. Most modern curve tracers apply this automatically, but the result is only as good as the irradiance and temperature inputs.
Measuring correctly: conditions and set-up
Good data starts with good conditions. Key requirements drawn from IEC 61829 and field practice:
| Item | Requirement or good practice |
|---|---|
| Irradiance level | At least 400 W/m² of stable irradiance in the plane of the array; at least 700 W/m² when results will be translated to STC |
| Irradiance stability | Clear sky; avoid moving cloud; repeat any curve taken during a change |
| Temperature sensor | Flat sensor on the module backsheet, mid-module, at least 10 cm from the junction box |
| Time of day | Within a few hours of solar noon to limit angle-of-incidence and spectral effects |
| Trackers | Hold the tracker at a fixed angle during the sweep, and align the sensor with it |
| Bifacial modules | Measure or estimate rear-side irradiance; front-only translation overstates the loss |
| Instrument rating | Tracer rated for the string's maximum DC voltage (1,000 V or 1,500 V) and current |
| Baseline | Record curves for every string at commissioning; they become the reference for O&M |
IEC 62446-1 includes I-V curve testing among the additional (Category 2) commissioning tests. Many owners now specify it for 100% of strings at commissioning and for a representative sample, plus every suspect string, during operation.
Reading the curve: diagnostic signatures in detail
Soiling and dust
Uniform soiling reduces the light reaching every cell, so Isc and Imp fall together while the curve keeps its normal shape. Voc changes very little because it depends on irradiance only logarithmically. The test: compare the Isc ratio (measured ÷ expected, after translation) across strings. A plant-wide drop suggests soiling or a sensor problem; a localised drop suggests site-specific soiling such as dust from an access road.
Partial shading
When some cells are shaded, their current falls below the rest of the string. Bypass diodes then conduct around the shaded substrings, and the curve develops steps, or "multiple knees". The inverter's MPPT may settle on a local maximum and leave further energy behind. Typical causes are vegetation, structures, row-to-row shading at low sun angles, and tracker backtracking errors.
Module mismatch
Modules with different current capability in the same string force the string to operate at a compromise. The curve shows a rounded knee or small steps. Mismatch grows with uneven degradation, mixed module bins after replacements, and uneven soiling.
Weak or degraded modules
General degradation, from light-induced or thermal ageing, reduces both current and voltage. The whole curve shrinks. Comparing with the commissioning baseline shows the rate of degradation, which can then be checked against the module warranty.
Open or shorted cells and bypass diode failures
A typical module has three bypass-diode substrings. A shorted bypass diode removes one substring permanently, so the string Voc drops by about one-third of a module's Voc. An open-circuit or cracked cell can force a substring into bypass. Either way, a clean voltage step from the expected Voc is the signature. A shorted diode is also a fire-safety concern, because it can overheat under reverse conditions.
High series resistance
Loose, corroded or cross-mated connectors, damaged cables and poor crimps add series resistance. Isc and Voc stay close to normal, but the curve leans over near Voc, Vmp drops and the fill factor falls. High-resistance joints are also hot spots: an infrared scan of the suspect string usually finds them quickly, and they should be treated as a fire risk.
Low shunt resistance and PID
Cracked cells and potential-induced degradation (PID) create leakage paths. The plateau near Isc tilts downward and the fill factor drops. PID typically affects modules at the negative end of the string first, so per-module testing or electroluminescence imaging along the string shows a characteristic pattern.
Key diagnostic ratios
| Ratio | Healthy range (indicative) | Deviation suggests |
|---|---|---|
| Isc measured ÷ Isc expected | 0.97–1.03 | Soiling, shading, sensor error, current mismatch |
| Voc measured ÷ Voc expected | 0.98–1.02 | Missing module, bypass diode, PID, temperature error |
| Fill factor | ≈ 0.75–0.82 for crystalline silicon | Series or shunt resistance, mismatch |
| Imp ÷ Isc | ≈ 0.92–0.96 | Values outside the range indicate measurement or curve errors |
| Vmp ÷ Voc | ≈ 0.78–0.86 | Low values point to series resistance or shading |
| Pmax measured ÷ Pmax expected | ≥ 0.95 after allowing for degradation | Any significant shortfall needs root-cause analysis |
Ranges depend on module technology and test conditions. Use the module datasheet and the plant's own baseline curves as the primary reference.
A worked field example
A 10-module string of nominally 370 W modules shows low current in routine I-V testing. After translation to STC, the results compare with the expected values as follows:
| Parameter | Expected (STC) | Measured (translated) | Change |
|---|---|---|---|
| Isc | 9.50 A | 8.10 A | −14.7% |
| Voc | 490 V | 482 V | −1.6% |
| Imp | 9.00 A | 7.60 A | −15.6% |
| Vmp | 410 V | 360 V | −12.2% |
| Pmax | 3.69 kW | 2.74 kW | −25.8% |
| Fill factor | 0.79 | 0.70 | −0.09 |
Reading the curve.
- Isc is down about 15% while Voc is almost unchanged. That is a current-type loss: soiling and shading, not a missing module.
- Vmp is down about 12% and the fill factor has fallen from 0.79 to 0.70. The curve leans over near Voc, pointing to added series resistance.
- A small notch in the curve suggests one substring is in bypass during part of the sweep: partial shading.
Inspection findings. Heavy dust on the modules, two loose connectors and slight shading from an adjacent structure.
Actions. Clean the modules, re-make and torque-check the connectors (replacing any cross-mated pairs with matched connectors), and remove the shading source.
After repair. Re-testing gives Isc 9.40 A, Imp 8.95 A, Vmp 405 V and Pmax 3.62 kW, about 98% of expected. The remaining gap is consistent with normal module degradation.
What it is worth. About 0.88 kW is recovered on this one string. At a specific yield of around 1,700 kWh per kW per year, that is roughly 1,500 kWh per year. Across a few hundred affected strings on a utility-scale plant, the recovered generation becomes material, before counting the fire risk removed with the loose connectors.
Combining I-V testing with other diagnostics
| Method | Best at finding | How it complements I-V testing |
|---|---|---|
| Infrared thermography (IEC TS 62446-3) | Hot spots, hot connectors, bypass diodes in conduction, string outages | Locates the fault the I-V curve has identified |
| Electroluminescence (EL) imaging | Cracked cells, PID patterns, inactive cell areas | Confirms the cause of shunt or mismatch losses |
| Insulation resistance testing | Ground faults, damaged cables | Detects safety faults that may not affect the curve |
| String current monitoring and SCADA analytics | Persistent under-performance trends | Tells you which strings to trace first |
| Drone inspection | Large-area visual and thermal survey | Narrows the sample for I-V testing on big plants |
A practical O&M programme uses SCADA analytics and drone thermography to find suspect areas, I-V curves to diagnose them, and IR or EL imaging to pinpoint the exact module or connector.
Safety: DC is unforgiving
- Use the right PPE. Insulated gloves, eye and face protection, arc-rated clothing appropriate to the hazard assessment, and safety footwear.
- Treat every string as live. PV strings generate voltage whenever light falls on them. They cannot be switched off at the source.
- Never open a connector under load. Break the circuit with the designated DC disconnect, string fuse holder or combiner switch first. Opening an MC4-type connector under load can draw a sustained DC arc.
- Isolate DC and AC sides before connecting the tracer, following the site's lockout/tagout procedure and the manufacturer's test procedure.
- Check earthing and insulation first. A ground fault can make exposed metalwork live.
- Use a tracer rated for the system voltage. On 1,500 V plants, confirm the instrument, leads and adapters carry the right voltage and measurement-category rating.
- Follow the applicable electrical safety standard, such as NFPA 70E in the United States, including DC arc-flash and shock risk assessment.
Utility-scale considerations
- Sampling strategy. Test 100% of strings at commissioning to set the baseline. In operation, test a statistically meaningful sample plus every string that analytics flag.
- Contractual acceptance. I-V results support EPC punch lists, capacity tests and module warranty claims, but only if test conditions, translation method and instrument calibration are documented.
- 1,500 V and long strings. Higher string voltages magnify the energy in a DC arc and demand instruments and adapters rated for the voltage.
- Trackers and bifacial modules. Tracker angle, backtracking and rear-side irradiance all affect the curve and must be controlled or measured.
- Data management. Store curves with string IDs, timestamps and conditions so trends can be tracked over the life of the plant.
Keentel Engineering supports PV plant owners, developers, lenders and EPCs across the project lifecycle as part of its
utility-scale renewable energy
and
owner's engineer services.
How Keentel Engineering helps
| Stage | Keentel scope | Outcome |
|---|---|---|
| Design review | String sizing, voltage and temperature checks, connector and cable specification, protection and grounding review | Fewer latent faults built into the plant |
| Commissioning | IEC 62446-1 test planning, witnessing and data review; baseline I-V dataset requirements | A defensible baseline and a clean punch list |
| Performance assessment | Analysis of I-V, IR and SCADA data; translation and loss quantification | Losses ranked by cause and by value |
| Root cause and remediation | Fault investigation, remediation scope, warranty claim technical support | Energy recovered and risks closed out |
| Owner's engineer | Independent oversight of EPC and O&M contractors, acceptance and capacity testing | Delivered performance matches the contract |
Suspect your PV plant is leaving energy on the table? Talk to Keentel Engineering at (813) 389-7871, contact@keentelengineering.com, or book a 15-minute scoping call at calendly.com/keentel-engineering/15min.
Part C — Case Studies
The following are illustrative scenarios based on conditions typical of utility-scale and commercial PV plants. They show how Keentel Engineering approaches
PV performance problems; site details are generalised and figures are rounded.
Case Study 1 — Single-axis tracker plant with a hidden connector problem
Situation. A 100 MWac single-axis tracker plant reports one inverter block producing about 4% less energy than its neighbours. Inverter and transformer data show nothing abnormal.
Analysis. SCADA string-current analytics identify about 60 strings in the block running below their peers. I-V curves on those strings show normal Isc and Voc but a reduced fill factor and a curve that leans over near Voc, the classic series-resistance signature. Thermography finds hot connectors on most of the affected strings, and inspection traces them to field-installed connectors from a different manufacturer mated to the module leads.
Engineered solution. Replace every cross-mated connector pair with matched connectors from a single manufacturer, re-crimp suspect field terminations, and add connector compatibility to the plant's spare-parts and installation procedures.
Outcome. Re-tested strings return to within normal fill factor range, the block's energy deficit closes, and a latent fire risk is removed across the block.
Case Study 2 — Commercial rooftop plant with potential-induced degradation
Situation. A 2 MW commercial rooftop plant with transformerless string inverters shows output falling faster than the module warranty allows, worst in humid summer months.
Analysis. I-V curves show reduced Voc and fill factor, with a tilted plateau near Isc. Per-module testing along affected strings, confirmed by electroluminescence imaging, shows the worst damage at the negative end of each string, the characteristic pattern of potential-induced degradation.
Engineered solution. Install PID recovery and prevention equipment compatible with the inverters, verify inverter grounding configuration, replace the most severely affected modules, and support a warranty claim with the documented I-V and EL evidence.
Outcome. Voc and fill factor recover over the following months on most affected modules, the degradation rate returns to warranty limits, and the claim is supported by translated, documented test data.
Case Study 3 — Bifacial plant commissioning baseline
Situation. A 50 MWac bifacial plant is approaching substantial completion. The owner's contract requires I-V testing of 100% of strings before acceptance.
Analysis. The commissioning test plan sets irradiance, sensor alignment, rear-side irradiance measurement and translation requirements before testing begins. The data review flags a small percentage of strings with Voc about one-third of a module low, indicating shorted bypass diodes, plus several strings with one module fewer than designed, and a few strings whose labels do not match the as-built drawings.
Engineered solution. The EPC replaces the affected modules, corrects the string count and labelling, and re-tests every flagged string. The final dataset, with conditions and translation method documented, is handed to the owner as the plant's performance baseline.
Outcome. The plant is accepted with a closed punch list, and O&M starts with a complete, trustworthy baseline for every string for future comparison and warranty claims.
Part D — Technical FAQ: PV String I-V Curve Testing
1. What is an I-V curve test?
It is a measurement that sweeps a PV string, module or cell from short circuit to open circuit while recording current and voltage. The result is the full current–voltage characteristic, from which Isc, Voc, Imp, Vmp, Pmax and fill factor are extracted. Because each fault distorts the curve differently, it is a diagnostic test as well as a performance test.
2. How is I-V testing different from what SCADA shows?
SCADA and string monitors record the operating point chosen by the inverter's MPPT, usually aggregated across many strings. The I-V curve shows the whole characteristic of one string at one moment. It reveals why a string is under-performing, not just that it is.
3. What irradiance is needed for valid I-V testing?
At least 400 W/m² of stable irradiance in the plane of the array is a common minimum. When results will be translated to STC, IEC 61829 recommends at least 700 W/m². Higher, stable irradiance gives more accurate translation.
4. Why must results be translated to STC?
Isc depends on irradiance and Voc depends on cell temperature, so raw readings change through the day. Translating to STC (1,000 W/m², 25 °C cell temperature) using IEC 60891 methods lets strings, days and datasheet values be compared fairly.
5. How should the irradiance and temperature sensors be installed?
The irradiance reference cell should be in the plane of the array within ±2° and matched to the module technology. The temperature sensor should be a flat sensor on the module backsheet, mid-module, at least 10 cm from the junction box. Poor sensor placement is the most common cause of false readings.
6. What is fill factor and what is a good value?
Fill factor is Pmax divided by Isc × Voc. It measures how square the curve is. Healthy crystalline silicon strings typically sit around 0.75–0.82; a lower value with normal Isc and Voc points to resistive or mismatch losses.
7. How does soiling appear on the curve?
Uniform soiling lowers Isc and Imp in proportion while the shape stays normal and Voc barely changes. Non-uniform soiling, such as heavy dirt along the bottom edge of modules, behaves more like partial shading and can create steps.
8. Why does shading create steps in the curve?
Shaded cells produce less current than the rest of the string. Bypass diodes switch in around the shaded substrings, so the string effectively has two or more operating regions. Each transition appears as a step, or knee, in the curve.
9. What does a voltage step of about one-third of a module mean?
Most modules have three bypass-diode substrings. A Voc deficit of about one-third of a module Voc usually means one substring is permanently bypassed, typically because of a shorted bypass diode or an open cell circuit. It should be located and repaired, because a shorted diode can overheat.
10. How can I tell series resistance from shunt resistance problems?
Look at the slopes. High series resistance makes the curve lean over near Voc and reduces Vmp. Low shunt resistance makes the plateau near Isc slope downward. Both reduce fill factor, but they point to different causes: connections and cabling for series, cell damage or PID for shunt.
11. What is potential-induced degradation and how does I-V testing reveal it?
PID is a leakage-driven degradation caused by high voltage between cells and the grounded frame, aggravated by heat and humidity. It reduces Voc and fill factor and tilts the curve near Isc. It typically affects modules at the negative end of the string first, a pattern confirmed by per-module testing or EL imaging.
12. How many strings should be tested?
At commissioning, 100% testing sets a complete baseline and is increasingly specified in EPC contracts. In operation, test a representative sample on a regular cycle, plus every string flagged by SCADA analytics, thermography or inspections.
13. Can I-V testing be done on 1,500 V systems?
Yes, with a curve tracer, leads and adapters rated for 1,500 V DC and the string's current. Higher voltage raises the shock and arc-flash hazard, so procedures, PPE and isolation must be appropriate to the system.
14. How do bifacial modules affect I-V testing?
Rear-side irradiance adds current that a front-facing sensor does not see. Without measuring or estimating rear irradiance, translation overstates the string's performance. Test plans for bifacial plants should specify rear-side sensors or a documented bifaciality correction.
15. How do trackers affect testing?
The module angle changes continuously, which alters plane-of-array irradiance and angle of incidence. Hold the tracker at a fixed position during testing, align the irradiance sensor with it, and avoid times when backtracking may shade rows.
16. Is it safe to disconnect an MC4 connector to test a string?
Only when no current is flowing. Open the string fuse, DC disconnect or combiner switch first, verify zero current, then separate the connectors. Opening a connector under load can draw a sustained DC arc that damages equipment and injures people.
17. What other tests should accompany I-V curves?
Infrared thermography to locate hot spots and hot connectors, insulation resistance testing for ground faults, electroluminescence imaging for cracked cells and PID, and SCADA analytics to target the testing. Together they move from detection to diagnosis to location.
18. Can I-V data support a module warranty claim?
Yes, if it is collected properly. Claims need translated results, documented test conditions, calibrated instruments, sensor details and the translation method used. Commissioning baselines make the evidence much stronger because they show the change over time.
19. How much energy can I-V-guided maintenance recover?
It depends on the faults found. Individual strings can recover 10–30% when connectors, bypass diodes or shading are corrected. Across a large plant, even a small percentage of under-performing strings can add up to a meaningful share of annual generation and revenue.
20. What should an I-V test report include?
String identification and location, date and time, plane-of-array irradiance and cell temperature, instrument and calibration details, raw and translated curves, the extracted parameters, comparison with expected and baseline values, the diagnosed fault type, and the corrective action and re-test result.
References and Further Reading
Links were current at publication (October 2026).
- IEC 62446-1, Photovoltaic (PV) systems — Requirements for testing, documentation and maintenance — Part 1: Grid connected systems. International Electrotechnical Commission.
- IEC 61829:2015, Photovoltaic (PV) array — On-site measurement of current-voltage characteristics. International Electrotechnical Commission.
- IEC 60891, Photovoltaic devices — Procedures for temperature and irradiance corrections to measured I-V characteristics. International Electrotechnical Commission.
- IEC TS 62446-3, Photovoltaic modules and plants — Outdoor infrared thermography. International Electrotechnical Commission.
- NFPA 70E, Standard for Electrical Safety in the Workplace. National Fire Protection Association.
- Curve Tracing FAQs (summary of IEC 61829 irradiance and sensor guidance). Seaward. https://www.seaward.com/gb/support/solar/faqs/29495-curve-tracing-faq-s/

Disclaimer
This article is general technical information for educational purposes. It is not engineering advice for any specific project and does not create a professional relationship. Temperature coefficients, fill factor ranges, diagnostic ratios and recovery figures are indicative; project-specific values depend on module technology, site conditions and test methods, and must be confirmed against manufacturer data and measurement. Field testing of energised PV systems must be carried out by qualified personnel under the site's safety procedures. Verify the current edition of any standard before relying on a requirement quoted here.
Case studies are illustrative scenarios based on typical project conditions, not records of specific client projects. Figures are rounded and indicative.
IEC, NFPA and other standards bodies, and product names such as MC4, are the property of their respective owners. Keentel Engineering is not affiliated with or endorsed by these organisations or any equipment manufacturer.
| Office | Address | Phone |
|---|---|---|
| Head Office — Tampa | 400 N Ashley Dr STE #2600, Tampa FL 33602 | (813) 389-7871 |
| Austin | 5900 Balcones Drive STE 100, Austin TX 78731 | (512) 591-0752 |
| Sacramento | 1401 21st St Ste R, Sacramento CA 95811 | (916) 913-4524 |
| Baltimore | 306 W Redwood St STE 200, Baltimore MD 21201 | (410) 225-2181 |
contact@keentelengineering.com · keentelengineering.com · calendly.com/keentel-engineering/15min
State of Florida — Registry No. 36853, KEENTEL LLC, DBA: KEENTEL ENGINEERING
Copyright 1995–2026 Keentel Engineering. All Rights Reserved.

About the Author:
Sandip "Sonny" R. Patel, P.E.
IEEE Senior Member · Founder & CEO, Keentel Engineering
In 1995, Sonny Patel earned his Electrical Engineering degree from the University of Illinois. But degrees don't build legacies — action does.
For three decades, he has worked the power industry from every side of the table: 16 years as a utility engineer at Exelon/Commonwealth Edison; generation leadership across hydroelectric, industrial steam turbine, and a 9 GW renewable fleet; NERC Regional Entity Senior Compliance Engineer and Audit Team Lead, auditing some of the nation's largest utilities; and testing and commissioning lead on equipment up to 765 kV — the very top of the North American grid.Utility. Generator. Regulator. Consultant. Few engineers have seen all four seats. Fewer still have sat in them.
His experience spans nuclear, hydro, conventional generation, renewables, oil and gas, mining — and today's data centers, where he is authoring a three-book series on data center design. He is a Licensed Professional Engineer in six states and a Licensed Electrical Contractor in Florida (Unlimited EC) — he doesn't just design the work; he's qualified to stand behind its execution.Today, as Founder and CEO of Keentel Engineering, Sonny leads a nationwide team of engineers delivering substation design, power system studies, NERC compliance, and commissioning — done right, coast to coast.Three decades. Every side of the table. One standard: accountable engineering.
Services

Let's Discuss Your Project
Let's book a call to discuss your electrical engineering project that we can help you with.
About the Author:
Sandip "Sonny" R. Patel, P.E.
IEEE Senior Member · Founder & CEO, Keentel Engineering
In 1995, Sonny Patel earned his Electrical Engineering degree from the University of Illinois. But degrees don't build legacies — action does.
For three decades, he has worked the power industry from every side of the table: 16 years as a utility engineer at Exelon/Commonwealth Edison; generation leadership across hydroelectric, industrial steam turbine, and a 9 GW renewable fleet; NERC Regional Entity Senior Compliance Engineer and Audit Team Lead, auditing some of the nation's largest utilities; and testing and commissioning lead on equipment up to 765 kV — the very top of the North American grid.
Utility. Generator. Regulator. Consultant. Few engineers have seen all four seats. Fewer still have sat in them.
His experience spans nuclear, hydro, conventional generation, renewables, oil and gas, mining — and today's data centers, where he is authoring a three-book series on data center design. He is a Licensed Professional Engineer in six states and a Licensed Electrical Contractor in Florida (Unlimited EC) — he doesn't just design the work; he's qualified to stand behind its execution.
Today, as Founder and CEO of Keentel Engineering, Sonny leads a nationwide team of engineers delivering substation design, power system studies, NERC compliance, and commissioning — done right, coast to coast.Three decades. Every side of the table. One standard: accountable engineering.
Leave a Comment
Thank you for contacting us.
We will get back to you as soon as possible.
We will get back to you as soon as possible.
Oops, there was an error sending your message.
Please try again later.
Please try again later.
Related Posts
By SANDIP R PATEL
•
October 3, 2026
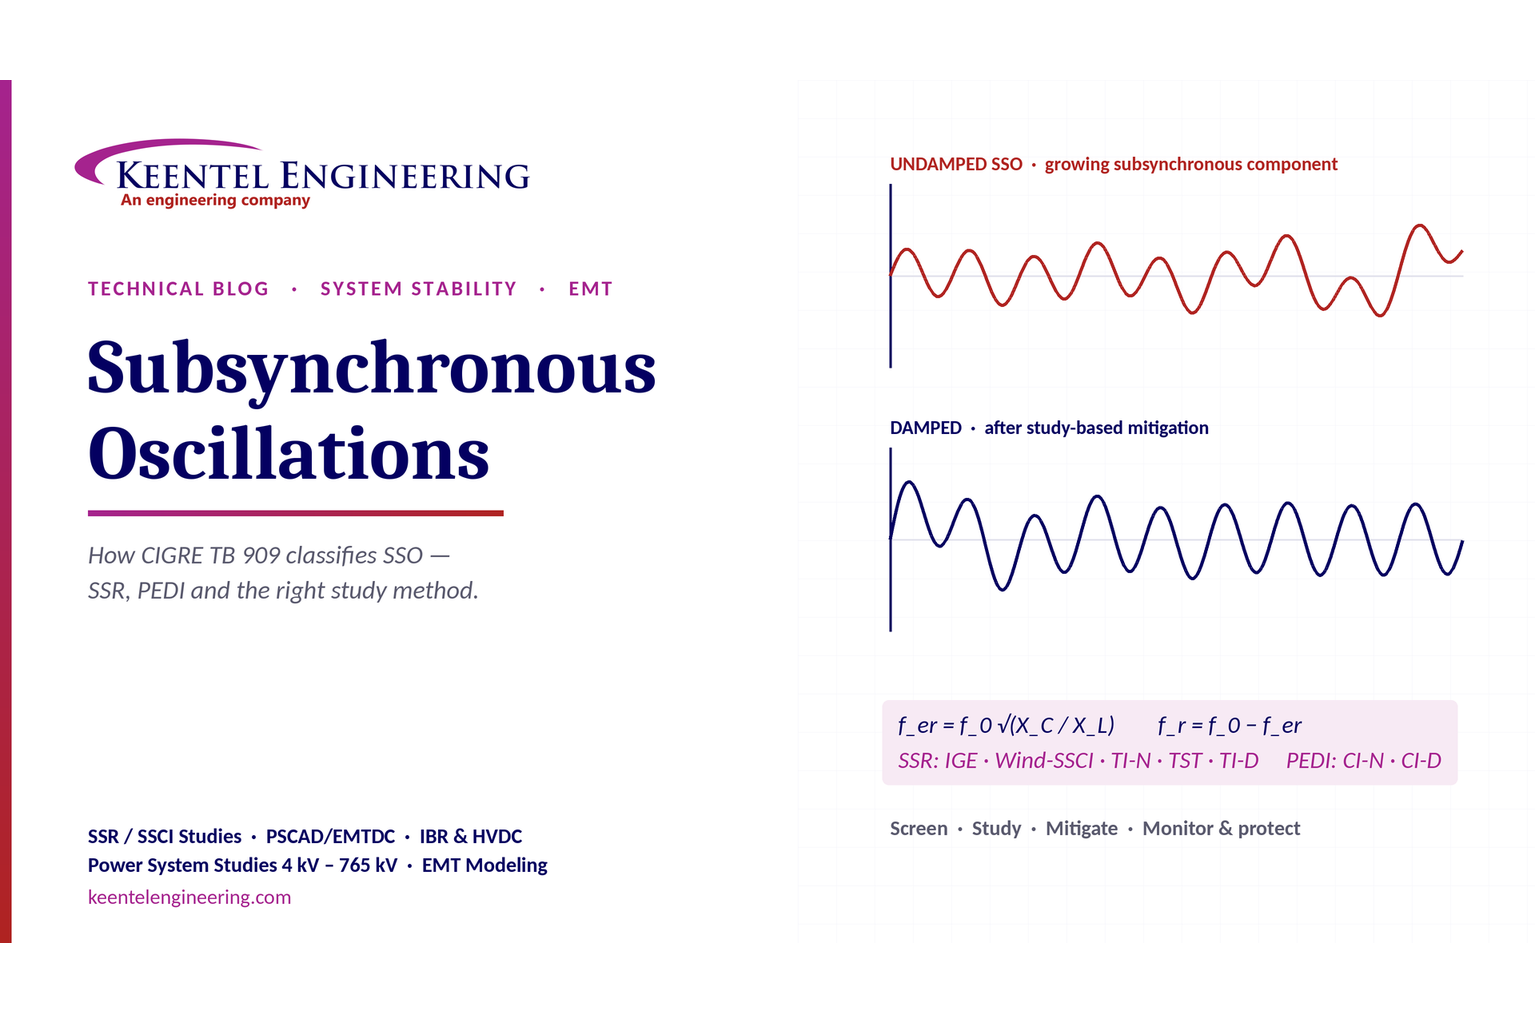
A practical guide to SSO classification, SSR, PEDI, Wind-SSCI, EMT analysis, mitigation and protection based on CIGRE TB 909.
By SANDIP R PATEL
•
October 3, 2026
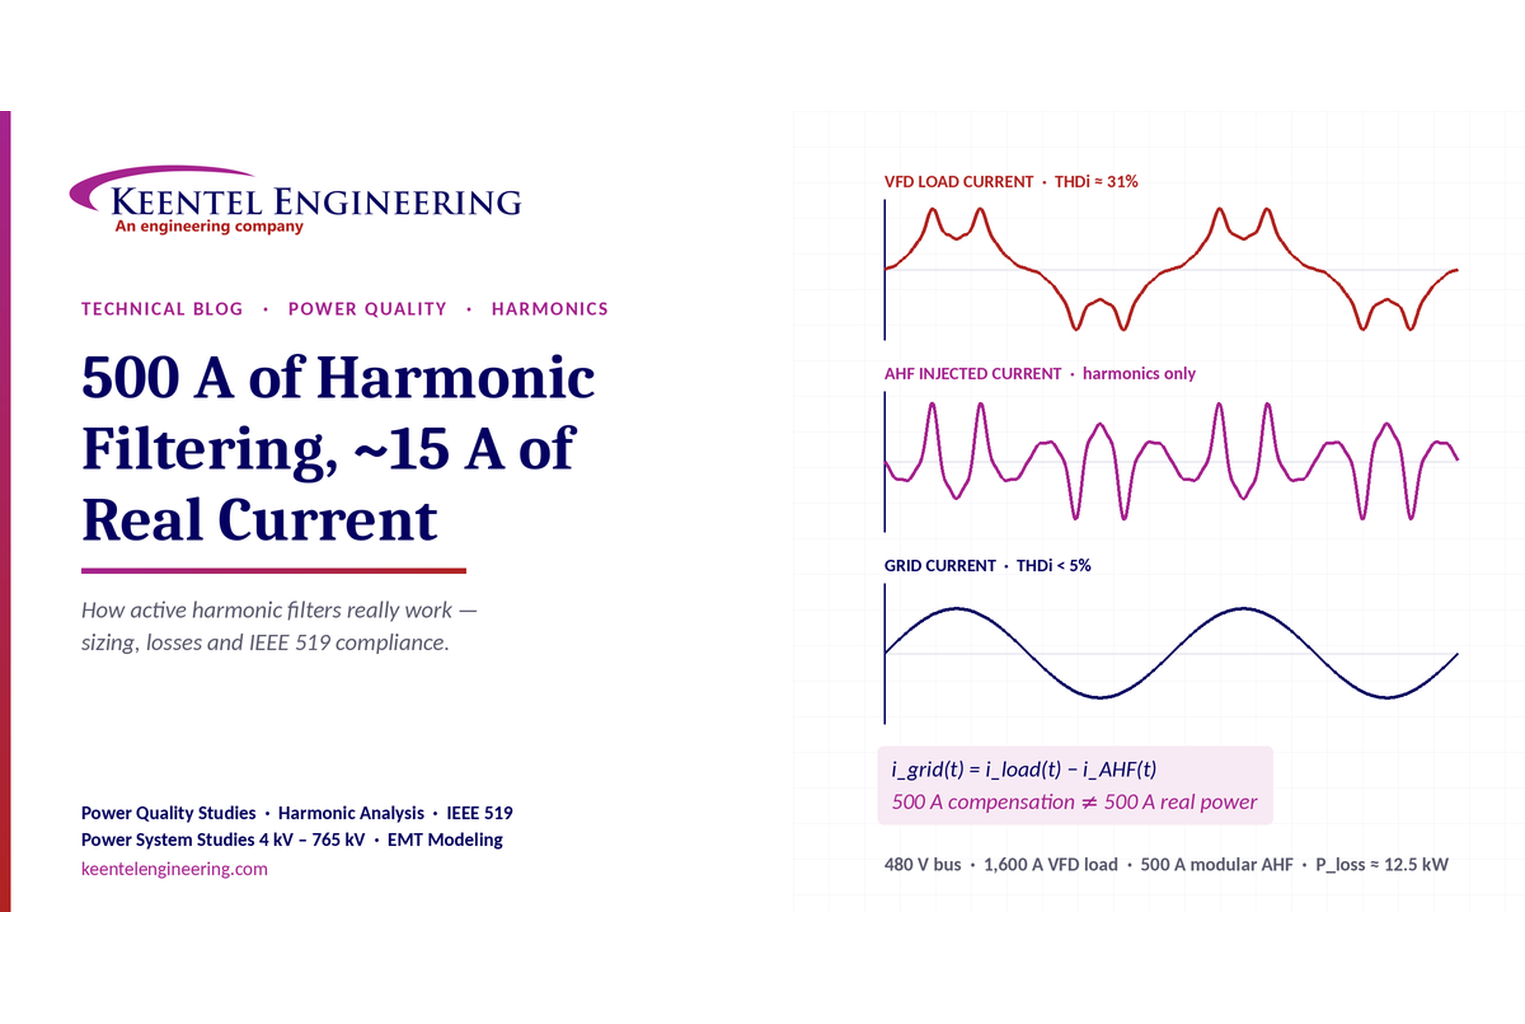
Learn how active harmonic filters work, how to size AHF systems, reduce VFD harmonics, calculate losses, and meet IEEE 519 TDD limits at the PCC.
By SANDIP R PATEL
•
October 3, 2026
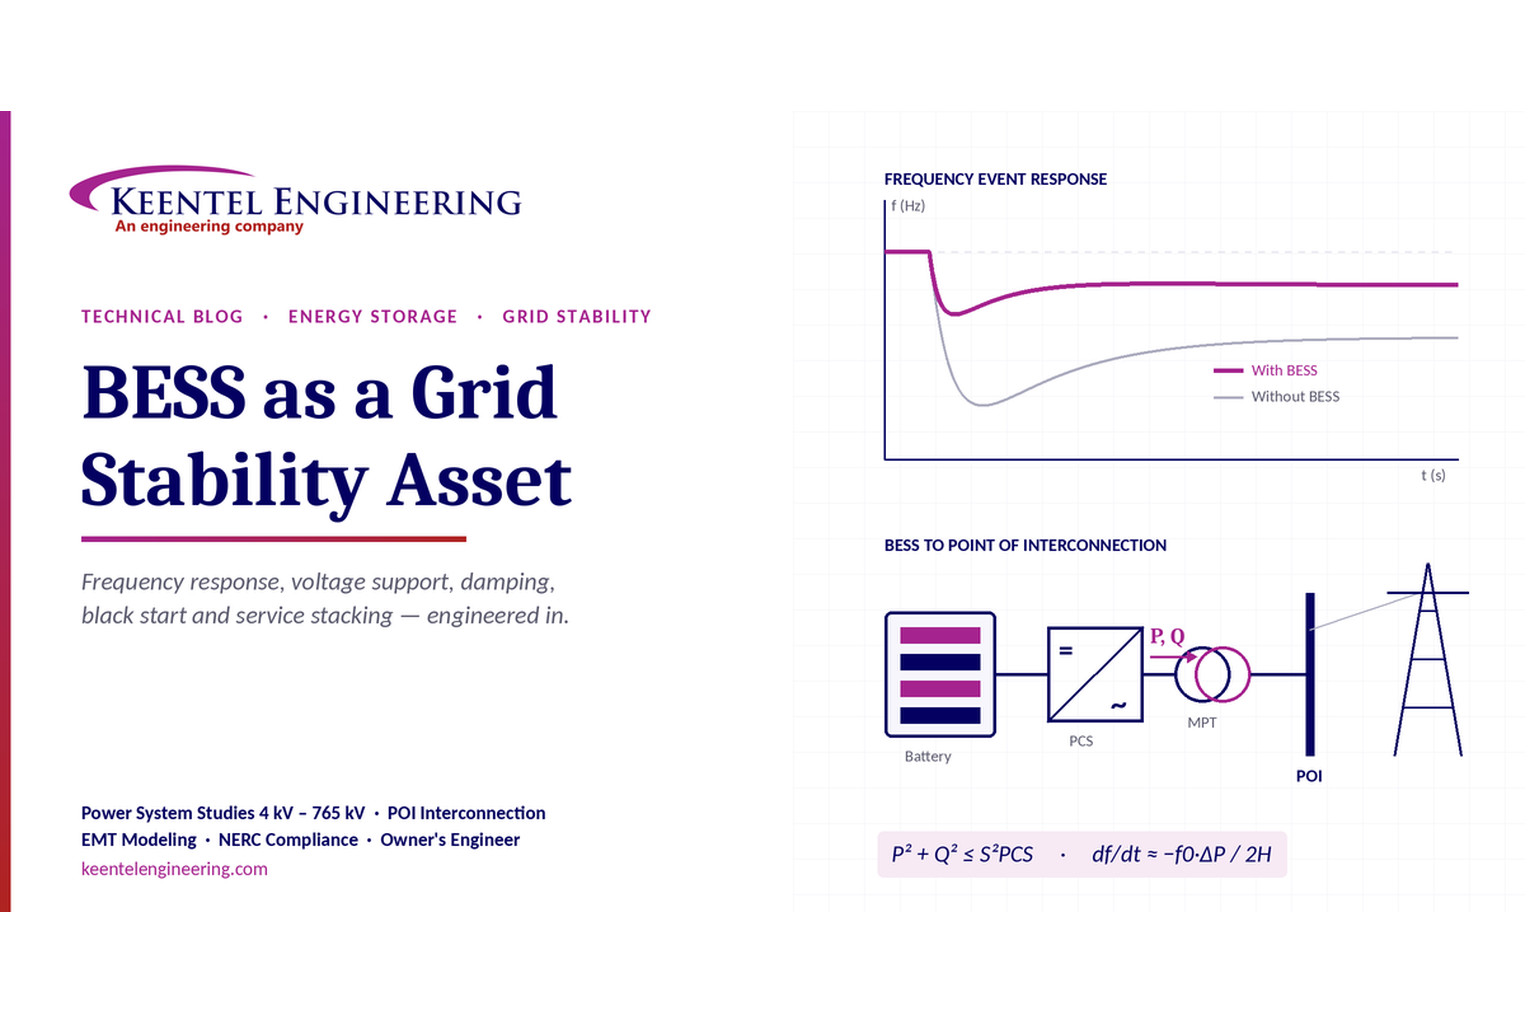
Learn how BESS supports grid stability through fast frequency response, voltage support, oscillation damping, black start, grid-forming controls and EMT studies.
By SANDIP R PATEL
•
September 30, 2026
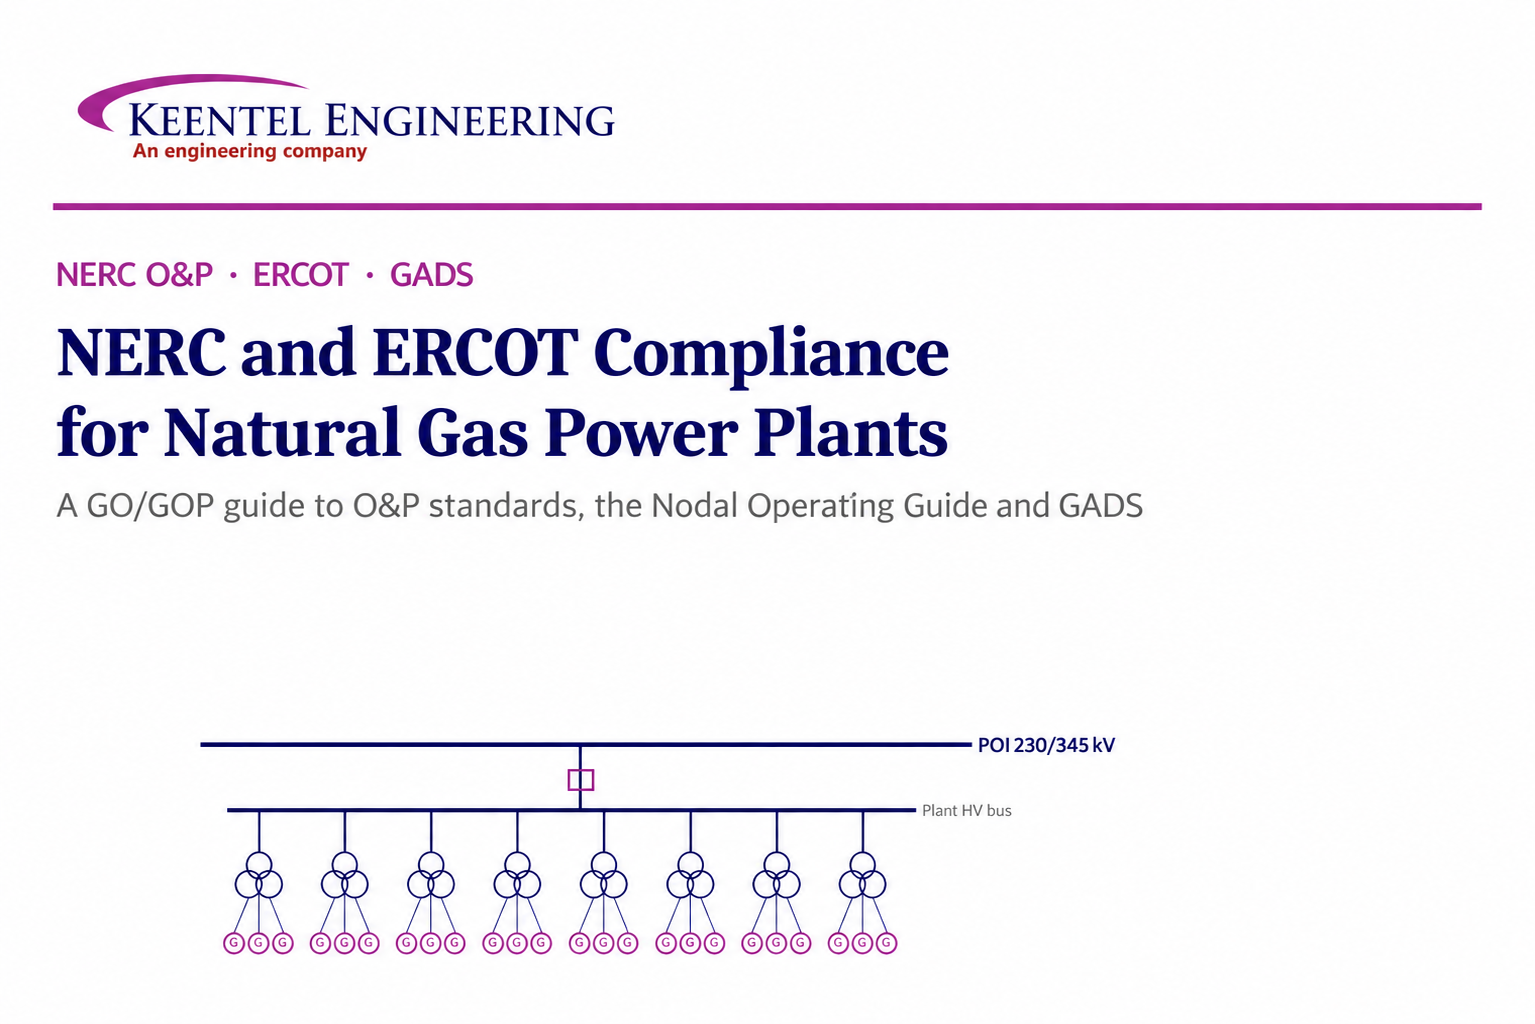
Learn NERC and ERCOT compliance requirements for natural gas power plants, including GO/GOP obligations, O&P standards, GADS reporting, and audits.
By SANDIP R PATEL
•
September 26, 2026
Learn how to prepare a MISO large-load interconnection package, including PSS®E models, BESS smoothing, harmonic data and transmission-owner requirements.

By SANDIP R PATEL
•
September 26, 2026
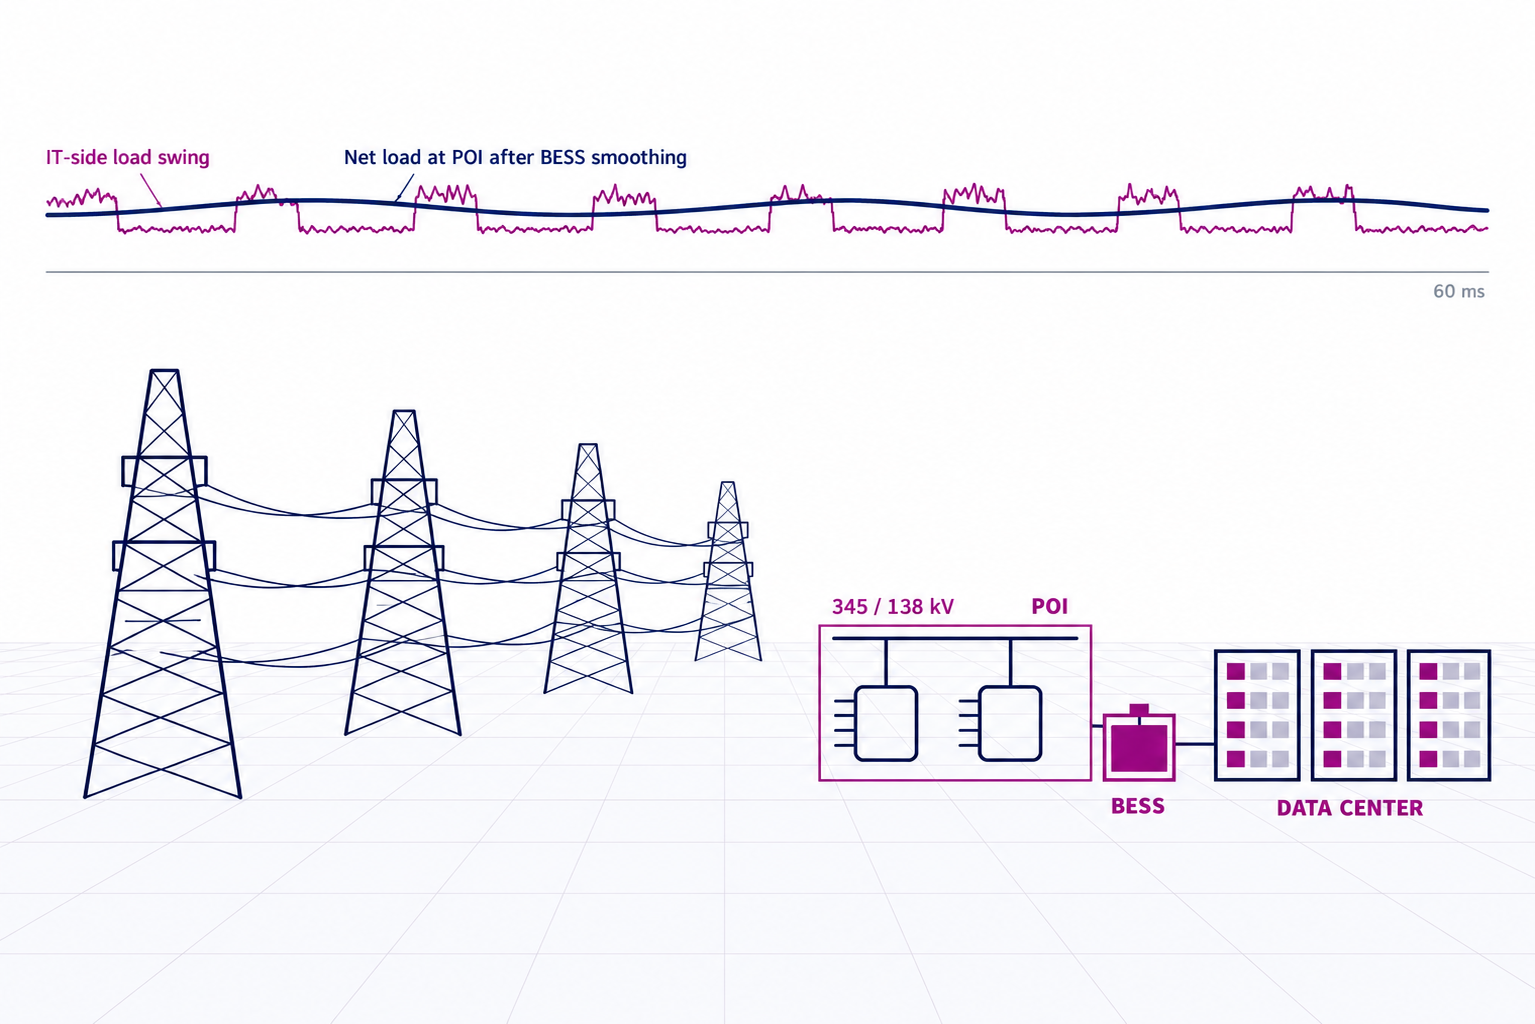
Learn where storage belongs in an 800 VDC AI data center, including capacitors, flywheels, BESS, fault current, protection, grounding, and EMT design.
By SANDIP R PATEL
•
September 26, 2026
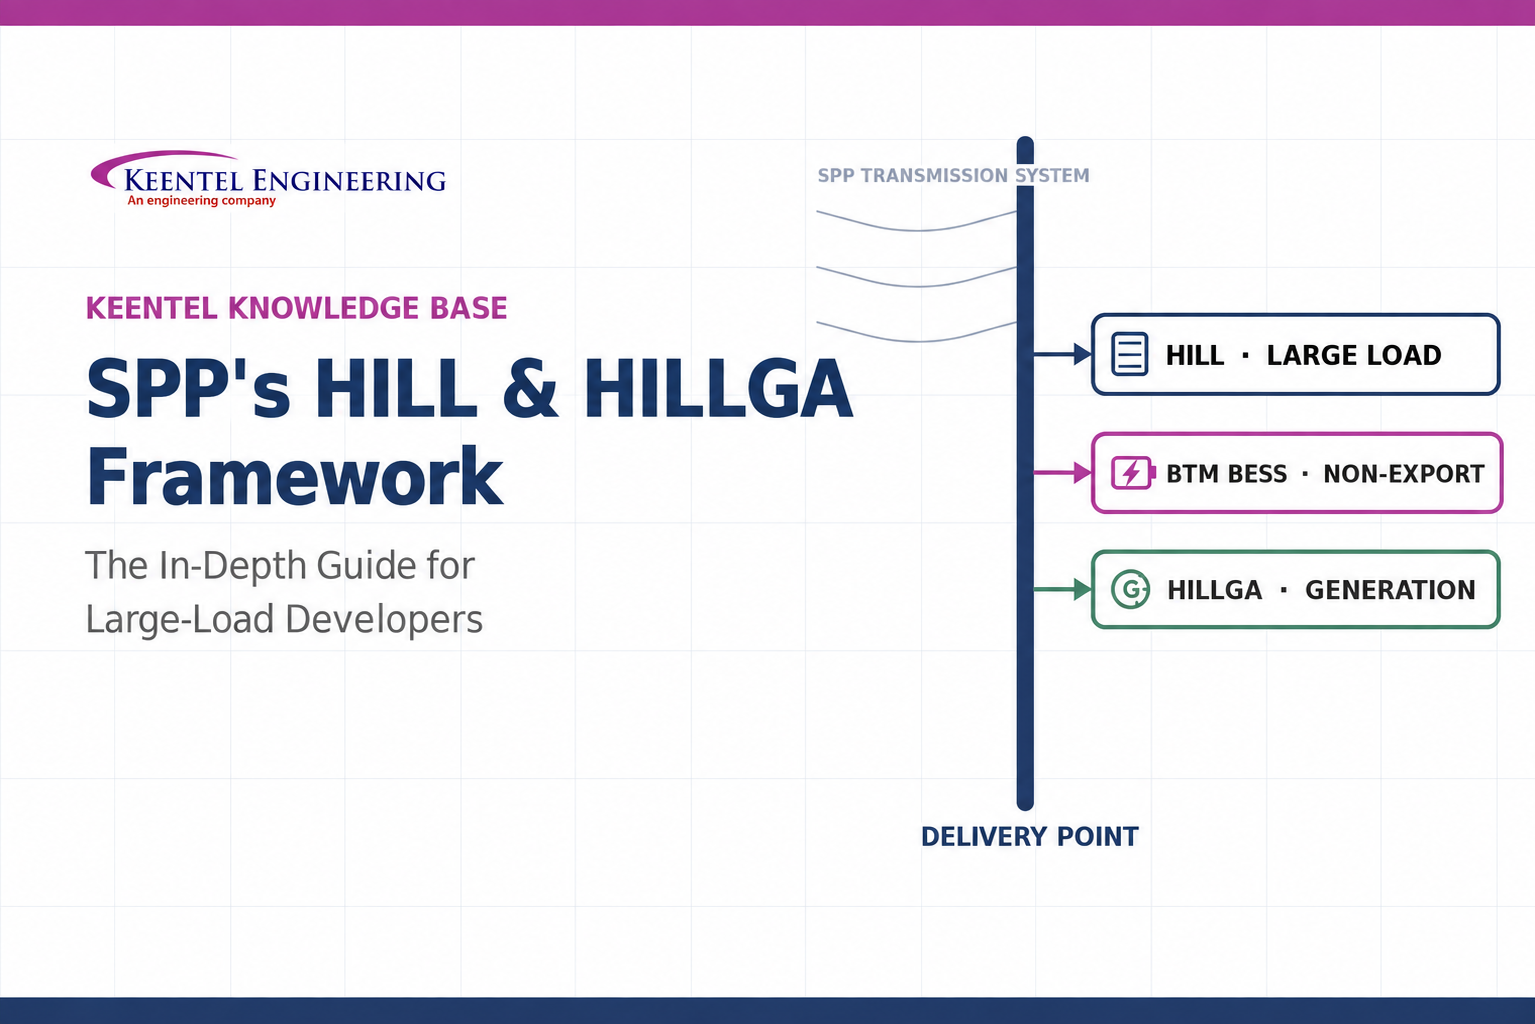
Learn how SPP’s HILL and HILLGA framework works for large-load projects, including studies, BTM generation, modeling, EMT requirements, and firm service.
By SANDIP R PATEL
•
September 25, 2026
Learn how IBR time synchronization, IEEE 2800, IRIG-B verification, and PTP solutions help meet disturbance monitoring compliance requirements.
By SANDIP R PATEL
•
September 24, 2026
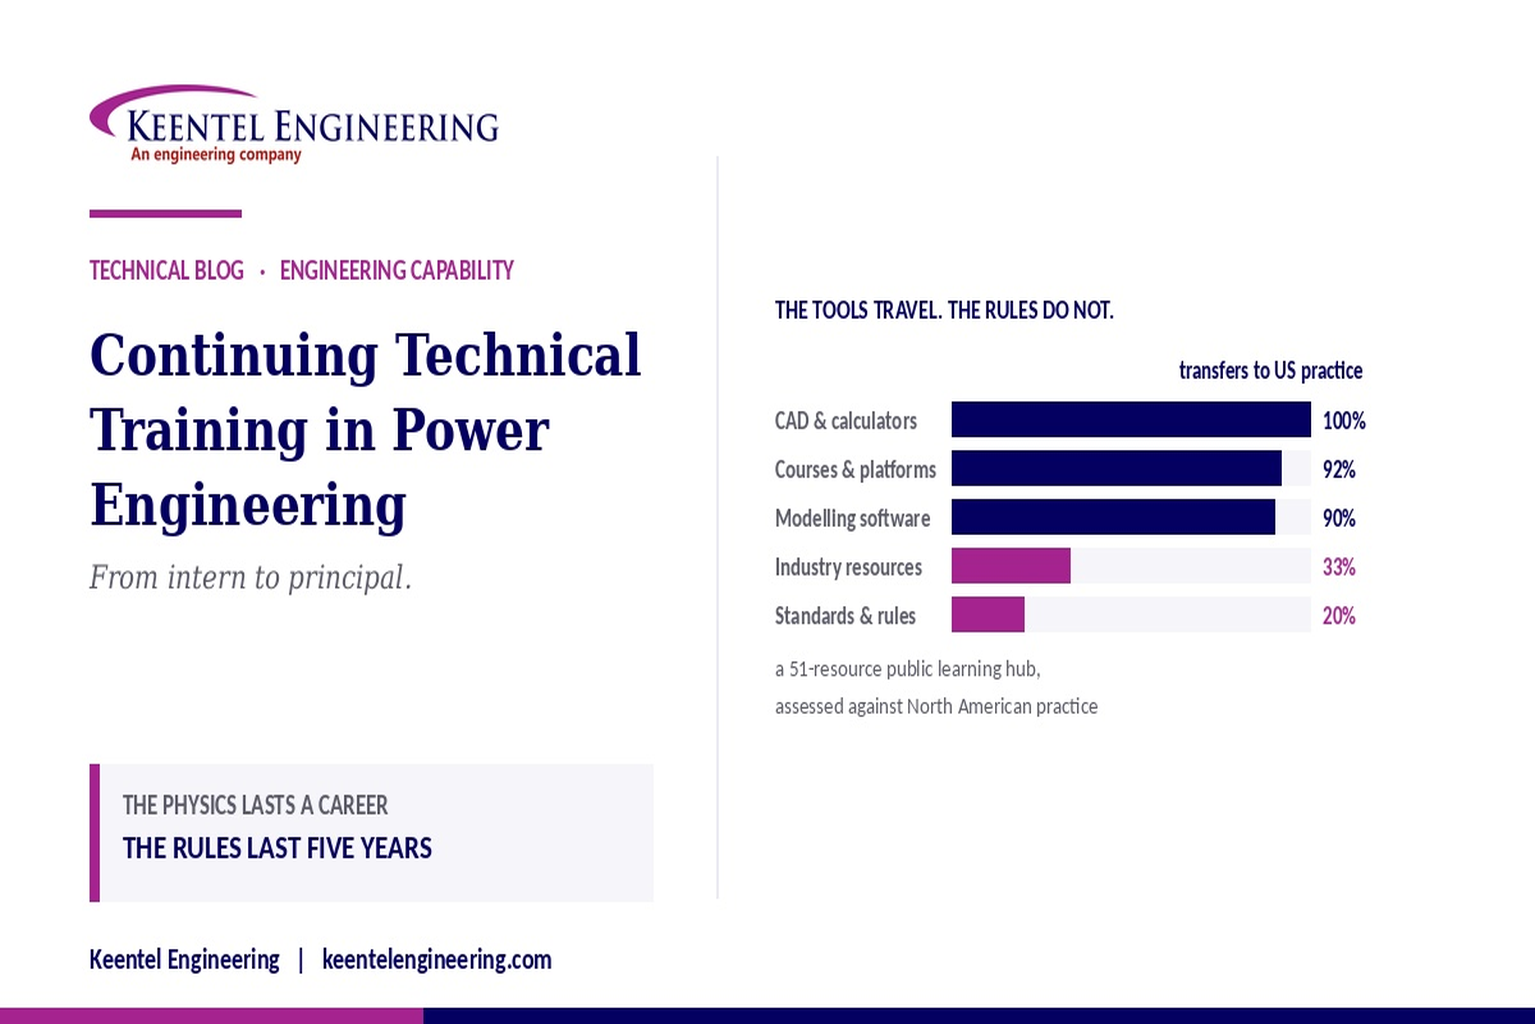
Learn why continuing technical training matters in power engineering, including standards, software skills, PDH requirements, and career growth.





