


A Coordinated Electric System Interconnection Review—the utility’s deep-dive on technical and cost impacts of your project.

Challenge: Frequent false tripping using conventional electromechanical relays
Solution: SEL-487E integration with multi-terminal differential protection and dynamic inrush restraint
Result: 90% reduction in false trips, saving over $250,000 in downtime

PJM D-Curve (Reactive Capability) Testing for inverter-based resources (IBRs) Resources

Solar panels in rows with a power plant featuring smokestacks emitting steam.
Calendar icon. D

january 14, 2026 | Blog

A Practical Guide for Generator Owners and Operators

As inverter-based resources (IBRs) such as wind/ solar farms continue to expand across the PJM Interconnection, maintaining accurate and compliant Reactive Capability (D-Curve) data has become a critical reliability and compliance obligation. For wind facilities like Camp Grove Wind Farm, PJM requires that reactive capability curves reflect realistic, sustainable operating limits and be supported by documented testing in accordance with PJM Manual 14D and submission rules within PJM eDART.

At Keentel Engineering, we support wind / solar / BESS Generator Owners with end-to-end D-Curve testing assistance from test planning and PJM coordination to final eDART-ready curve development.


This article explains what D-Curves are, why PJM requires them, and how wind facilities can successfully meet these requirements.


What Is a PJM D-Curve?

A D-Curve defines the relationship between a generating facility’s real power output (MW) and its minimum and maximum reactive power capability (MVAR). PJM uses D-Curves within its Energy Management System (EMS) and State Estimator to ensure voltage stability and reliable grid operation.


For wind farms, the D-Curve must represent:

  • Actual plant capability (not nameplate values)
  • Sustainable reactive output and absorption
  • Capabilities achievable under normal operating conditions


D-Curves are maintained and updated exclusively through PJM’s eDART system.

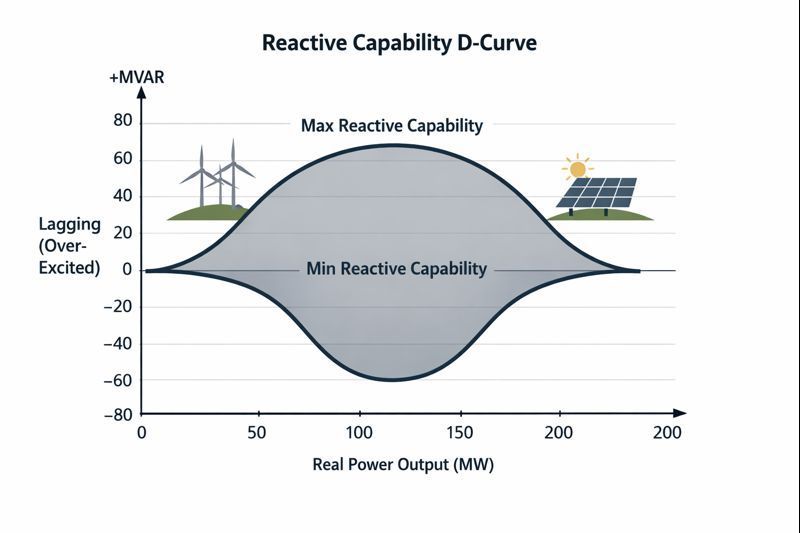
A Reactive Capability D-Curve chart shows MVAR vs. MW for wind and solar plants, plotting output range within a shaded area.

Why PJM Requires Reactive Capability Testing

PJM relies on accurate reactive capability data to:

  • Maintain transmission voltage within acceptable limits
  • Perform real-time contingency analysis
  • Ensure inverter-based resources contribute to system reliability


Because wind farms use power electronics and plant-level controllers, their reactive limits are often governed by inverter current limits, controller settings, voltage constraints, and transformer capability. PJM therefore requires testing-based verification rather than purely theoretical curves.


Applicability to Wind Farms

Wind farms in PJM are subject to D-Curve requirements if:

  • The aggregated facility exceeds 75 MVA nameplate rating
  • The resource is registered as a PJM Generation Resource


Wind facilities are treated as aggregated generating plants, and testing is performed at the plant level, not on individual turbines.


Measurement Basis for Wind Farm D-Curves

PJM requires that D-Curve MW and MVAR values be based on:

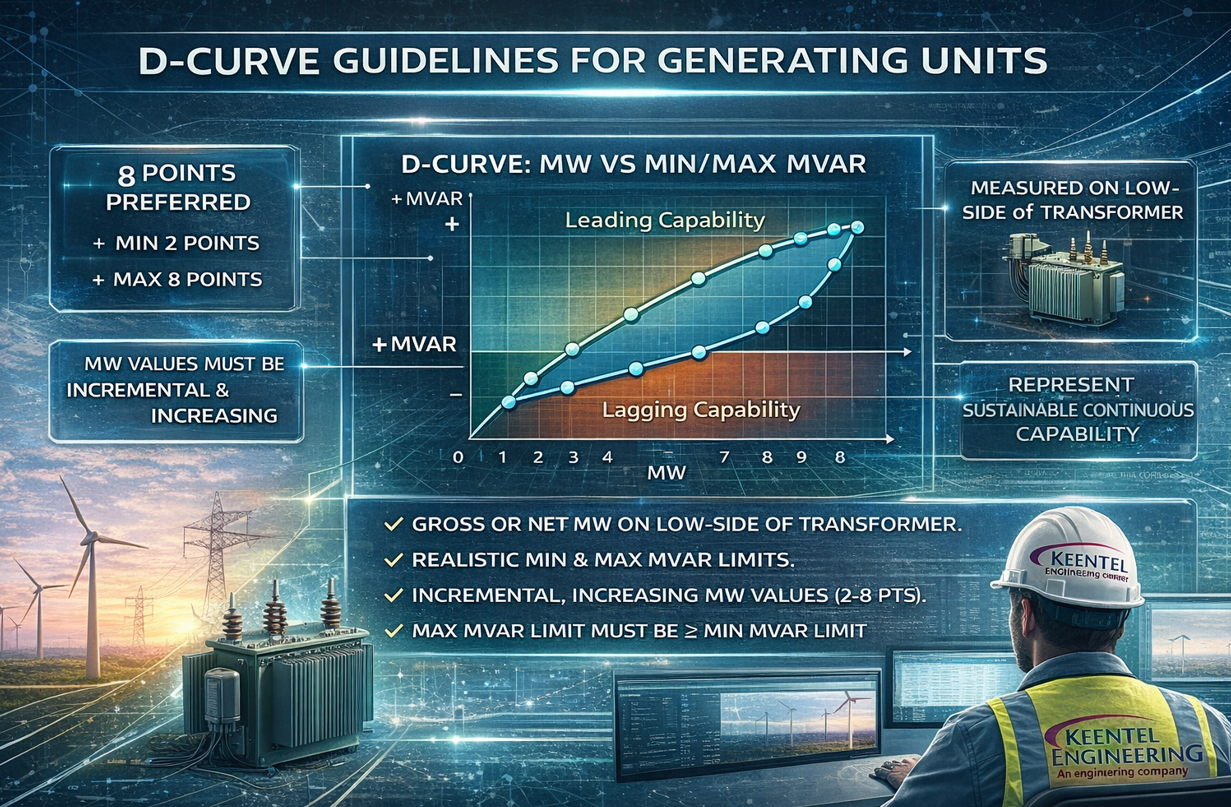
  • Gross or Net MW measured at the low-side of the Generator Step-Up (GSU) transformer
  • MVAR values that match the telemetered MVAR point reflected in eDART


Key rules include:

  • MW values must increase monotonically across the curve
  • MW values cannot be duplicated
  • Maximum MVAR must always be greater than or equal to minimum MVAR at each MW point

These testing requirements are closely aligned with NERC Alert Level 3 requirements for inverter-based resources, which emphasize verified reactive capability and accurate system modeling.


Structure of a PJM-Compliant D-Curve

PJM allows:

  • Minimum of 2 points
  • Maximum of 8 points (strongly preferred)


For wind resources:

  • MW points typically span from minimum operating output to maximum achievable output
  • Intermediate points represent realistic operating levels based on wind availability
  • PJM prefers 8-point curves to support State Estimator accuracy

Reactive Capability Testing Requirements for Wind Farms

Required Tests

Wind facilities must demonstrate:

  1. Maximum Lagging (Over-Excited) Reactive Capability – maximum MVAR injection
  2. Maximum Leading (Under-Excited) Reactive Capability – maximum MVAR absorption

Turbine Availability

  • At least 90% of turbines must be online during each test
  • Testing must reflect normal plant configuration

Test Execution

  • Testing is performed at stable MW plateaus achievable under wind conditions
  • Reactive setpoints are adjusted until a limiting condition is reached
  • Limits must be sustainable, not momentary spikes

These tests are typically supported by power system studiesfor reactive capability testing to confirm sustainable operating limits and compliance with PJM requirements.


Common Limiting Factors Observed in Wind Farm Testing

During testing, reactive limits are often determined by:

  • Inverter current limits
  • Plant controller programmed capability curves
  • Voltage constraints at the POI or collector system
  • GSU transformer MVA limits
  • Shunt device saturation (capacitors/reactors)


Each limiting condition must be clearly documented and supported by data trends.


Data Recording and Documentation Expectations

PJM expects detailed documentation including:

  • MW and MVAR at each test point
  • Voltage at GSU low-side and POI
  • Turbine availability during testing
  • Plant controller mode and setpoints
  • Identification of the limiting factor at each max/min point


This data forms the technical basis for D-Curve updates and audit defensibility.


eDART Submission and Curve Updates

Following testing:

  • Results are translated into an eDART-ready D-Curve dataset
  • Curves must meet PJM formatting and validation rules
  • PJM reviews the submission and may request clarification or adjustments


Failure to submit updated curves within required timelines may result in PJM updating the D-Curve based on available test data to preserve system reliability.


How Keentel Engineering Supports PJM D-Curve Compliance

Keentel Engineering provides specialized support for wind facilities, including:

  • PJM-compliant reactive capability test plan development
  • PJM, TO, and MOC coordination support
  • Live test execution support (remote or on-site)
  • Engineering analysis and 8-point D-Curve development
  • eDART submission and closeout support


Our approach reduces compliance risk while ensuring that D-Curves accurately reflect true plant capability.


Related Keentel Engineering Services


Conclusion

For wind farms in PJM, D-Curve compliance is not simply an administrative task—it is a critical reliability obligation that requires engineering judgment, coordinated testing, and detailed documentation. With increasing scrutiny on inverter-based resources, Generator Owners benefit from proactive, well-supported D-Curve testing programs.


Keentel Engineering brings deep PJM experience and practical wind plant expertise to help owners meet these requirements efficiently and defensibly.


Frequently Asked Questions (FAQ)

  • 1. What is a PJM D-Curve?

    A PJM D-Curve defines the relationship between a generating facility’s real power output (MW) and its minimum and maximum reactive power capability (MVAR). PJM uses D-Curves in its Energy Management System (EMS) and State Estimator to support voltage control and system reliability.

  • 2. Are wind farms required to maintain D-Curves in PJM?

    Yes. Aggregated wind facilities registered as PJM Generation Resources are required to maintain PJM-compliant D-Curves that reflect actual, sustainable plant capability.

  • 3. How many points are required on a PJM D-Curve?

    PJM allows D-Curves with 2 to 8 points, but strongly prefers 8-point curves to improve State Estimator accuracy and operational visibility.

  • 4. Where are MW values measured for PJM D-Curves?

    MW values must be measured at the low-side of the Generator Step-Up (GSU) transformer, consistent with PJM telemetry and eDART reporting requirements.

  • 5. What reactive capability tests are required for wind farms?

    Wind farms must demonstrate:

    • Maximum lagging (over-excited) reactive capability for MVAR injection
    • Maximum leading (under-excited) reactive capability for MVAR absorption

    Both limits must be sustainable, not momentary.

  • 6. Why does PJM require at least 90% turbine availability during testing?

    PJM requires at least 90% turbine availability to ensure test results represent full-plant capability and are not influenced by partial or abnormal operating conditions.

  • 7. Can theoretical inverter capability be used instead of testing?

    No. PJM expects D-Curves to be supported by testing or verified operational data. Purely theoretical or nameplate-based capability is not acceptable.

  • 8. What typically limits reactive capability during testing?

    Common limiting factors include:

    • Inverter current limits
    • Plant controller capability settings
    • Voltage constraints at the POI or collector system
    • GSU transformer MVA limits
    • Shunt device saturation (capacitors or reactors)

    Each limiting condition must be documented.

  • 9. What happens if a D-Curve is not updated after testing?

    If updated D-Curves are not submitted within required timelines, PJM may update the D-Curve using available test data to preserve system reliability.

  • 10. Does Keentel Engineering support PJM eDART submissions?

    Yes. Keentel Engineering provides end-to-end support, including test planning, data analysis, 8-point D-Curve development, and eDART-ready submission and closeout.


Related PJM & IBR Compliance Resources


A smiling man with glasses and a beard wearing a blue blazer stands in front of server racks in a data center.

About the Author:

Sandip "Sonny" R. Patel, P.E.

IEEE Senior Member · Founder & CEO, Keentel Engineering

In 1995, Sonny Patel earned his Electrical Engineering degree from the University of Illinois. But degrees don't build legacies — action does.

For three decades, he has worked the power industry from every side of the table: 16 years as a utility engineer at Exelon/Commonwealth Edison; generation leadership across hydroelectric, industrial steam turbine, and a 9 GW renewable fleet; NERC Regional Entity Senior Compliance Engineer and Audit Team Lead, auditing some of the nation's largest utilities; and testing and commissioning lead on equipment up to 765 kV — the very top of the North American grid.Utility. Generator. Regulator. Consultant. Few engineers have seen all four seats. Fewer still have sat in them.

His experience spans nuclear, hydro, conventional generation, renewables, oil and gas, mining — and today's data centers, where he is authoring a three-book series on data center design. He is a Licensed Professional Engineer in six states and a Licensed Electrical Contractor in Florida (Unlimited EC) — he doesn't just design the work; he's qualified to stand behind its execution.Today, as Founder and CEO of Keentel Engineering, Sonny leads a nationwide team of engineers delivering substation design, power system studies, NERC compliance, and commissioning — done right, coast to coast.Three decades. Every side of the table. One standard: accountable engineering.

Four workers in safety vests and helmets stand with arms crossed near wind turbines.

Let's Discuss Your Project

Let's book a call to discuss your electrical engineering project that we can help you with.

Man in a blazer and open shirt, looking at the camera, against a blurred background.

About the Author:

Sandip "Sonny" R. Patel, P.E.

IEEE Senior Member · Founder & CEO, Keentel Engineering

In 1995, Sonny Patel earned his Electrical Engineering degree from the University of Illinois. But degrees don't build legacies — action does.

For three decades, he has worked the power industry from every side of the table: 16 years as a utility engineer at Exelon/Commonwealth Edison; generation leadership across hydroelectric, industrial steam turbine, and a 9 GW renewable fleet; NERC Regional Entity Senior Compliance Engineer and Audit Team Lead, auditing some of the nation's largest utilities; and testing and commissioning lead on equipment up to 765 kV — the very top of the North American grid.

Utility. Generator. Regulator. Consultant. Few engineers have seen all four seats. Fewer still have sat in them.

His experience spans nuclear, hydro, conventional generation, renewables, oil and gas, mining — and today's data centers, where he is authoring a three-book series on data center design. He is a Licensed Professional Engineer in six states and a Licensed Electrical Contractor in Florida (Unlimited EC) — he doesn't just design the work; he's qualified to stand behind its execution.

Today, as Founder and CEO of Keentel Engineering, Sonny leads a nationwide team of engineers delivering substation design, power system studies, NERC compliance, and commissioning — done right, coast to coast.Three decades. Every side of the table. One standard: accountable engineering.

Leave a Comment

Related Posts

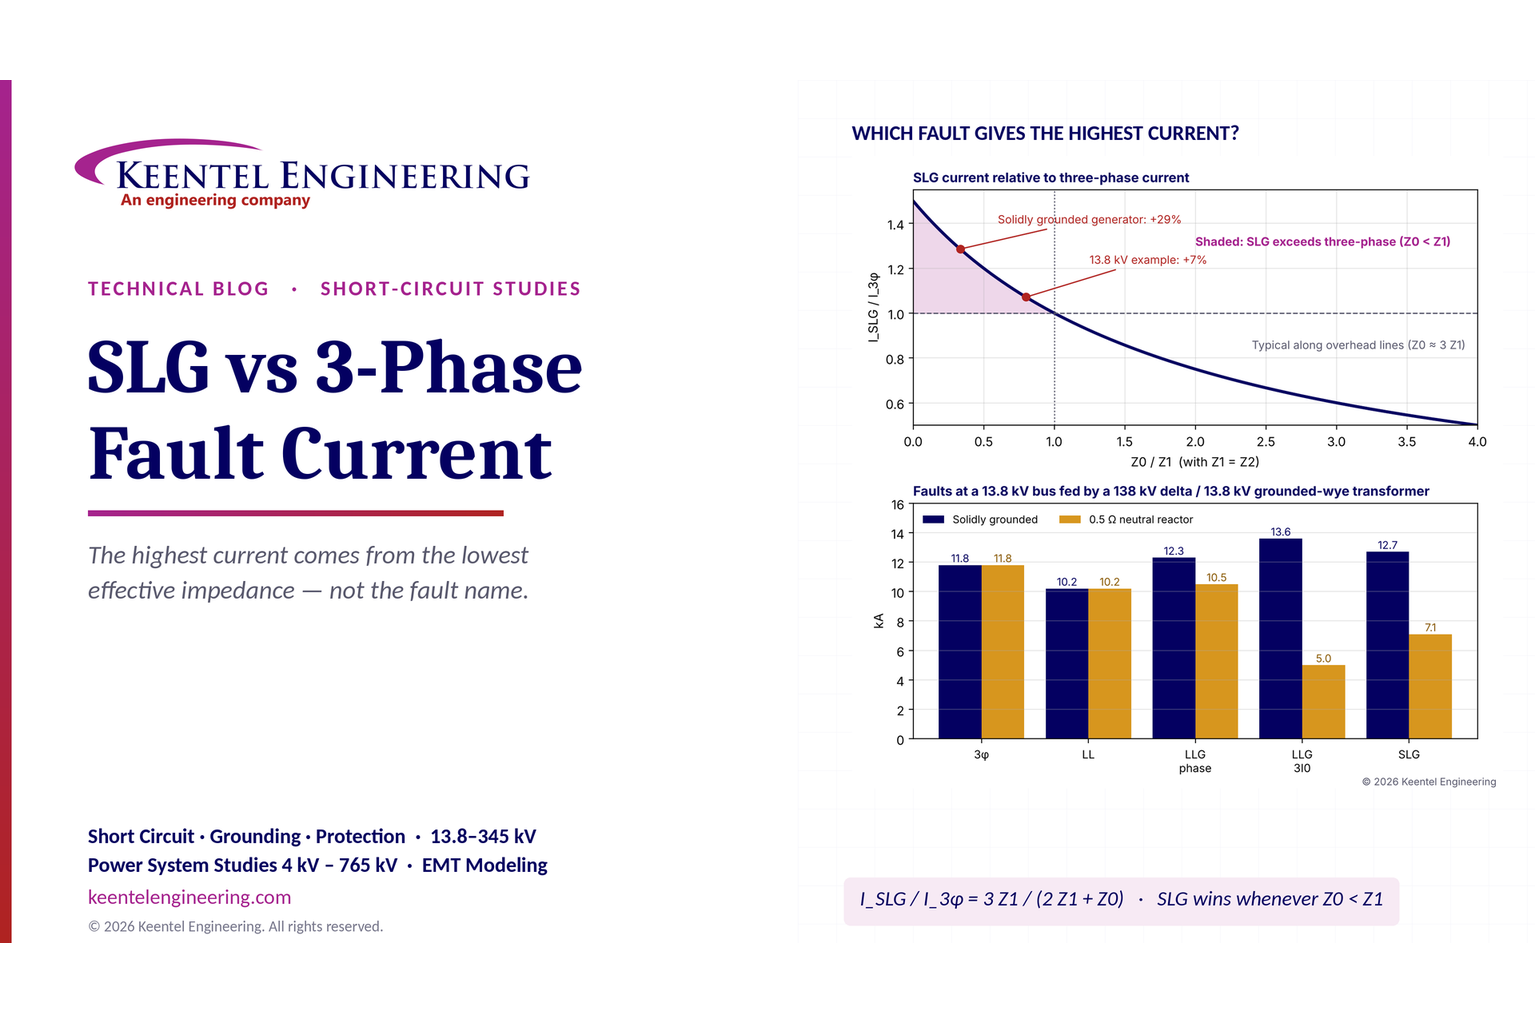
SLG vs three-phase fault current comparison showing short-circuit current, grounding impedance, and
By SANDIP R PATEL • October 11, 2026
Learn which fault produces the highest current at a bus, why SLG faults can exceed three-phase faults, and how symmetrical components determine fault duty.
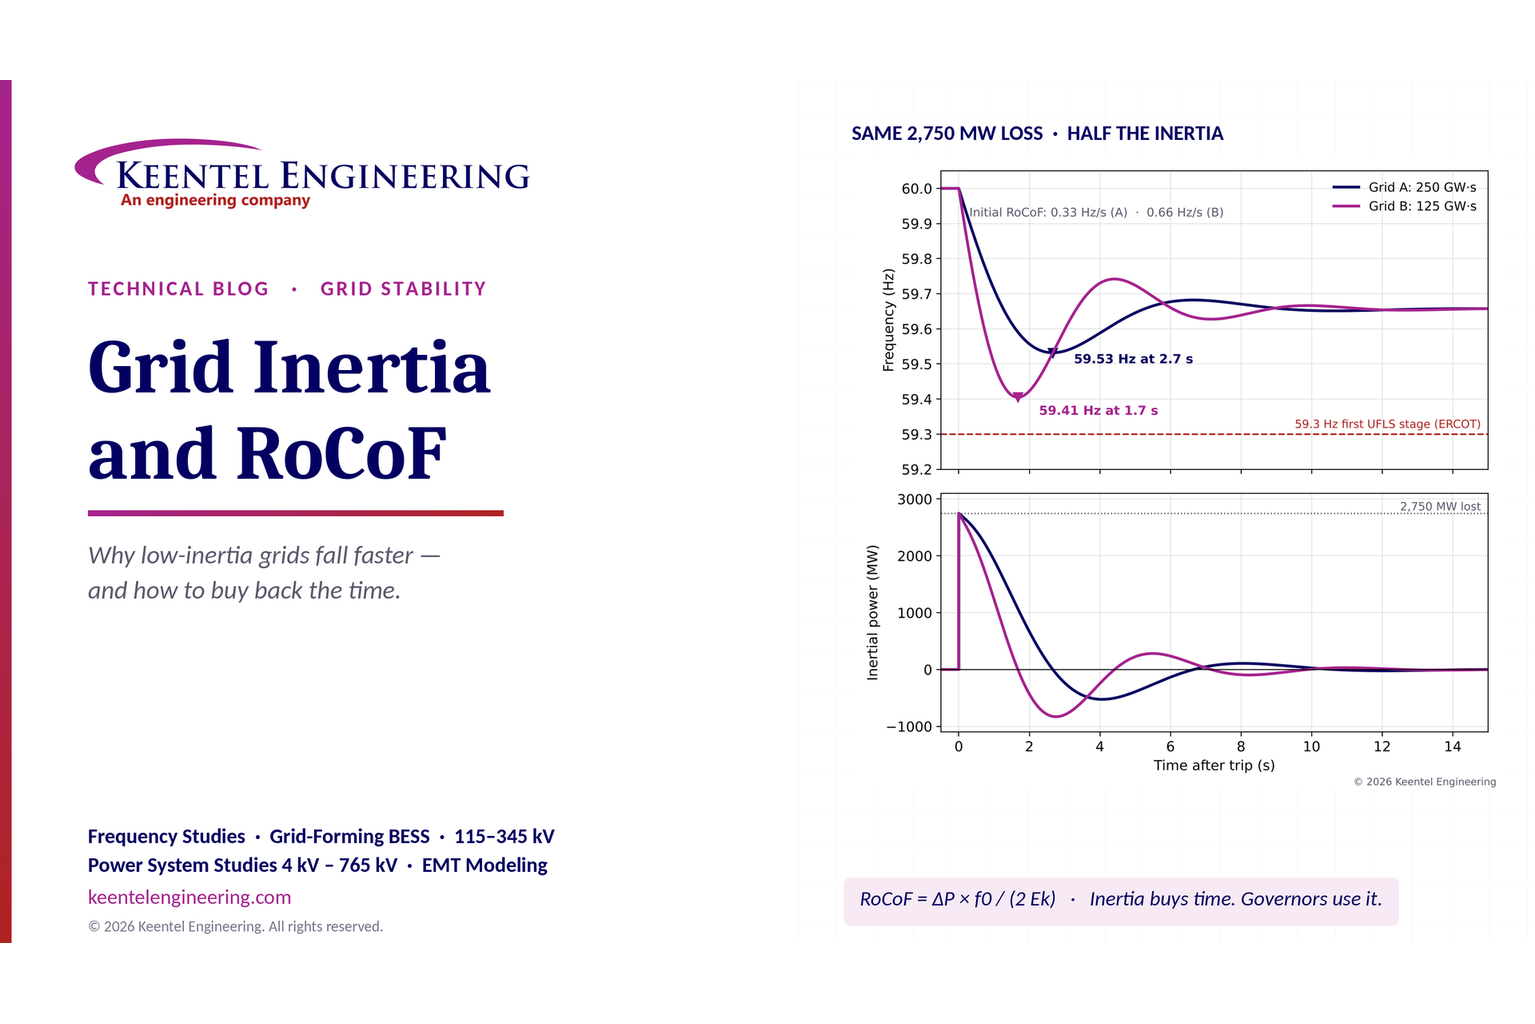
Grid inertia and RoCoF comparison showing frequency response, inertial power, and grid stability aft
By SANDIP R PATEL • October 11, 2026
Explore grid inertia, RoCoF and frequency response, with swing equation calculations, frequency nadir analysis and US power system simulation examples.
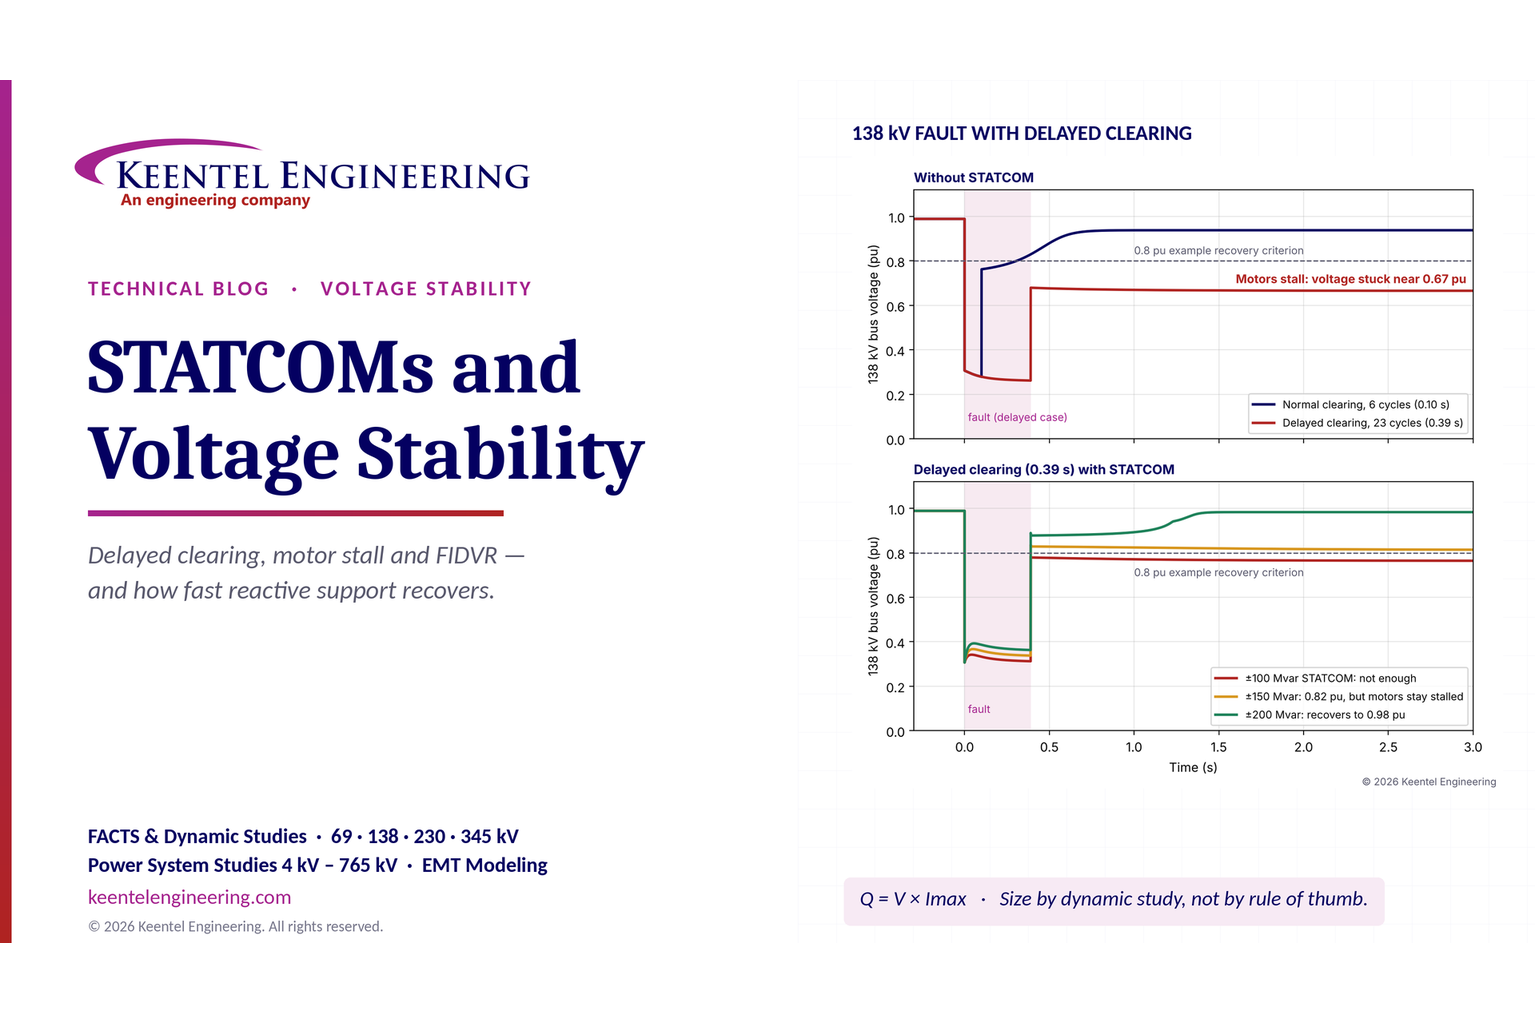
STATCOM voltage stability comparison showing 138 kV fault recovery and reactive power support.
By SANDIP R PATEL • October 11, 2026
Learn how STATCOMs improve voltage stability and prevent FIDVR. Explore reactive power sizing, delayed fault clearing, NERC criteria and 138 kV simulation results.
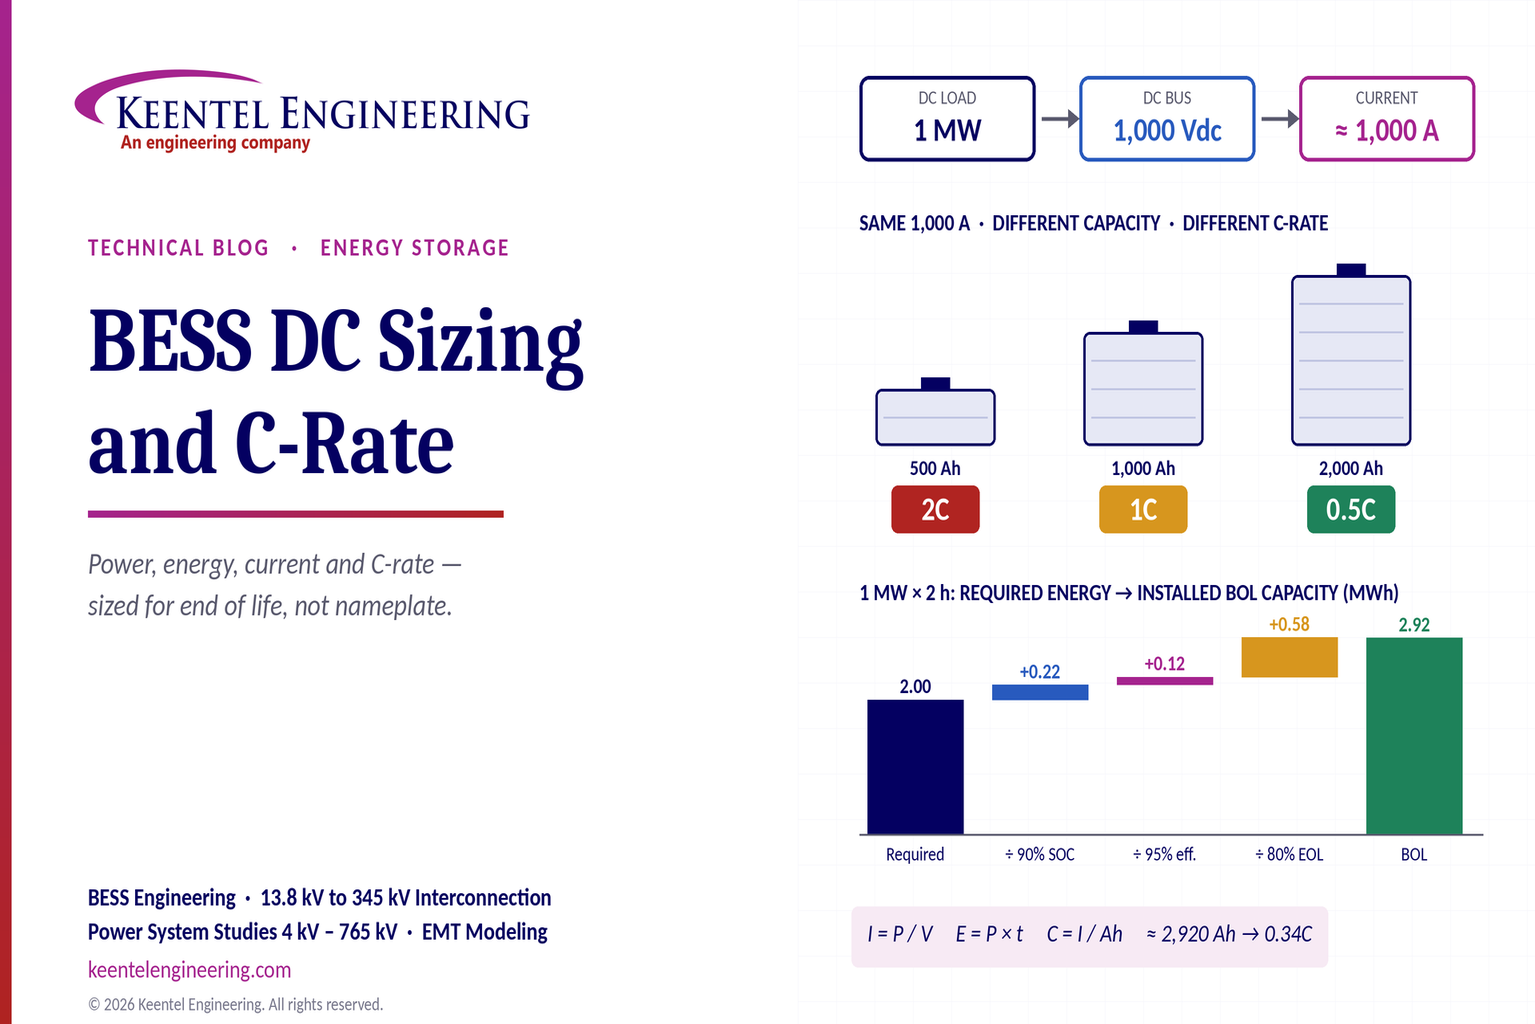
BESS DC sizing and C-rate comparison showing battery capacity, discharge rates, and energy storage s
By SANDIP R PATEL • October 10, 2026
Learn BESS DC sizing with power, energy, current and C-rate calculations, battery losses, degradation and a 100 MW/400 MWh utility-scale example.
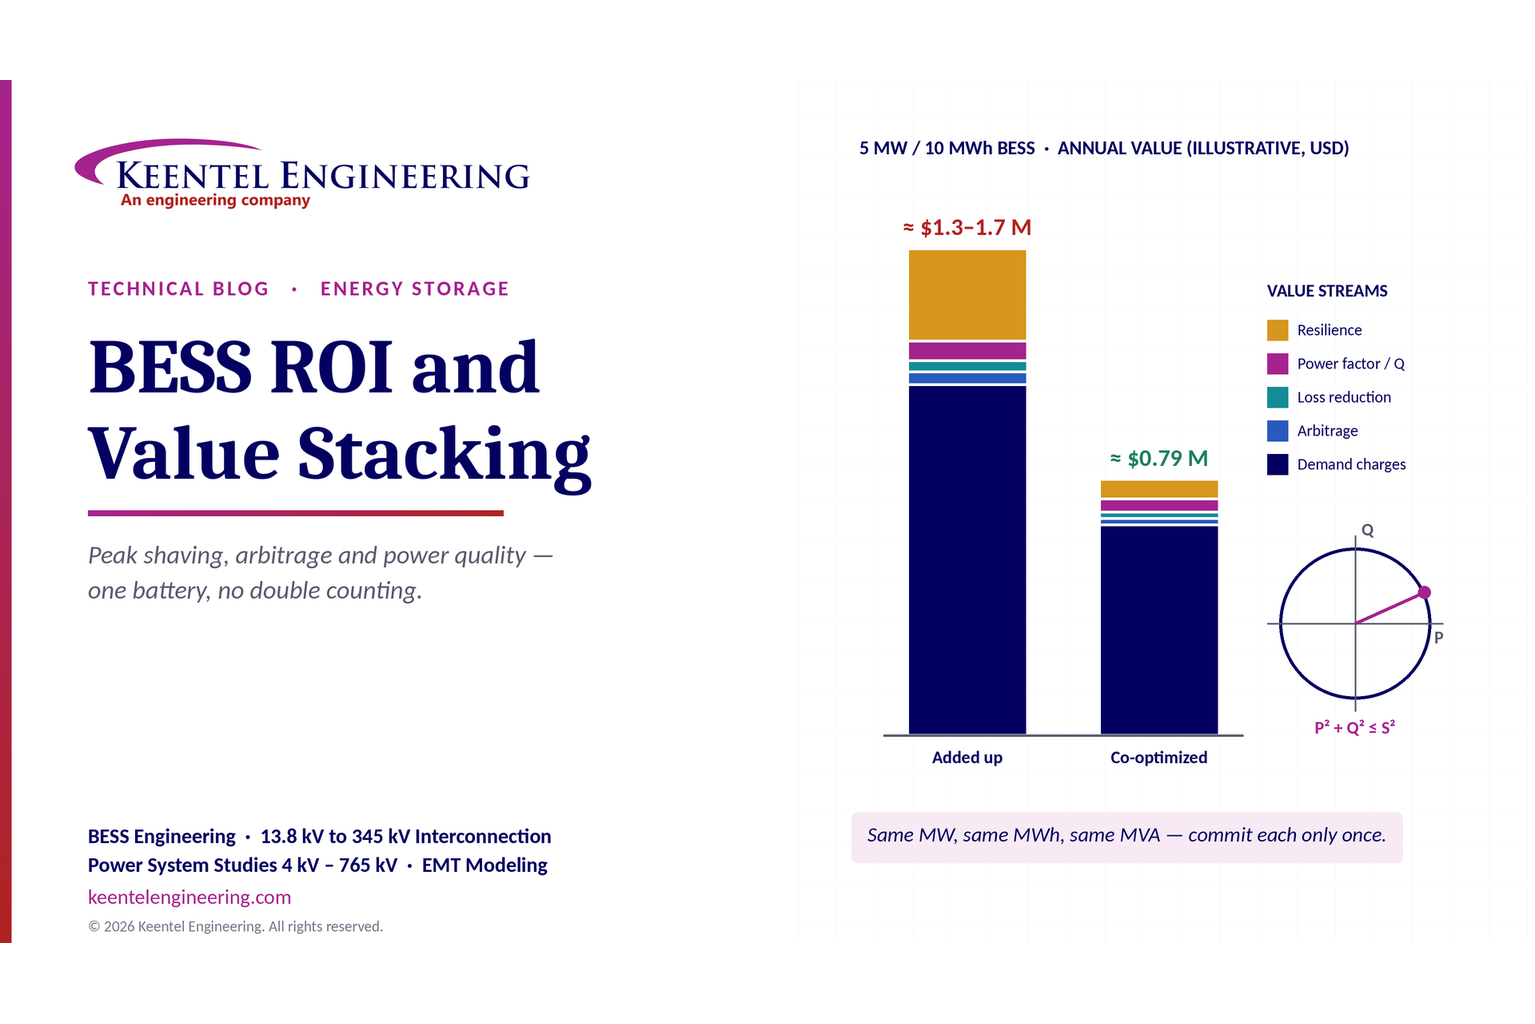
BESS ROI and value stacking comparison showing battery energy storage revenue streams, peak shaving,
By SANDIP R PATEL • October 10, 2026
Learn how BESS ROI is calculated using peak shaving, energy arbitrage, power quality and battery storage economics, with a practical 5 MW/10 MWh example.
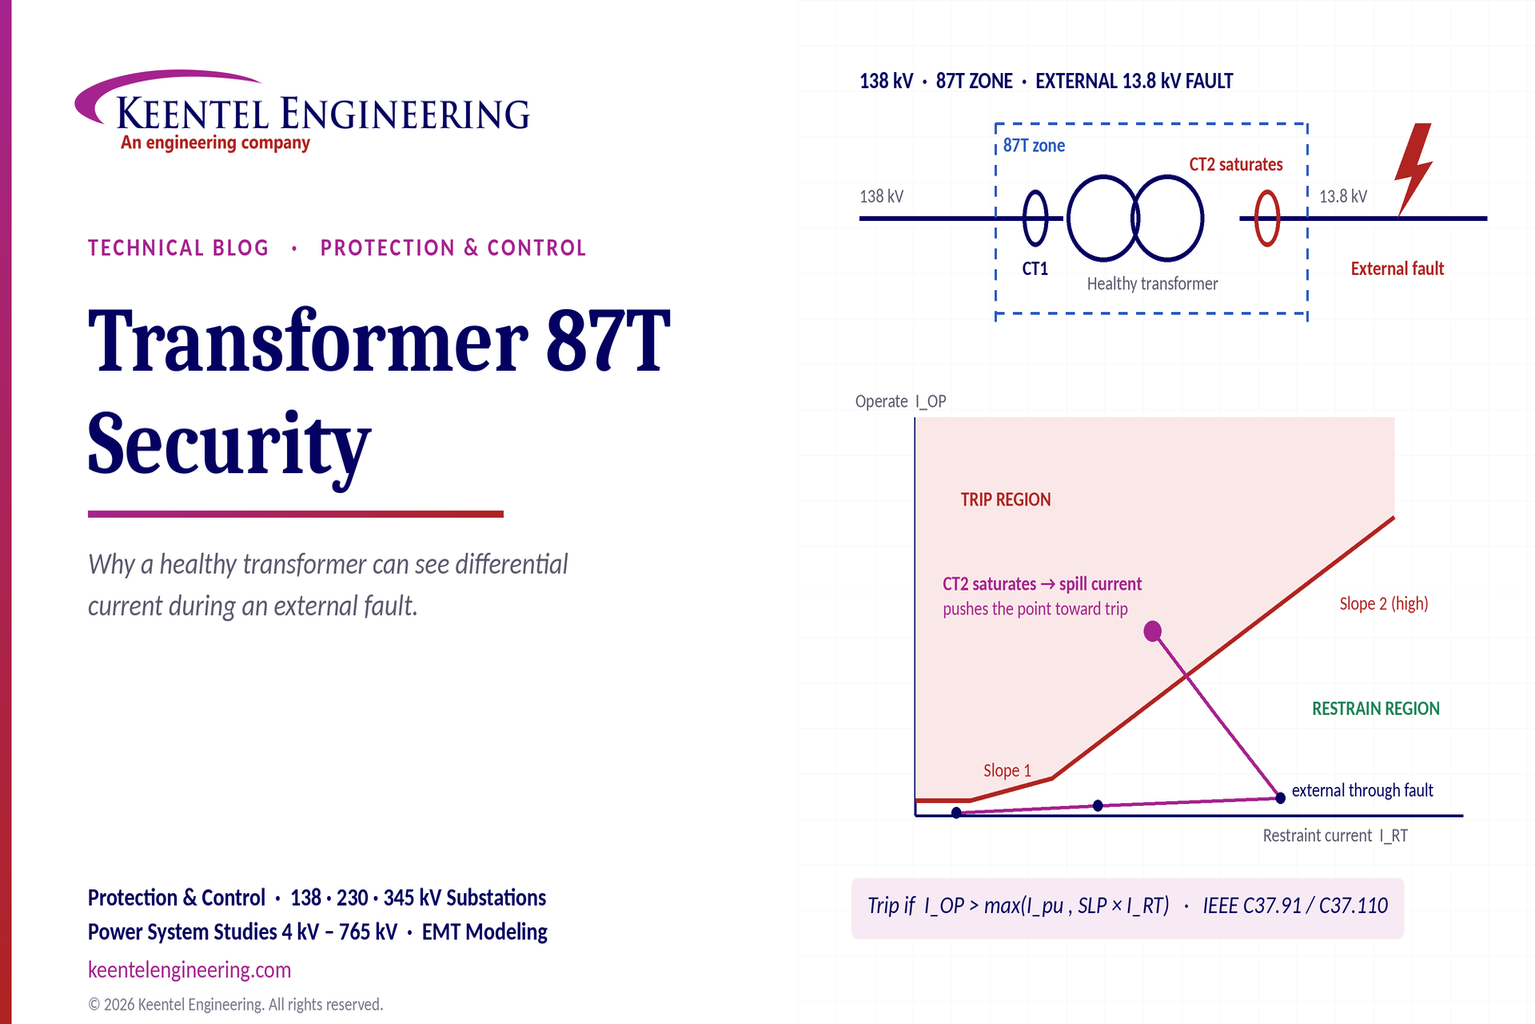
Transformer 87T differential protection diagram showing CT saturation, external faults, and relay tr
By SANDIP R PATEL • October 10, 2026
Learn why transformer differential relays detect current during external faults, how CT saturation causes spill current, and how secure 87T protection prevents trips.
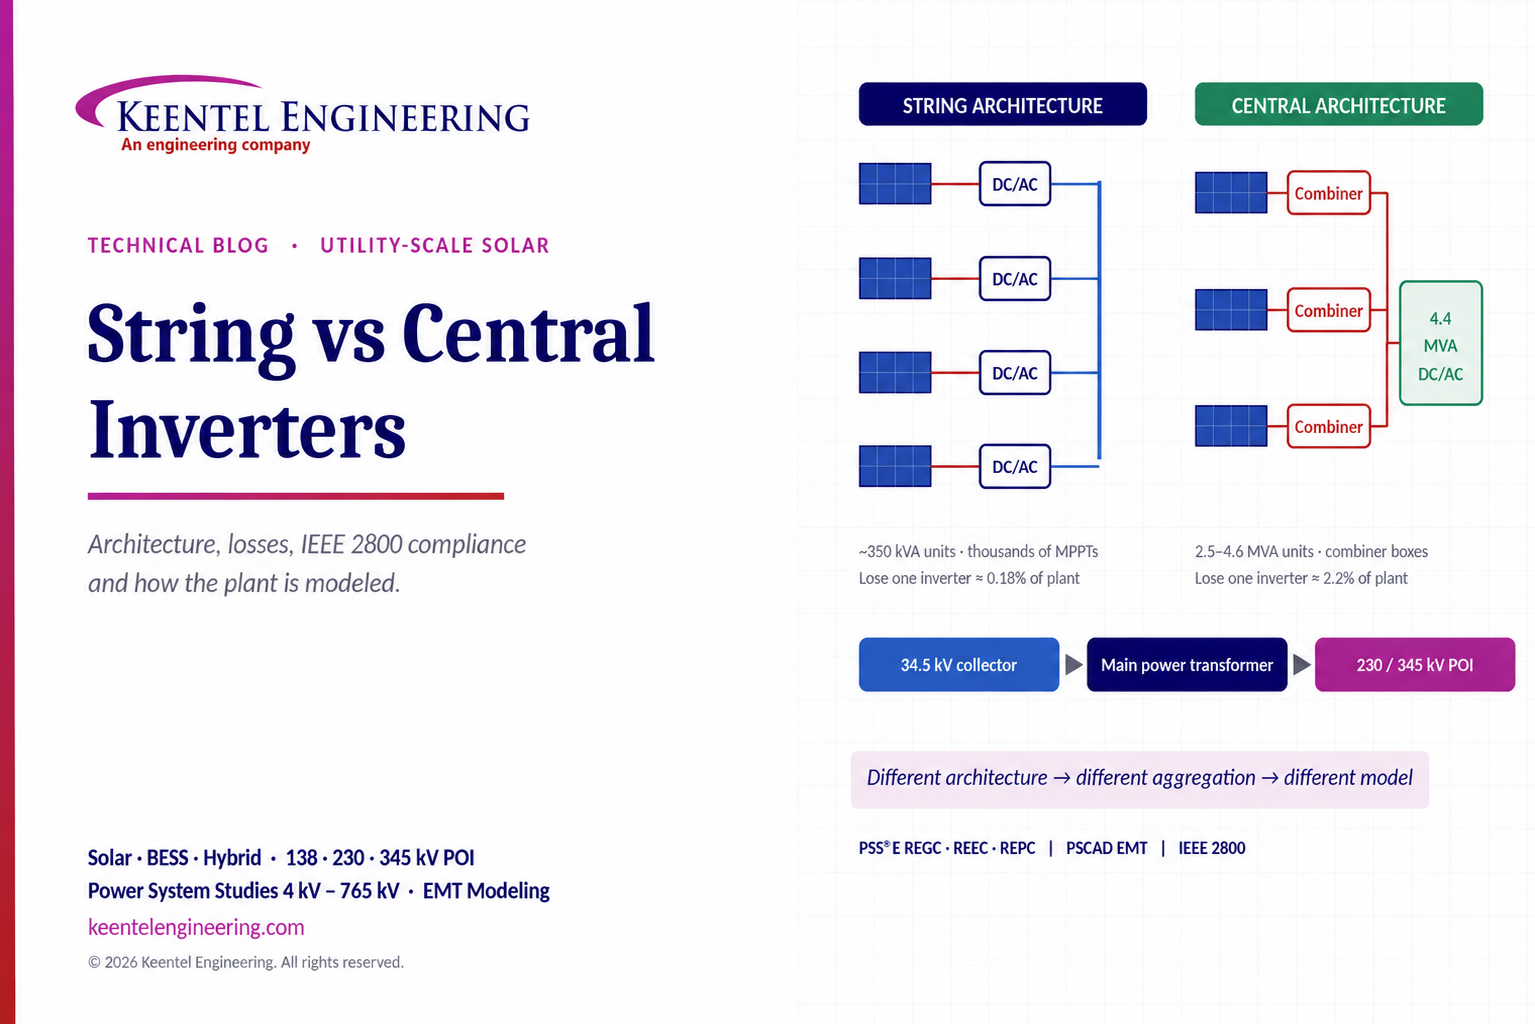
SEO Alt Text: String vs central solar inverters comparison showing PV system architecture, DC/AC con
By SANDIP R PATEL • October 10, 2026
Compare string vs central inverters for utility-scale solar, including efficiency, maintenance, grid compliance, reactive power and interconnection studies.

345 kV transmission line insulator swing angle and ROW width diagram.
By SANDIP R PATEL • October 9, 2026
Learn how insulator swing angle and conductor blowout affect transmission line ROW width, with NESC clearances, NERC FAC-003 guidance, and a 345 kV example. Copy
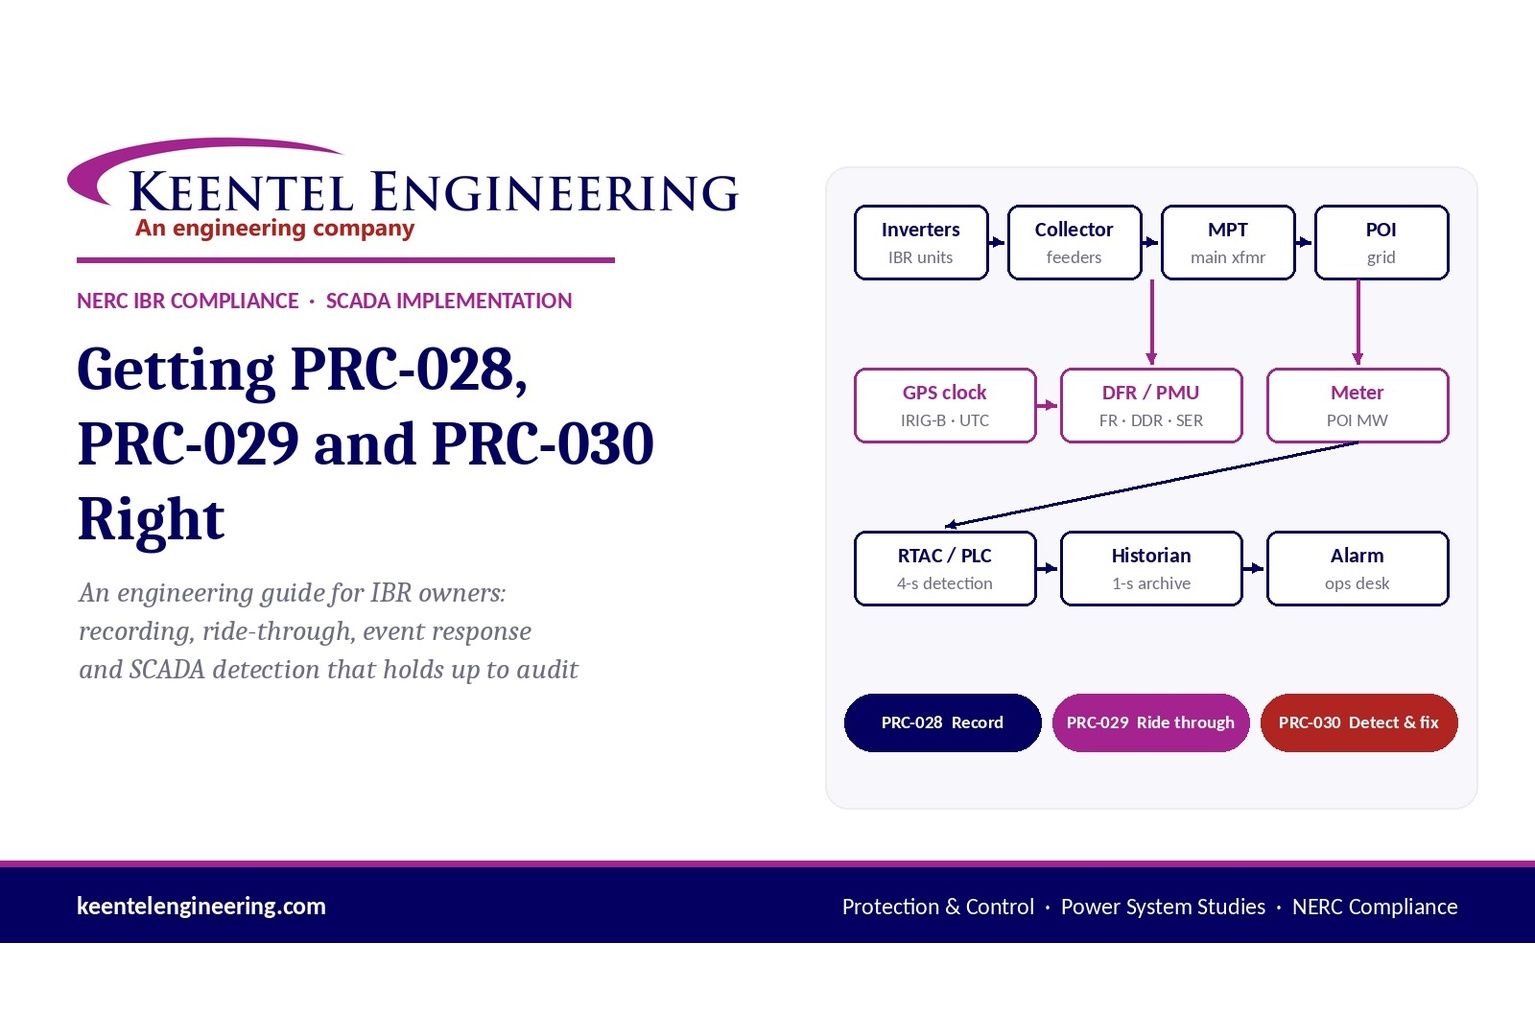
PRC-028 PRC-029 and PRC-030 NERC IBR compliance guide
By SANDIP R PATEL • October 3, 2026
Engineering guide to PRC-028 disturbance recording, PRC-029 ride-through and PRC-030 event detection for inverter-based resources.





