


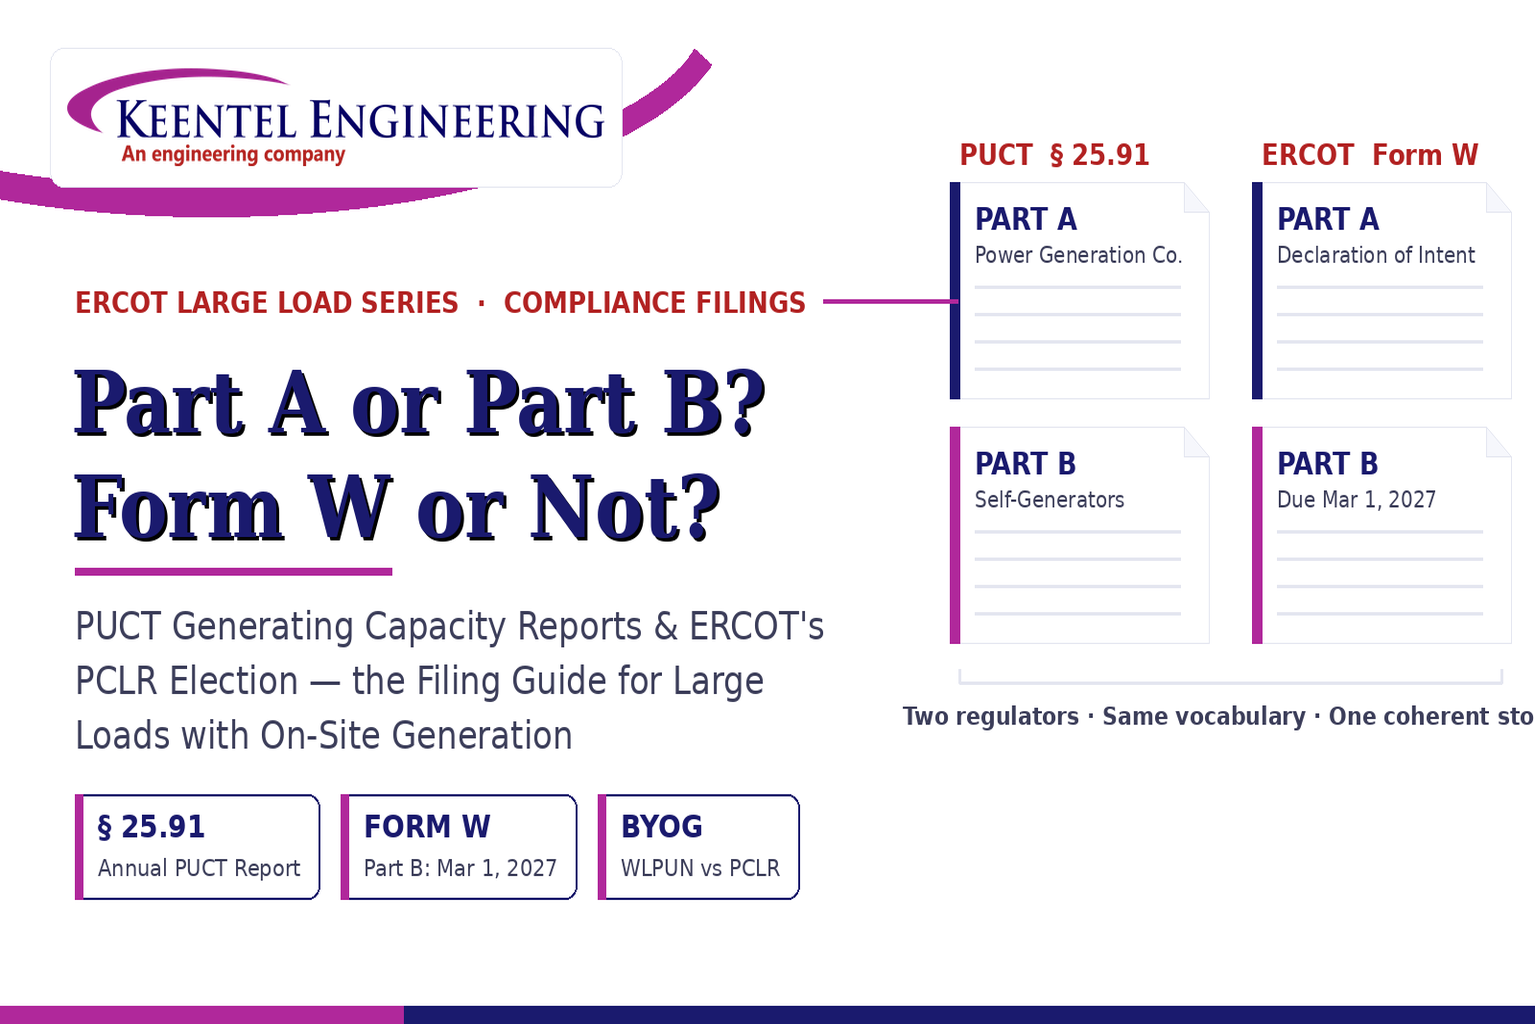
Learn the differences between the PUCT Generating Capacity Report and ERCOT Form W, including Part A vs Part B, PCLR, WLPUN, BYOG projects, and Batch Zero compliance.
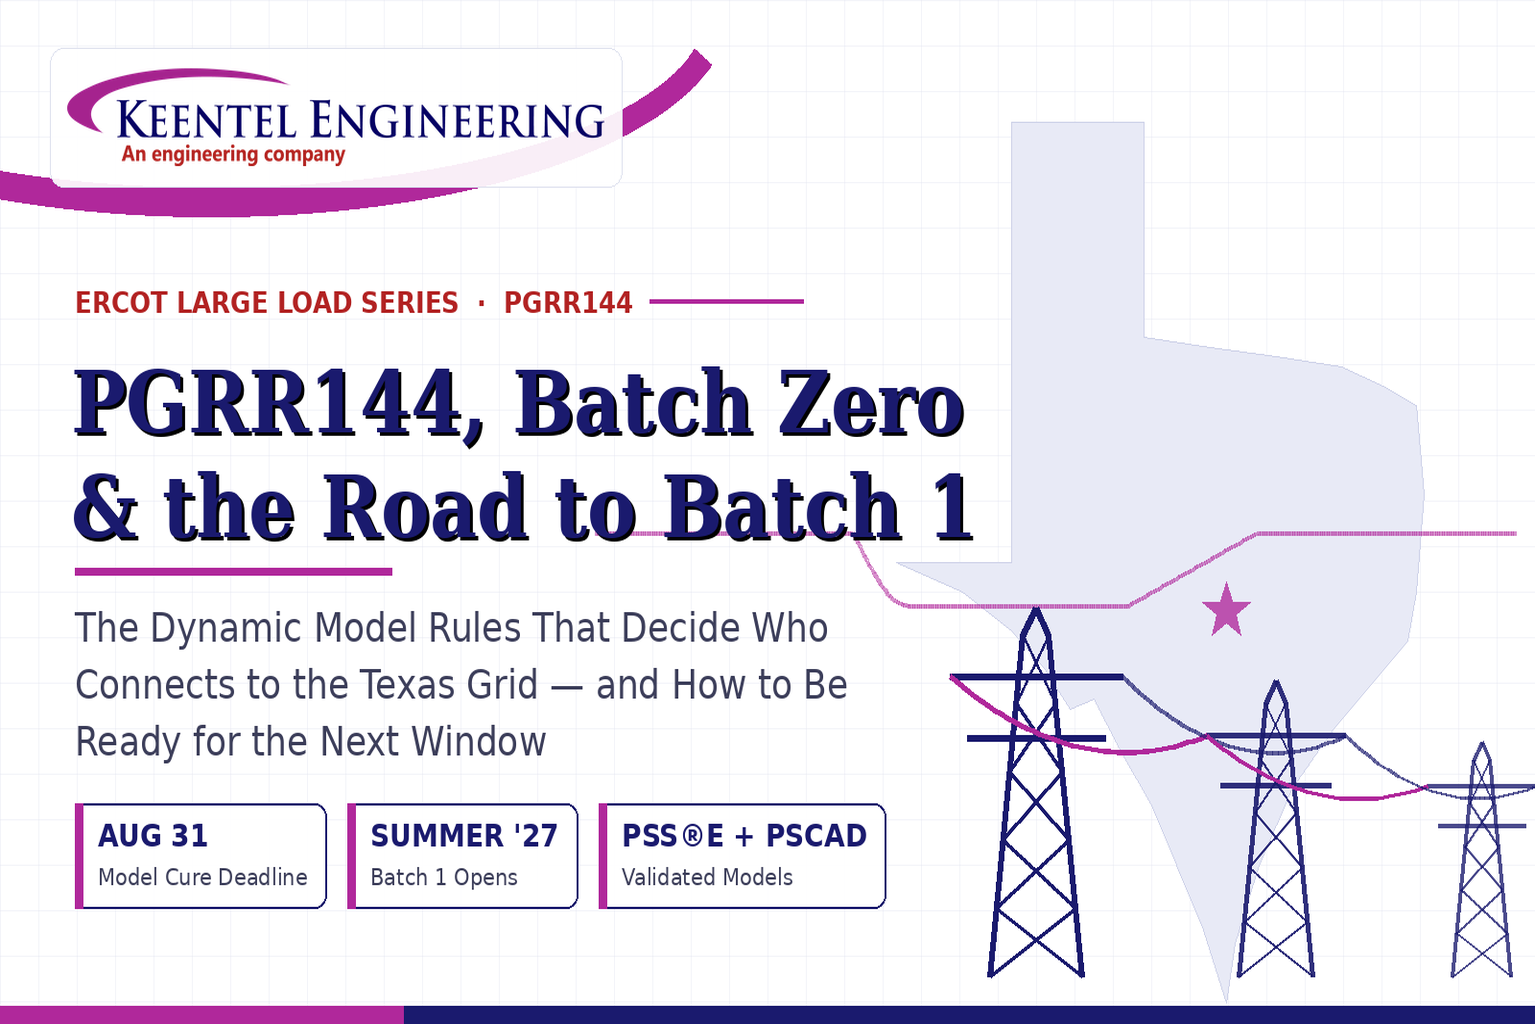
Learn how PGRR144, Batch Zero, and Batch 1 affect ERCOT large-load interconnections, dynamic model requirements, MQT testing, PERC1, and project readiness.
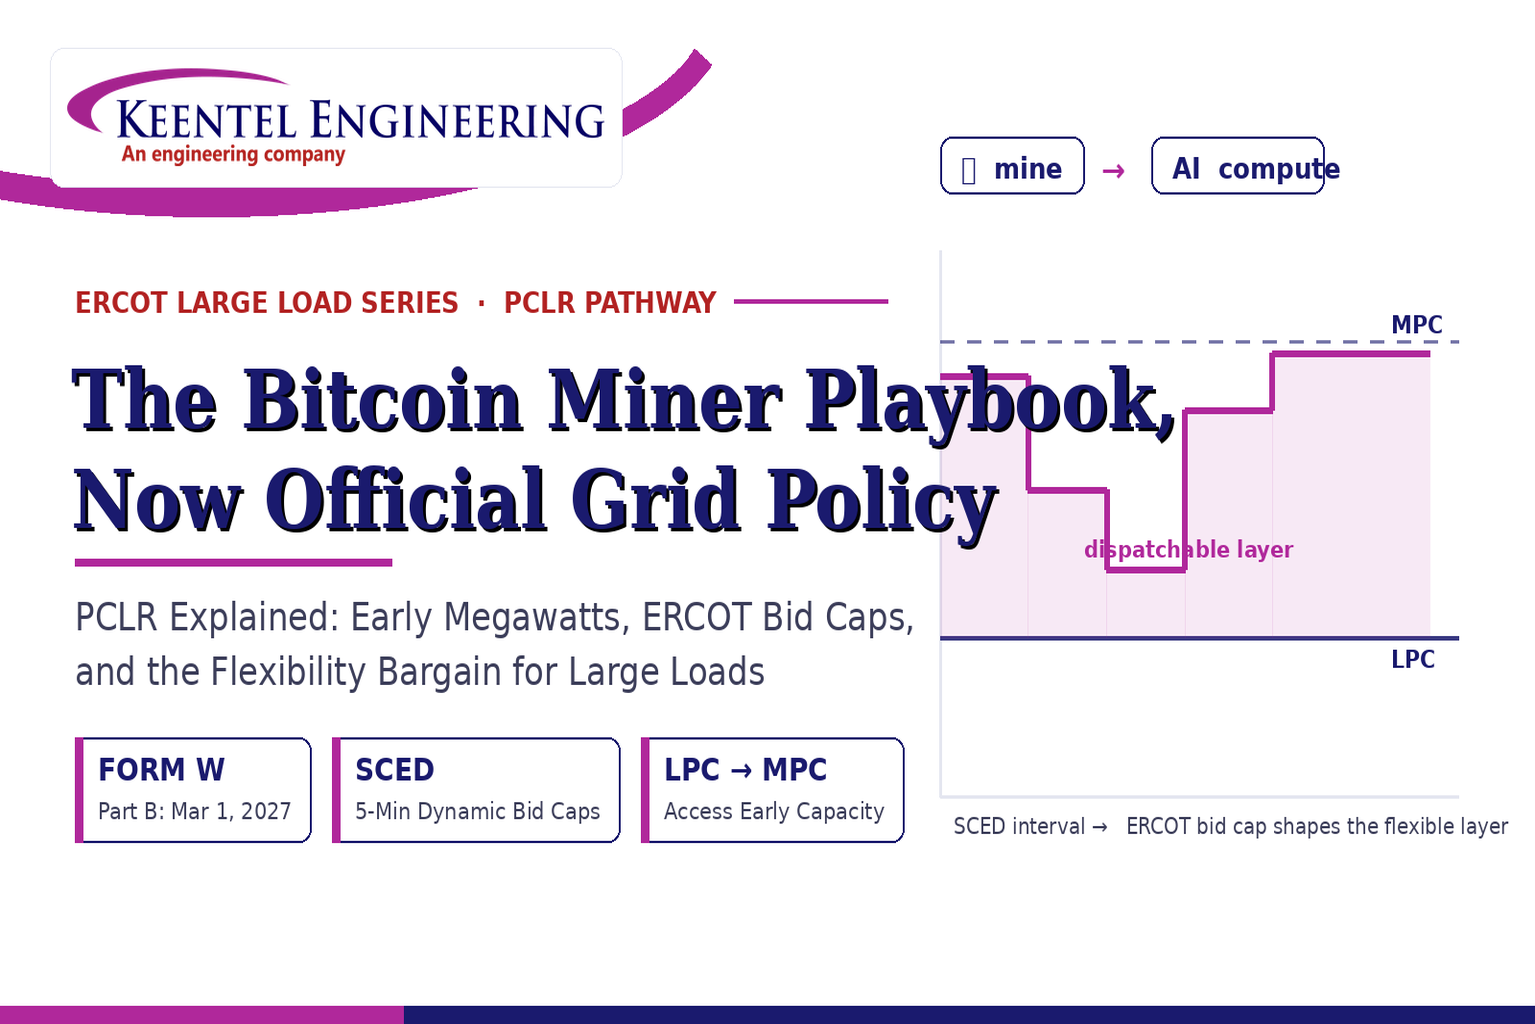
ERCOT PCLR Batch Zero large-load interconnection pathway
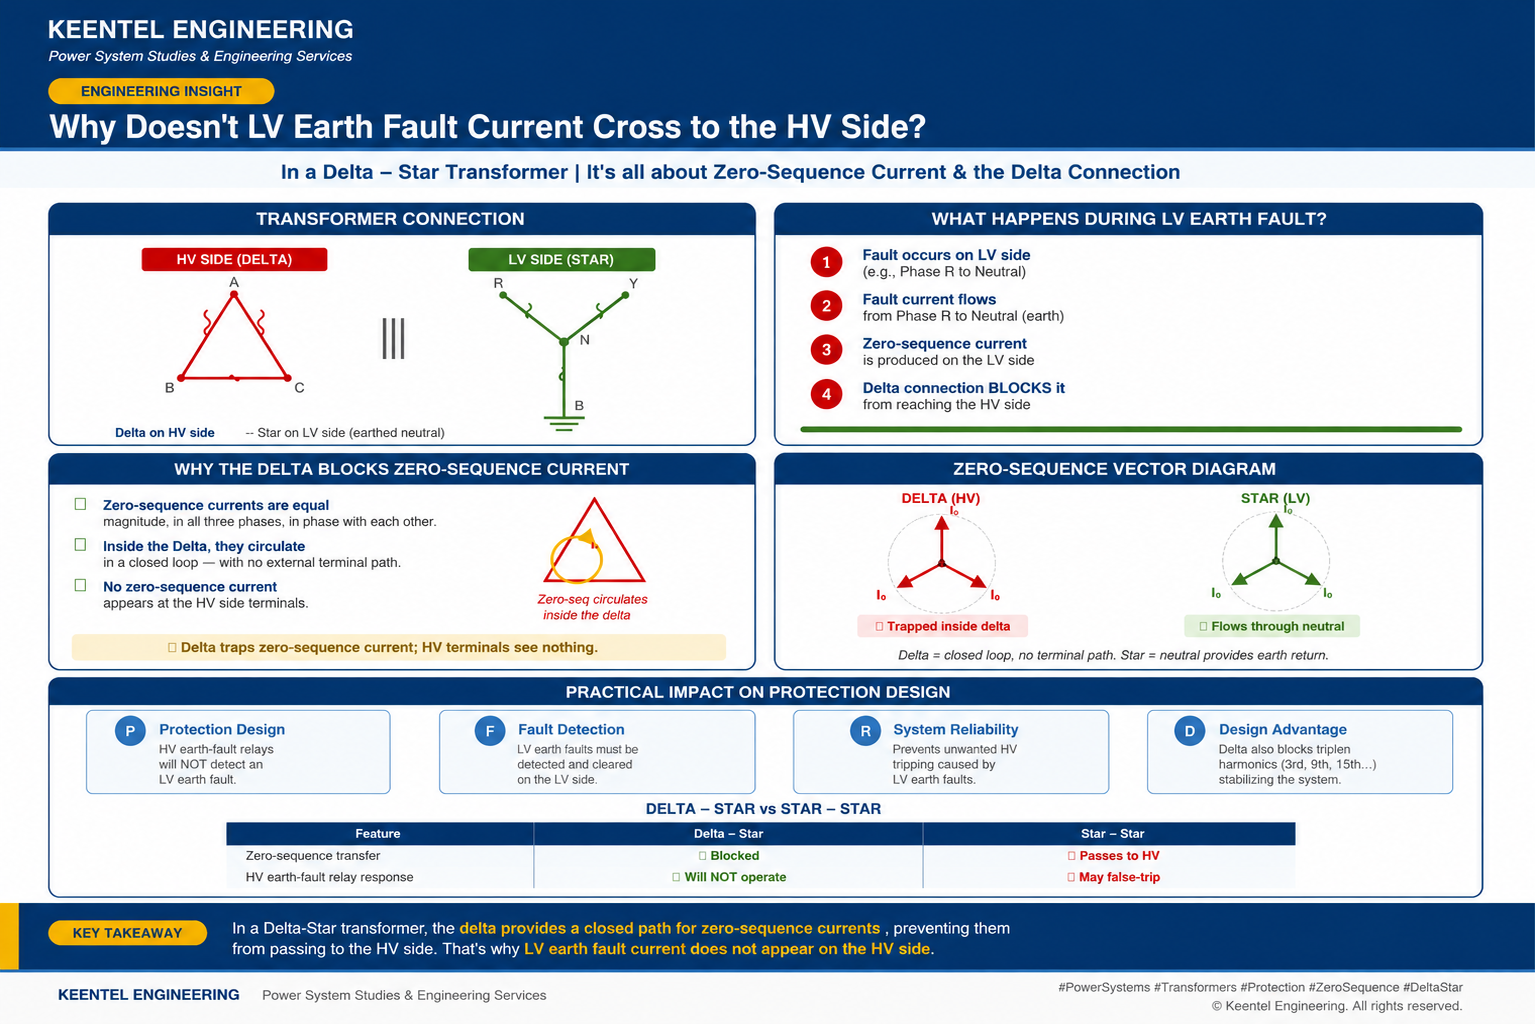
Learn why LV earth-fault current cannot cross a Delta-Star transformer, how zero-sequence current behaves, and what it means for protection design.
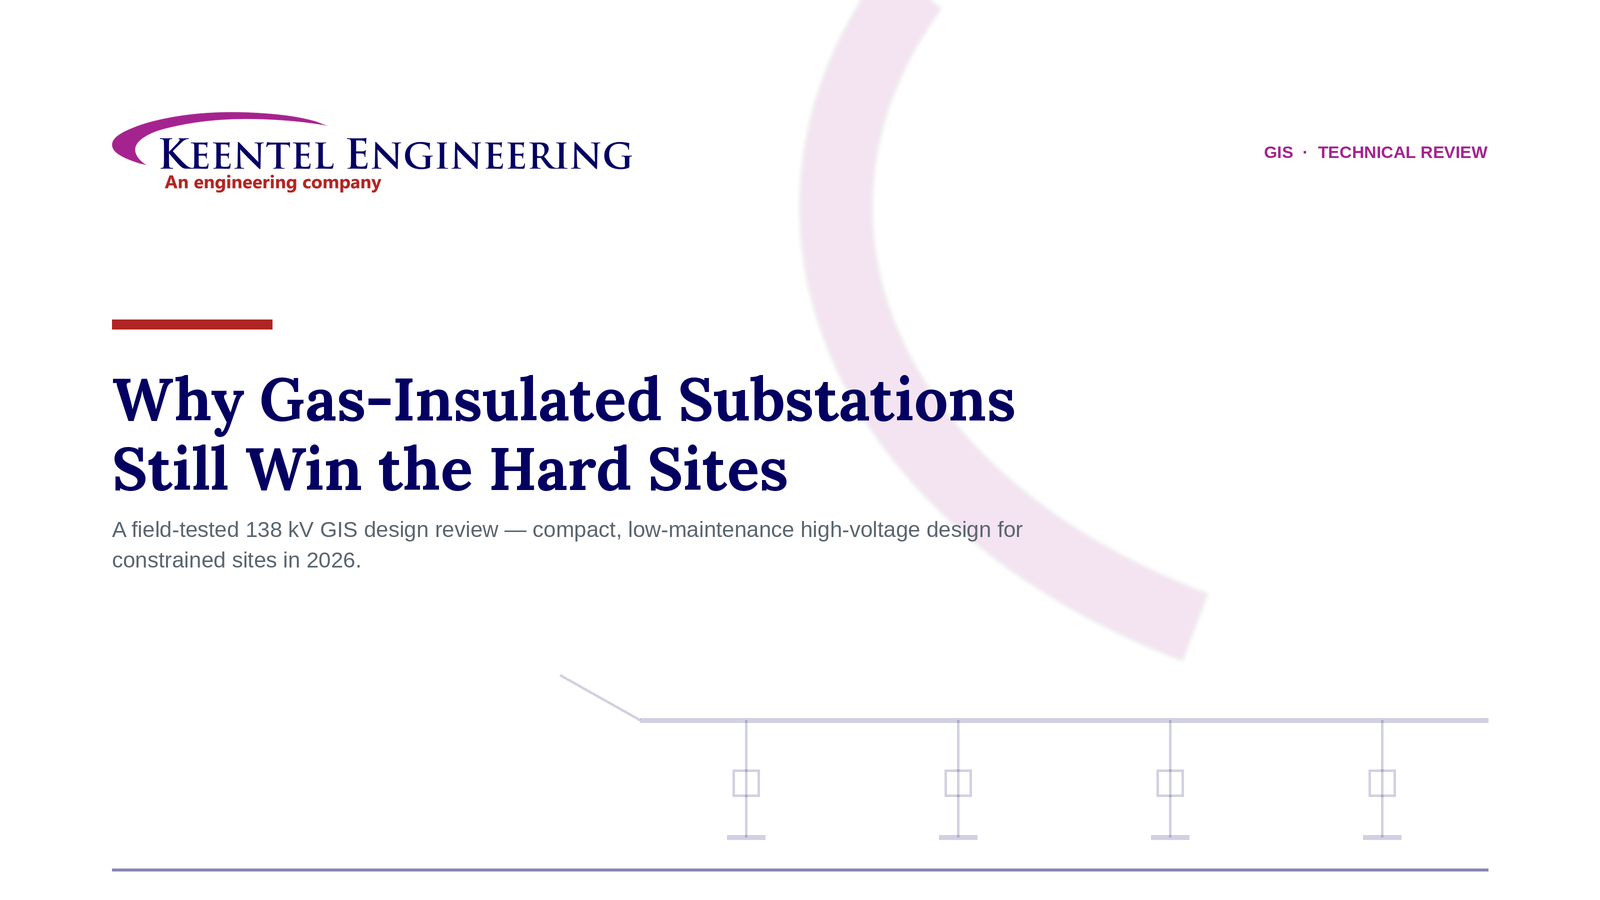
Learn how gas-insulated substations (GIS) improve safety, reliability, and space efficiency with 138 kV design, protection, insulation coordination, and real-world case studies.
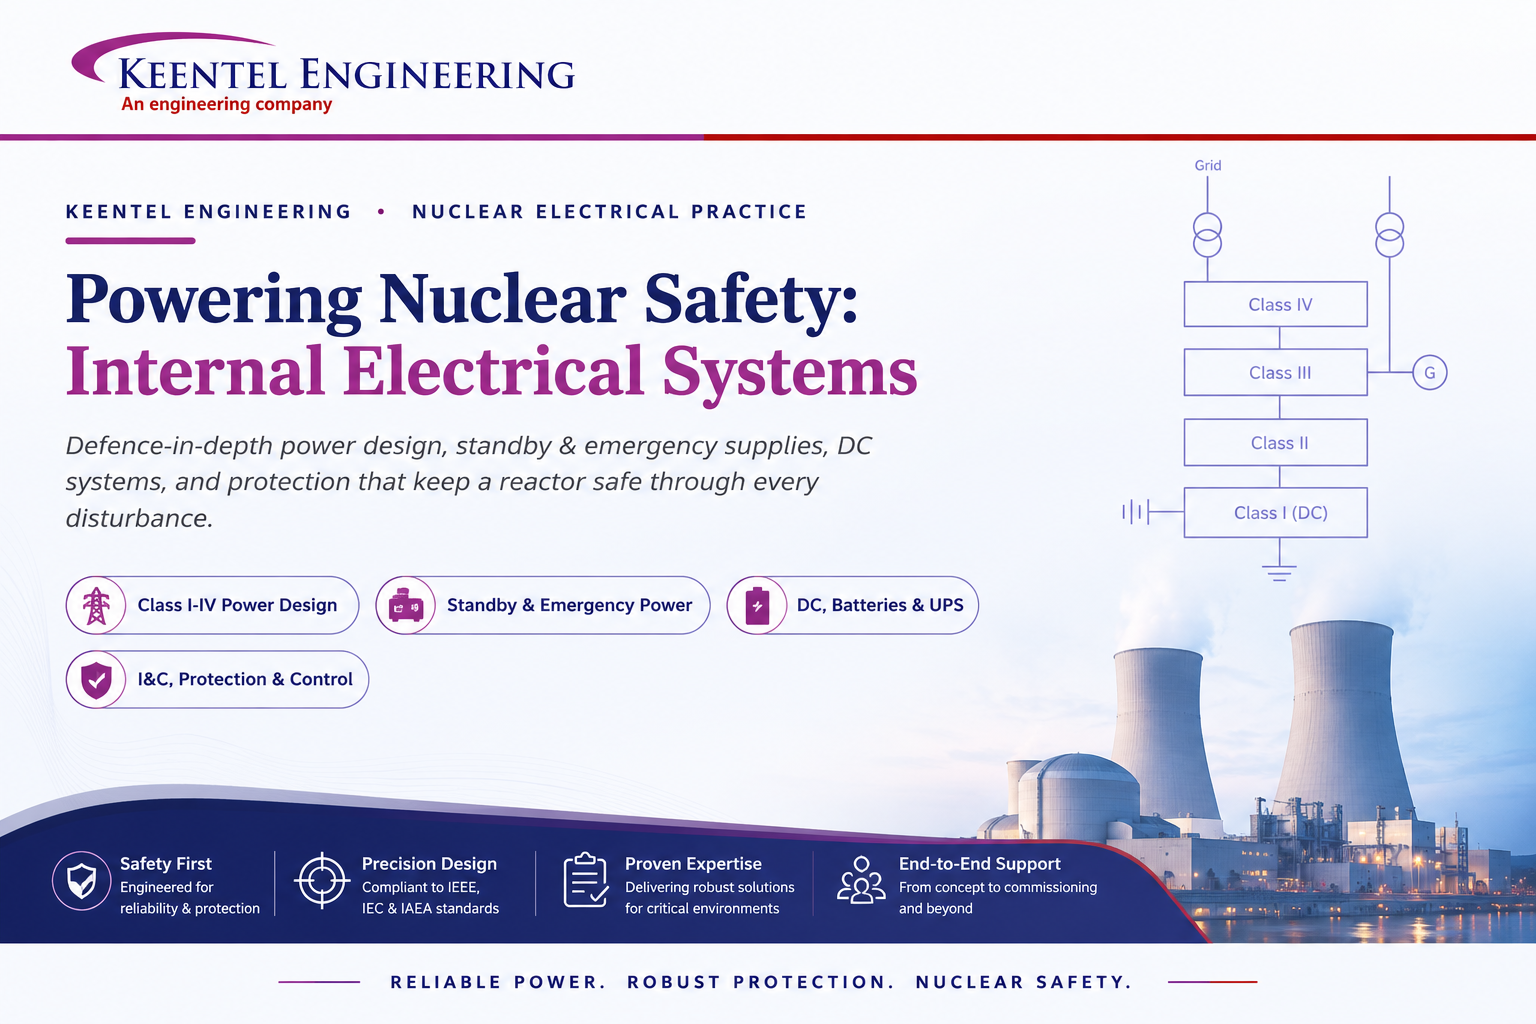
Learn how Class I–IV electrical systems, defence-in-depth, standby and emergency power, DC systems, protection, and load transfer ensure nuclear power plant safety.
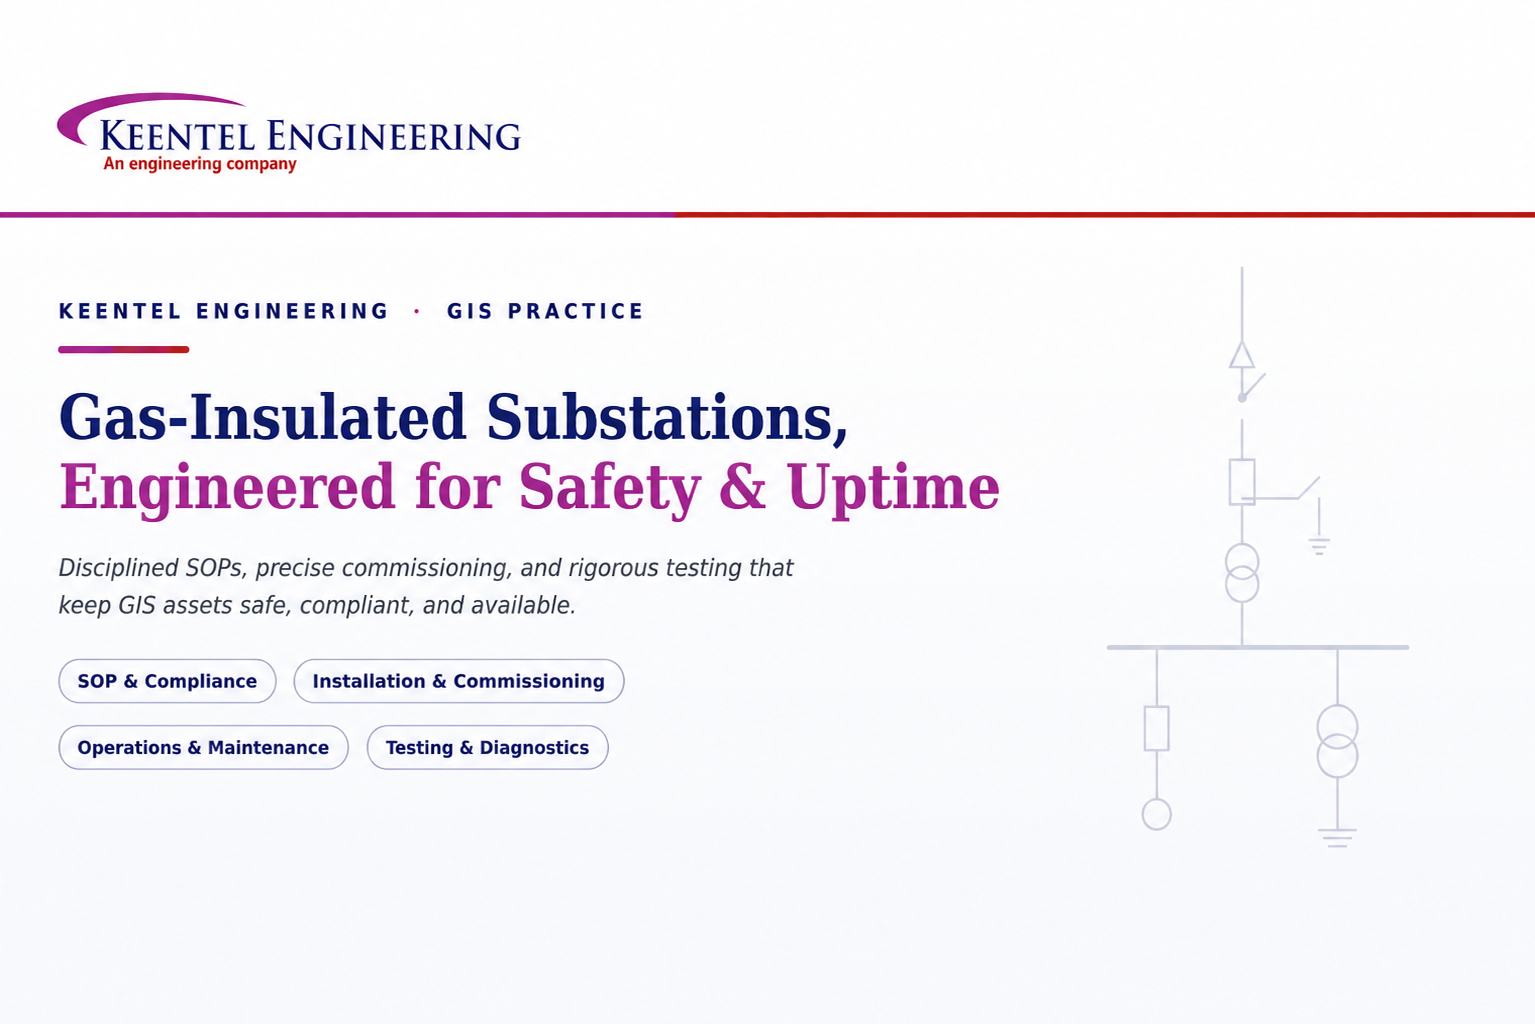
Learn GIS substation safety best practices, SOPs, commissioning, maintenance, interlocking, earthing, and testing to improve grid reliability and uptime.
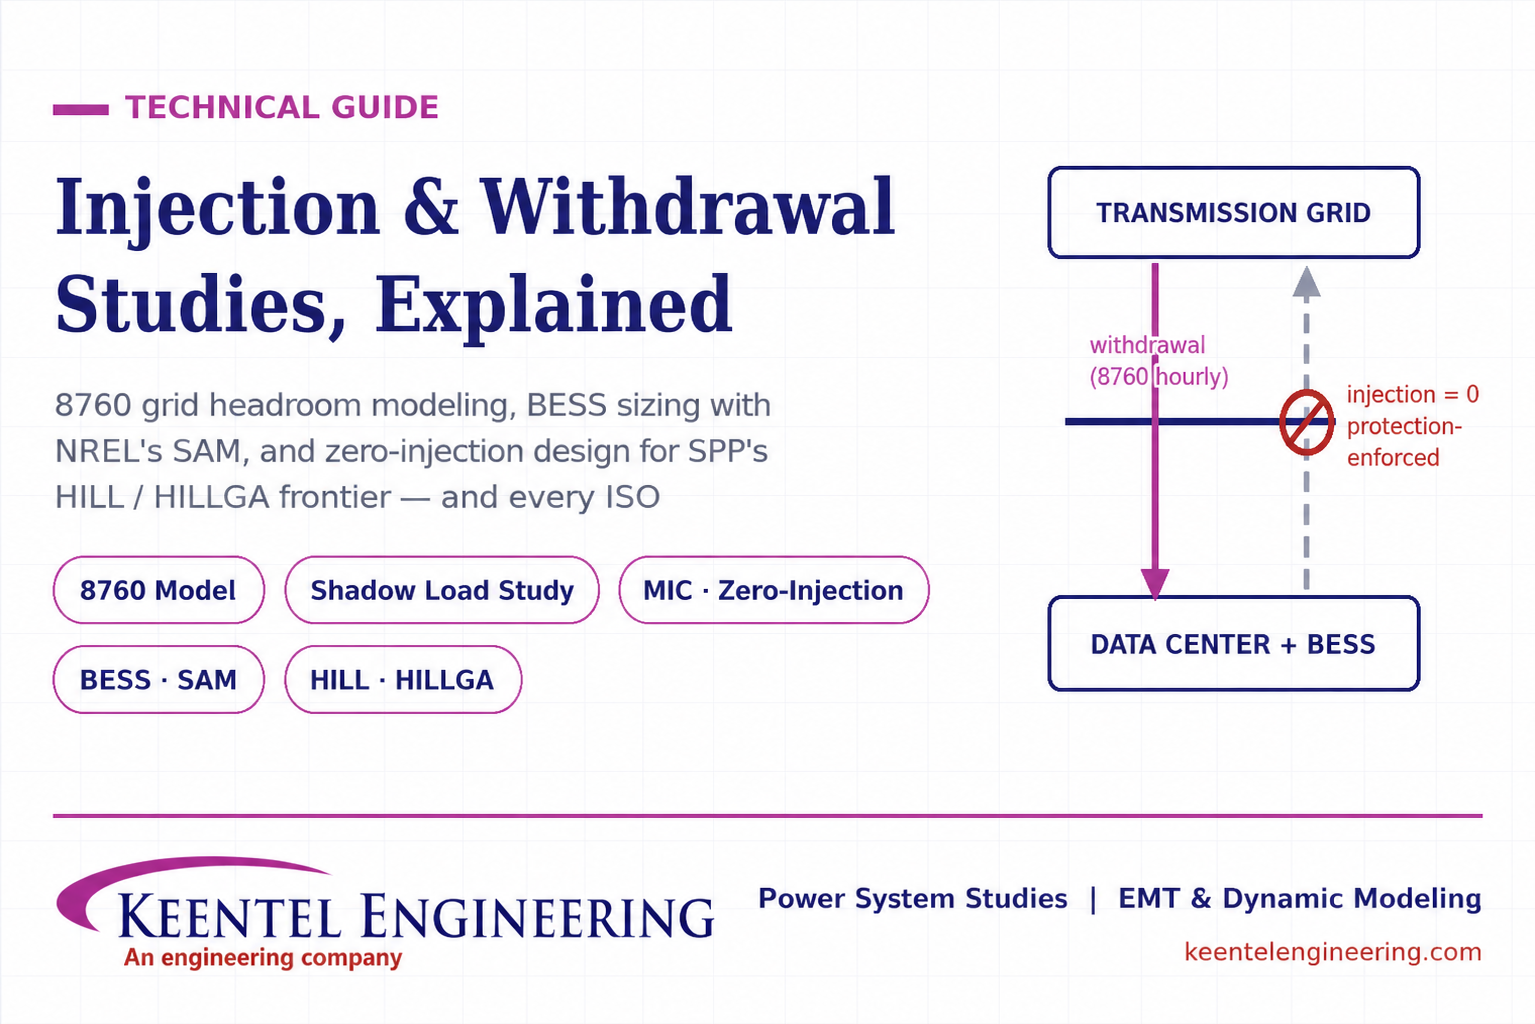
Learn how injection and withdrawal studies, 8760 headroom modeling, zero-injection engineering, and SPP HILLGA improve large load grid interconnections
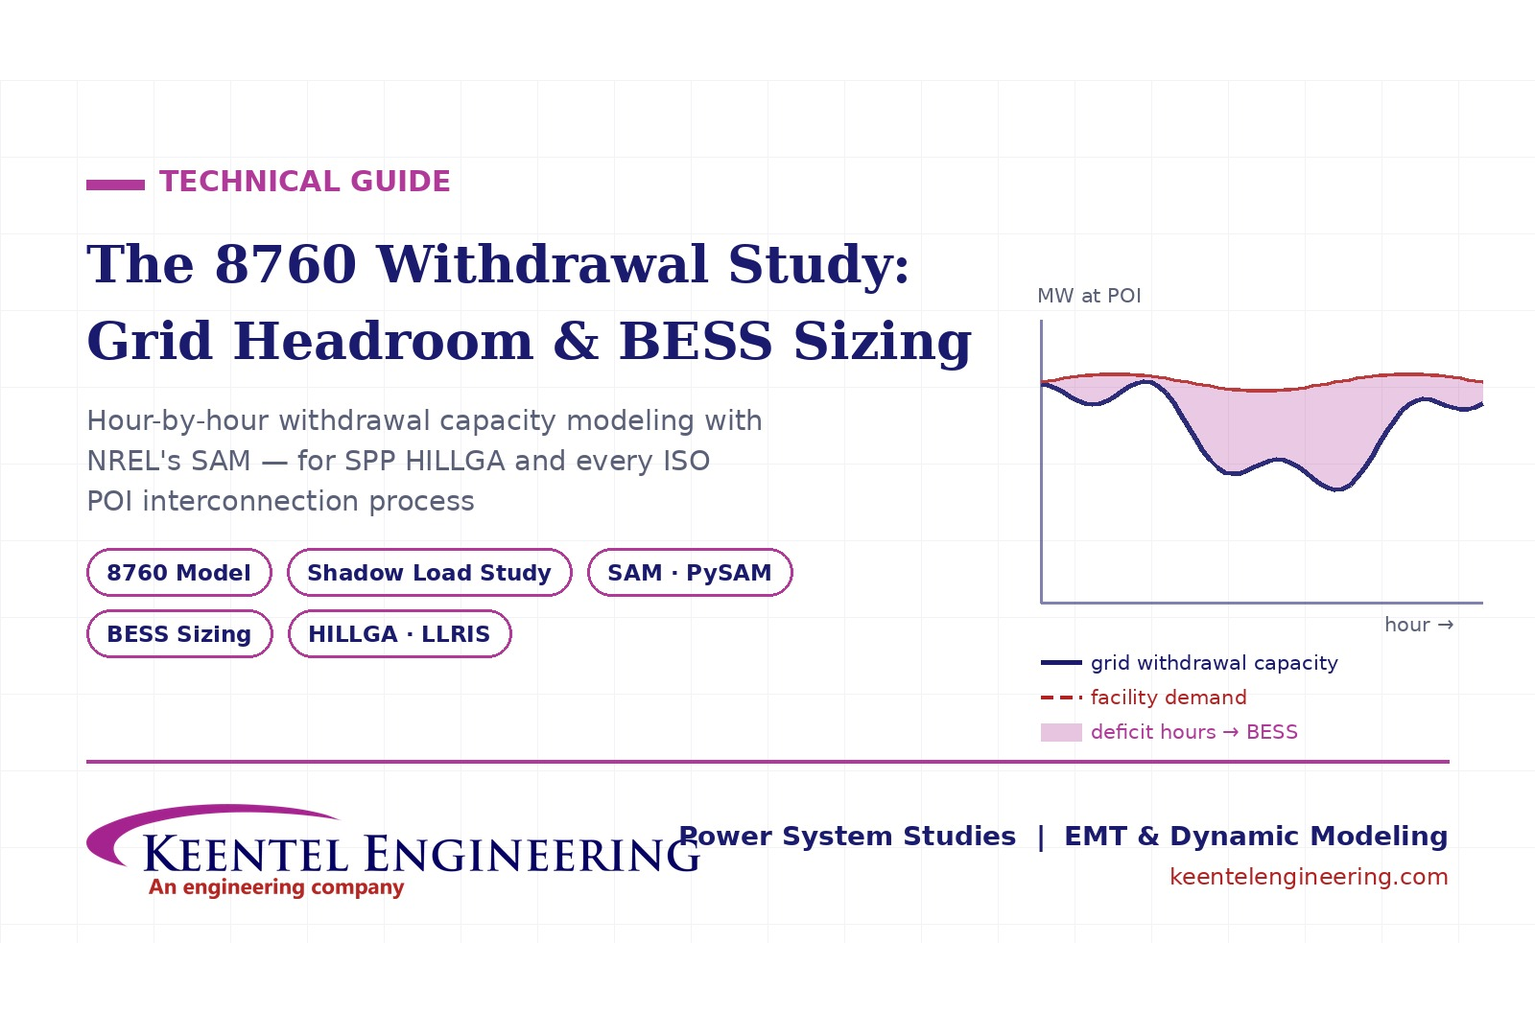
Learn how an 8760 withdrawal study models hourly grid headroom and uses SAM-based BESS sizing for large-load interconnection projects.