
A Coordinated Electric System Interconnection Review—the utility’s deep-dive on technical and cost impacts of your project.
Challenge: Frequent false tripping using conventional electromechanical relays
Solution: SEL-487E integration with multi-terminal differential protection and dynamic inrush restraint
Result: 90% reduction in false trips, saving over $250,000 in downtime
The three operating regions you have to design to
| Device | Output vs voltage | Response | Best suited to | Main limitations |
|---|---|---|---|---|
| Mechanically switched capacitor or reactor | Proportional to voltage squared | Seconds; discrete steps; limited switching operations per day | Steady-state reactive supply, voltage profile, loss reduction | No dynamic capability; step voltage change on switching; capability collapses when most needed |
| Static var compensator | Capacitive branches proportional to voltage squared | A few cycles; continuously controllable | Continuous control where cost matters and deep voltage support is not the driver | Square-law capability loss; harmonic filters are part of the plant and interact with the network |
| STATCOM | Approximately proportional to voltage — constant current capability | One to two cycles closed loop; converter response faster still | Voltage stability margin, weak interconnections, fast disturbance recovery, flicker and unbalance compensation | Higher capital cost; converter losses; adds a converter and its control dynamics to the network |
| Synchronous condenser | Governed by machine capability and excitation | Excitation response in the hundreds of milliseconds; inherent inertial response instantaneous | System strength and inertia, short-circuit contribution, black start support | Rotating plant with maintenance and losses; slower controlled response than a converter |
| STATCOM with energy storage | Reactive as a STATCOM, plus real power within the storage rating | As STATCOM for reactive; real power limited by storage | Where a real power deficiency is part of the problem | Cost and complexity of the storage; different failure and maintenance profile |
The Sag Formula Is the Easy Part
September 5, 2026 | Blog
Two Circulating Calculations, One Off by a Factor of Ten — What the Parabolic Sag Equation Does Not Tell You, and What Line Design Software Actually Computes
1. Executive Summary
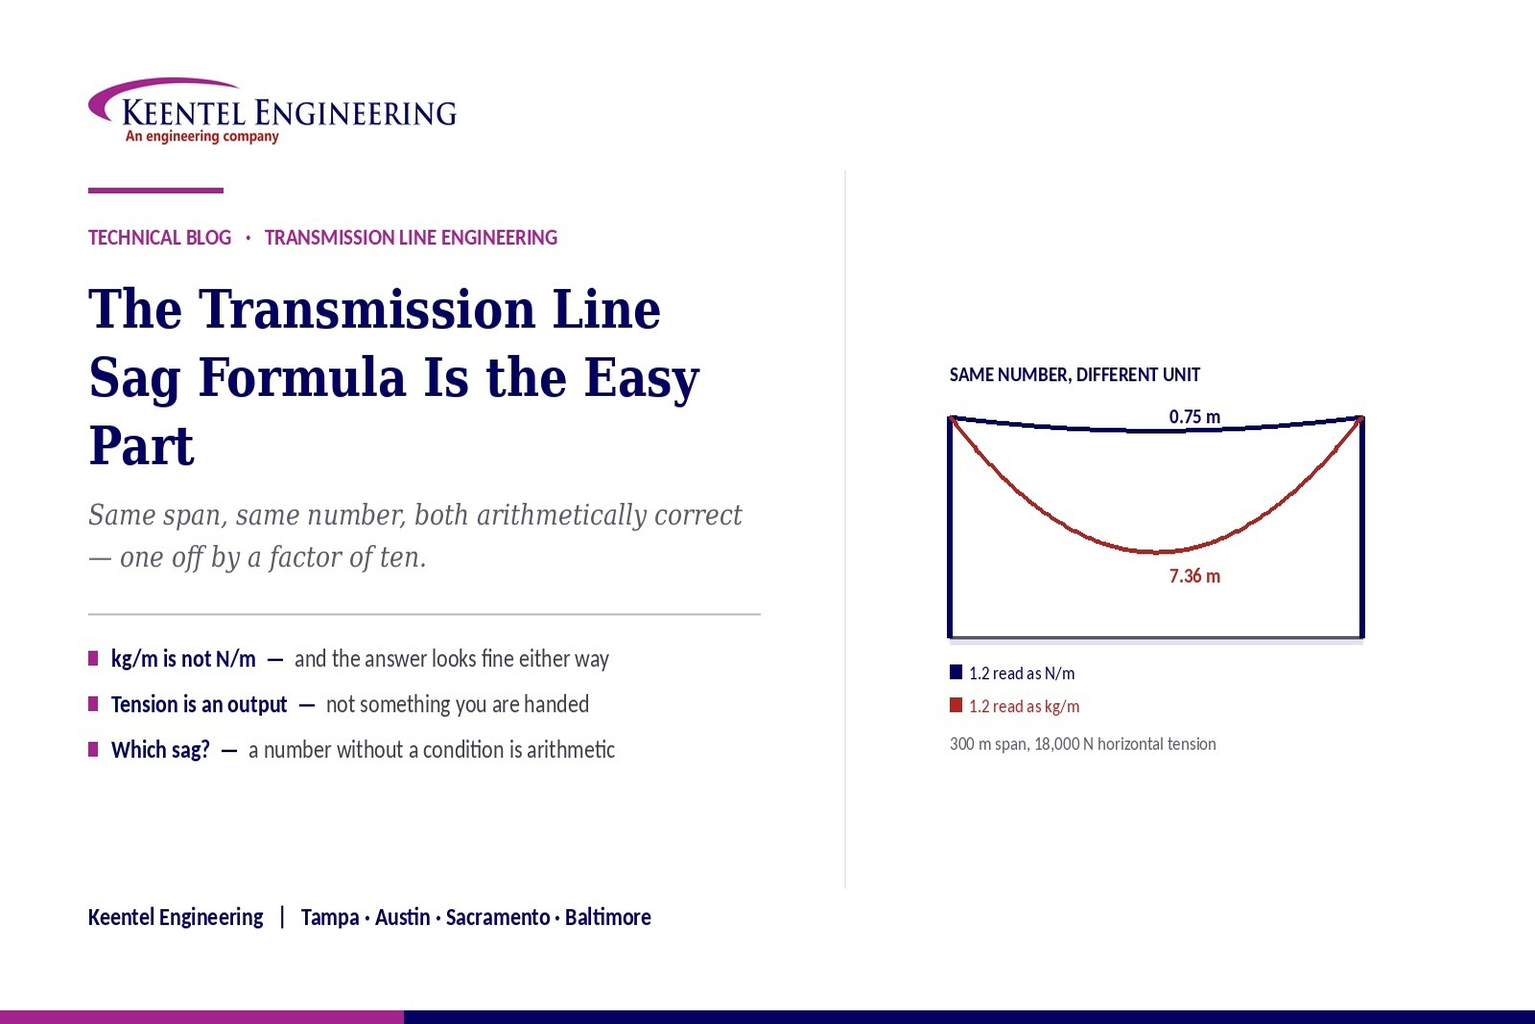
Two versions of the same transmission line sag calculation circulate widely on professional networks. Both use a three hundred metre span. Both use the number 1.2 for conductor weight. Both apply the same equation and both do the arithmetic correctly. One arrives at roughly nine metres of sag and the other at three quarters of a metre.
The difference is a unit. One treats 1.2 as kilograms per metre and multiplies by gravitational acceleration to obtain a force per unit length. The other treats 1.2 as already being newtons per metre. The second reading describes a conductor weighing about a hundred and twenty grams per metre — roughly a tenth of any transmission conductor in service — and produces a sag that is physically impossible over that span.
That is a good illustration of the real point, which is that the sag equation is the least difficult part of sag-tension engineering. It is one line of algebra, it is easy to get right, and getting it right tells you almost nothing about whether a line will be safe. The genuinely hard questions sit around it: at what condition, at what tension, with what history of loading, across a whole tension section rather than one span, on supports that are rarely level, and against a clearance requirement measured at the condition that actually governs.
Most of all, the equation takes horizontal tension as an input. In real design, tension is the unknown. It is what the sag-tension calculation solves for, at every temperature and loading condition the line must survive, from a limit the designer sets at one design condition. Presenting tension as a given inverts the problem.
This paper works through the equation and its assumptions, the change-of-state problem that sits behind it, why software is used, what an integrated line design platform genuinely computes, what automated structure spotting can and cannot know, and where survey import decides the quality of everything downstream.
The sentence worth keeping
Anyone can compute a sag. The engineering is knowing which sag, at which condition, at a tension nobody handed you, over a section rather than a span.
A number without those four qualifiers is not a design quantity. It is arithmetic.
2. Two Posts, Same Number, Two Answers
Set the two calculations side by side, because the comparison makes the point better than any explanation.
| Version A | Version B | |
|---|---|---|
| Span | 300 m | 300 m |
| Conductor weight as stated | 1.2 kg/m | 1.2 N/m |
| Weight per unit length used | Multiplied by 9.81 to give about 11.77 N/m | Used directly as 1.2 N/m |
| Horizontal tension | 15,000 N | 18,000 N |
| Resulting sag | About 8.83 m | 0.75 m |
| Is the arithmetic correct? | Yes | Yes |
| Is the result physically sensible? | Yes | No |
Version B is internally consistent and describes a conductor that does not exist. A weight of 1.2 newtons per metre corresponds to about a hundred and twenty grams per metre. A common aluminium conductor steel reinforced transmission conductor weighs on the order of one and a half kilograms per metre — roughly sixteen newtons per metre, more than ten times the figure used.
Correcting only the unit and leaving everything else in Version B unchanged gives a sag of about 7.4 metres rather than 0.75. That is the difference between a line that clears a road and one that does not, and it arrived through a single mislabelled unit in an otherwise flawless calculation.
Why this is worth dwelling on
The error is not a mistake in method. Both calculations apply the right equation and both divide correctly. The failure is in the physical sense check that nobody performed.
Three quarters of a metre of sag on a three hundred metre span implies a catenary constant of fifteen thousand metres. Nothing strung at practical tension behaves that way. A designer who glanced at the answer and asked whether it looked like a real span would have caught it in seconds.
3. What the Formula Actually Says
The parabolic sag equation states that mid-span sag equals the weight per unit length multiplied by the span squared, divided by eight times the horizontal tension.
D = w L² / (8 H)
Three things about it are worth stating precisely, because each is a place where the formula is misused.
- The weight term is a force per unit length, not a mass per unit length. In metric working, a conductor catalogue weight in kilograms per metre must be multiplied by gravitational acceleration first. In North American practice, conductor weight is published in pounds per foot and tension in pounds — both already forces — so no conversion step exists, which is precisely why the error appears when sources from different markets are mixed.
- The tension term is the horizontal component, which is constant along the span. It is not the tension at the support, which is higher because the conductor is inclined there. Conductor strength checks are made against the support tension, so using the horizontal value where the support value is required understates the loading.
- Weight divided into tension gives a length, and that length — the catenary constant — is the single parameter that characterises a span. Sag is simply the span squared divided by eight times that constant. It is not merely algebra; the catenary constant is used directly in vibration assessment, which Section 9 returns to.
For the corrected Version A figures, the catenary constant is about twelve hundred and seventy metres, and the support tension exceeds the horizontal tension by well under one percent. On a long crossing span with deep sag that margin grows and stops being negligible.
4. Parabola or Catenary?
A conductor hanging under its own weight follows a catenary, which is a hyperbolic cosine. The parabola is an approximation to it, valid when sag is small relative to span.
It is worth knowing how good the approximation is, because the answer is reassuring and the limits are real. Working the true catenary for the corrected Version A case gives about 8.84 metres against the parabolic 8.83 — a difference of roughly one hundredth of a metre, or about a tenth of a percent. At that sag-to-span ratio, close to three percent, the parabola is entirely adequate.
The error grows with the sag-to-span ratio, and it grows in one direction: the parabola always understates sag. At a ten percent sag-to-span ratio the understatement is on the order of one percent; at fifteen percent it approaches three percent. For ordinary transmission spans the parabola is fine. For long river and valley crossings, for lightly tensioned distribution construction, and for any case where sag approaches a tenth of the span, the catenary should be used — and design software uses it throughout regardless, because there is no reason not to.
The practical guidance is simple. Use the parabola for hand checks and order-of-magnitude work. Do not use it to establish a clearance on a long span, and never use it to argue that a marginal clearance is acceptable, because the direction of its error works against you.
5. The Input That Is Really an Output
This is the most consequential thing the circulating posts get wrong, and it is a conceptual error rather than an arithmetic one.
Both calculations treat horizontal tension as given. In design it is not given. Tension is what the sag-tension calculation solves for, and it takes a different value at every temperature and every loading condition the line experiences.
The actual procedure runs the other way round. The designer sets a tension limit at a defined design condition — for example a maximum permitted tension under the governing ice and wind loading, expressed as a percentage of the conductor’s rated breaking strength, together with an everyday tension limit for vibration control. Those limits, with the conductor’s physical and stress-strain properties, define a reference state. From that reference state, the change-of-state equation solves for the tension at every other condition of interest, accounting for thermal expansion of the conductor and for its elastic and permanent elongation. Only then is sag computed, from the tension the calculation produced.
Two consequences follow that matter for anyone reading a sag figure.
- A sag quoted without its condition is meaningless, because the tension it came from belongs to one specific state. The same conductor on the same span has materially different sag at fifteen degrees than at its maximum operating temperature.
- Conductor properties are not optional inputs. Cross-sectional area, elastic modulus, thermal expansion coefficient and the stress-strain characteristic all enter the change-of-state solution. A calculation that needs only weight and tension is not solving the design problem — it is evaluating one already-solved state.
6. Which Sag? The Condition Is the Question
A single line has many sags, and the design has to know which one governs which check.
| Condition | What it represents | What it governs |
|---|---|---|
| Initial, at stringing temperature | Sag immediately after installation, before permanent elongation has occurred | What the crew strings to. Stringing charts and sag tables are issued at initial condition and at the actual temperature on the day |
| Final, at maximum operating temperature | Sag after creep and after load-related permanent elongation, at the highest conductor temperature the line is rated for | Ground and crossing clearance — the governing case for most clearance checks, and the basis of the thermal rating |
| Final, at minimum temperature, no ice | The conductor at its shortest and tightest | Uplift at suspension structures, and maximum tension for structure and hardware loading in cold regions |
| At the governing ice and wind loading | Loaded condition under the applicable district or extreme case | Maximum tension, which sizes structures, foundations and hardware |
| Under wind, at reduced temperature | Conductor displaced horizontally | Blowout, insulator swing, right-of-way width and clearance to objects at the edge of the corridor |
| Everyday condition | The state the conductor spends most of its life in | Aeolian vibration exposure and fatigue over decades |
The difference between initial and final sag is not a detail. Conductors elongate permanently through metallurgical creep over years and through settlement under the first heavy load. A line strung to its final sag will end up sagging further than the design allows; a line strung to its initial sag arrives at the design condition years later. Getting the two confused at installation produces a line that is correct in the model and wrong on the ground.
7. Level Supports, and What Happens When They Are Not
The parabolic equation assumes the two supports are at the same elevation. Real alignments almost never are.
With an elevation difference between supports, the lowest point of the conductor moves away from mid-span toward the lower support, and in steep terrain it can move outside the span altogether — the conductor rises continuously from one support to the other, and there is no low point within the span at all. That condition produces uplift at the lower structure, which is a design check in its own right.
The sag figure itself also becomes ambiguous. Sag measured vertically from the straight line joining the two supports is a different number from sag measured below the lower support. Both are used, and a sag value quoted without saying which is being reported is an invitation to error.
The clearance consequence is the one that matters. Ground clearance is not measured at mid-span; it is measured wherever the conductor comes closest to the ground, which on inclined and undulating terrain is somewhere the hand calculation never considered. That is one of the two central reasons line design uses a three-dimensional terrain model rather than a spreadsheet.
8. One Span Is Not a Line
The second central reason is that spans are not independent.
Between two dead-end structures lies a tension section containing many spans, joined at suspension structures whose insulators swing freely. Because they swing, tension equalises along the whole section. Pull one span tighter and the insulators move until the tensions balance again. A calculation that treats a span in isolation, with its own assumed tension, is not describing how the section behaves.
The conventional way to handle this is the ruling span: a single equivalent span that represents the whole section, from which sag and tension for every individual span are then derived. It is a good approximation for uniform terrain with comparable span lengths, and it underlies most routine design.
It becomes unreliable where the assumption of free tension equalisation breaks down — widely varying span lengths, steeply inclined spans, large elevation differences, and short spans adjacent to long ones. And it cannot represent longitudinal load cases at all, because broken conductor, unbalanced ice and stringing conditions all involve unequal tension either side of a structure, which is precisely what the ruling span assumes away. Those cases require a finite element solution that models each span with the structures and insulators as flexible elements.
9. Tension Answers to Three Masters
Choosing the tension a line is strung at is a genuine optimisation, and the three constraints pull in different directions.
- Strength. Tension at the governing loading condition must stay within a defined fraction of the conductor’s rated breaking strength, and it must stay within what the structures, foundations and hardware were designed for. This sets an upper bound.
- Clearance. Higher tension means less sag, which means shorter structures or longer spans for the same clearance. This pushes tension up, because structures and foundations are the expensive part of a line.
- Vibration. Aeolian vibration causes fatigue at attachment points and splices over decades, and susceptibility rises with tension. The everyday tension limit — expressed as a fraction of rated strength, or directly as the catenary constant — is a fatigue control, not a strength requirement. This pushes tension down.
The third one is the constraint that gets forgotten, because its consequences appear in year twelve rather than at commissioning. A line strung tight enough to save a structure per kilometre, without damping designed for the resulting exposure, will show broken strands at suspension clamps long after everyone involved has moved on.
Note that the catenary constant from Section 3 is exactly the quantity used in that assessment. The algebra that produces sag also produces the parameter that governs fatigue life, which is a good reason to understand what the terms mean rather than treating the formula as a black box.
10. Units: Where the Errors Come From
The unit error in Version B is not a one-off. It is structural, and it comes from working across two measurement traditions.
- In North American practice, conductor weight is published in pounds per foot, tension in pounds, span in feet and sag in feet. The pound is a force, so the equation applies directly with no conversion. Nothing in the calculation reminds you that a conversion might be needed, because it never is.
- In metric practice, conductor weight is commonly published in kilograms per metre, which is a mass. It must be multiplied by gravitational acceleration to become a force per unit length before the equation applies. Skip that step and every result is too small by a factor of about ten.
- Mixed sources make it worse. A conductor catalogue in one system, a worked example in another, and a spreadsheet inherited from a third is how the error survives review — each individual step looks correct.
The defence is a sense check that takes seconds. Divide tension by weight per unit length to get the catenary constant, then divide span squared by eight times that constant. For ordinary transmission construction the catenary constant lands in the region of one to two thousand metres and sag-to-span sits at a few percent. A catenary constant of fifteen thousand metres, as Version B implies, is an immediate signal that something is wrong with the inputs rather than the arithmetic.
11. What the Software Actually Does
With the preceding sections in view, it becomes clear why line design is done in an integrated three-dimensional model rather than a spreadsheet. It is not because the sag equation is difficult. It is because the equation has to be solved everywhere, at every condition, against terrain, simultaneously.
| Capability | What it genuinely does | What to be careful about |
|---|---|---|
| Integrated three-dimensional model | Holds terrain, features, structures, wires and design criteria in one object so a change anywhere propagates everywhere and checks re-run continuously | The model is only as good as its weakest input. A datum error in the terrain produces a systematically wrong design that looks entirely normal |
| Sag-tension solution | Solves the change-of-state problem for every condition, using the conductor’s stress-strain characteristic, with initial and final states distinguished | The conductor data must be the manufacturer’s published physical and stress-strain properties, not a library entry of unknown provenance |
| Finite element analysis | Models spans individually with structures and insulators as flexible elements, which is what makes broken conductor, unbalanced ice and uplift cases solvable | Treating it as an optional refinement rather than a requirement for longitudinal cases is a common way to under-design dead-end and angle structures |
| Automated clearance checking | Evaluates clearance to ground, features, crossings and between conductors, in three dimensions, at whatever conditions the criteria specify | It checks what it is told to check, at the conditions it is given, against features the survey captured. All three are engineering decisions |
| Structural interaction | Passes actual loads to structural models and receives usage back, rather than checking against a capability envelope developed elsewhere | Envelopes are derived from specific load cases. Applying a family developed for different criteria produces numbers that look applicable and are not |
| Automated drafting and reporting | Generates plan and profile sheets, staking reports, material lists and stringing charts from the model of record | Automation propagates errors as efficiently as corrections, and a professionally presented wrong drawing set is harder to catch than a hand-drawn one |
12. Optimum Spotting: What It Can and Cannot Know
Automated structure spotting is the capability that most impresses people, and it deserves both the credit and the qualification.
What it does is real. Given an alignment, a terrain model, a catalogue of available structures with their capabilities and costs, a set of clearance and structural criteria, and a cost model covering structures, foundations and earthwork, the optimisation evaluates enormous numbers of combinations of structure position, type and height, and returns the arrangement with the lowest modelled cost that satisfies every constraint. No human process can search that space.
What it cannot do is know anything that was not entered.
- It optimises against the cost model it was given. If foundation costs do not vary with ground conditions in the model, it will place structures where the ground is difficult without penalty.
- It respects the criteria it was given. Wrong clearance requirement, wrong loading case, wrong conductor condition — the result is a fully optimised design against the wrong rules.
- It knows nothing about land. Parcel boundaries, unwilling landowners, easement cost and acquisition risk are frequently the dominant economics of a line and appear nowhere in the optimisation.
- It knows nothing about access or constructability. A structure at the optimal electrical location on a slope with no road is not optimal.
- It knows nothing about permitting, environmental constraints, cultural resources, or aviation obstruction assessment.
Used properly, the optimisation is the starting point for engineering judgment rather than a substitute for it. The right workflow is to run it, then walk the result against the constraints the model does not contain, then constrain the model where reality requires it and run again. An engineer who issues the first output has not designed a line — they have accepted a cost-minimisation over an incomplete constraint set.
13. Survey Import: Where the Model Is Won or Lost
Nothing downstream is better than the terrain surface, and most of the expensive errors on line projects are seeded here.
13.1 The Two Import Paths
Airborne lidar is the industry standard for transmission work. Points arrive classified, and the classification is what allows ground to be separated from vegetation, buildings, existing conductors and structures. Filtering large datasets before import, mapping classification codes to the design platform’s feature codes, and generating a triangulated surface from the ground returns is the standard sequence.
Conventional survey arrives as coordinate files, commonly ordered as point number, northing, easting, elevation and description. Column mapping at import, followed by selection of the points that define the alignment, is the equivalent sequence.
13.2 A Detail Worth Getting Right
Classification codes follow a published standard, and the assignments matter. Ground is class two. Conductors are class fourteen, shield wires class thirteen, transmission structures class fifteen, and structure-to-wire connectors class sixteen. Class ten is rail, not wire — a mapping error there puts railway returns into the conductor layer and conductor returns nowhere, which is exactly the kind of silent error that survives to the clearance report.
13.3 The Errors That Cost Real Money
- Datum and geoid. Confusing ellipsoidal with orthometric height, or applying the wrong geoid model, offsets the entire corridor vertically. Every clearance is then wrong by the same amount, consistently, with nothing looking anomalous.
- Projection and scale. Over a long route, a projection chosen for convenience introduces distance distortion that accumulates into span lengths and therefore tensions.
- Misclassification. Vegetation classed as ground raises the surface and hides clearance problems. Ground classed as vegetation does the reverse and produces phantom violations.
- Interpolation. Dense canopy, water and steep slopes produce sparse or absent ground returns, and the surface is interpolated across them. Interpolated ground under a critical span is a place for a check shot, not a place to trust the model.
- Missing features. Crossings, buildings and utilities that were never captured or coded do not exist as far as automated checking is concerned, and the clean clearance report will not mention them.
14. New Line Versus Upgrade
The two workflows share a platform and very little else.
| New line | Upgrade or reconductoring | |
|---|---|---|
| The question | Where should the line go, and what is the cheapest arrangement that satisfies the criteria? | What is actually out there, and how much more can it carry? |
| Survey emphasis | Broad corridor coverage to evaluate route alternatives, with ground surface as the priority | Tightly controlled, feature-coded capture of the existing line — conductor positions, structure locations, attachment heights and structure lean |
| The powerful capability | Automated structure spotting across the alignment against a cost model | Recovering the as-built condition by fitting catenaries to the captured conductor points, with the loading and temperature at capture known |
| Structures | Selected from a catalogue and positioned by optimisation | Modelled as they exist, then checked against revised loading. Capacity is the constraint rather than cost |
| What governs | Span length, right-of-way width, foundation conditions and structure cost | Clearance at the higher operating temperature, almost always. Raising the rating raises the sag |
The as-built recovery capability deserves emphasis because it is undersold in most descriptions. Lidar of an energised line captures the conductors in their real position at a known temperature and loading, which allows the actual catenary and tension state to be recovered. That is a far better starting point than the original design drawings, which record what was intended rather than what was built, and which do not reflect decades of maintenance, replacement and structure settlement.
One terminology note for upgrade work: in this context, the constraint is a clearance-limited location rather than a thermal one. The conductor is capable of running hotter; the ground clearance at the worst location is what caps the rating. Calling those locations thermal constraints confuses the diagnosis, and the mitigation — re-tension, raise a structure, shorten a span, or reconductor — addresses clearance, not temperature.
15. Reading the Source Material Correctly
Check the units before checking the arithmetic
Both circulating calculations divide correctly. Only one describes a real conductor. Divide tension by weight per unit length, look at the catenary constant, and ask whether a span behaves that way. It takes seconds and it catches the error the arithmetic cannot.
Tension is not an input
The formula takes horizontal tension as given. Design does not. Tension is solved for at every condition from a limit set at one design condition, using the conductor’s stress-strain properties. A calculation that needs only weight and tension is evaluating a state that somebody else already solved.
The note about temperature, wind, ice and creep is right and understated
Both posts end by saying that real design should account for those things. That is correct, and it understates the position: those factors do not refine the answer, they determine it. Sag at maximum operating temperature after creep is a different number from sag at stringing temperature when new, and only one of them is the clearance case.
Software descriptions use marketing language for engineering functions
Terms such as digital twin and real-time physics engine describe genuine capability in promotional register. The underlying functions — an integrated three-dimensional model, a change-of-state sag-tension solution, a finite element structural interaction, and automated clearance checking against terrain — are what an engineer should evaluate and specify.
Optimisation is bounded by its inputs
Automated spotting finds the lowest modelled cost against the criteria and cost profile it was given. Land, access, constructability, permitting and environmental constraints sit outside the model, and on most projects at least one of them governs.
Classification codes are not interchangeable
Class ten is rail. Conductors are class fourteen. A mapping error there is invisible in the workflow and visible only in a clearance result that was computed against the wrong points.
16. Keentel Transmission Line Design Services
Transmission line design is core practice at Keentel Engineering. We work across the full delivery chain — survey through detailed design and construction support — and carry the line model forward into the power system studies that depend on it.
16.1 Modelling and Analysis
- Three-dimensional line model development including terrain, features, crossings and existing utilities, with independent verification of datum, geoid, projection and point classification before the surface is used.
- Sag-tension analysis by ruling span and by finite element methods, using manufacturer stress-strain data, with initial and final states distinguished and every governing condition evaluated.
- Longitudinal and security case analysis — broken conductor, broken shield wire, unbalanced ice — and uplift assessment, which the ruling span method cannot address.
- Clearance analysis in three dimensions against ground, features, crossings, other circuits and between phases, at the governing conditions including blowout and insulator swing.
- Structure spotting and optimisation, run against a cost model that reflects the actual project and then reconciled against the constraints the model does not contain.
16.2 Structures, Foundations, and Electrical Design
- Structure family development and capability envelope derivation with the load case basis documented, and analytical modelling of lattice, tubular pole, H-frame and guyed structures under actual loads.
- Insulator assembly selection and swing analysis, arm geometry, and right-of-way width determination from blowout and clearance.
- Foundation reactions issued by load case with definitions attached, foundation type evaluation, and geotechnical coordination scoped early enough to influence spotting.
- Conductor selection and thermal rating analysis including high-temperature low-sag conductors, insulation coordination, shielding and lightning performance, corona and field effects, and grounding and footing resistance.
- Vibration and galloping assessment, damping and spacer design, and everyday tension selection as a fatigue control.
16.3 Uprating and As-Built Assessment
- As-built model development from lidar capture of energised lines, with the actual catenary and tension state recovered rather than assumed from original drawings.
- Uprating and reconductoring studies including identification of the clearance-limiting locations, option comparison across re-tensioning, structure modification, span shortening and reconductoring, and structural capacity verification under revised loading.
- Facility rating determination traced to the clearance-limiting analysis, and vegetation clearance basis derived from the model.
16.4 Deliverables, Studies, and Owner’s Engineer Support
- Plan and profile sets, staking reports, bills of material and cost estimates from the model of record; stringing charts and sag tables issued at the correct condition, with initial and final states clearly distinguished.
- Line constants calculation — sequence impedances, susceptances and zero-sequence mutual coupling — taken directly from the designed geometry, and the short-circuit, coordination, relay setting, stability and transient studies that use them.
- Design review of third-party line design packages, QA/QC of models and deliverables, and independent verification where a design has been produced elsewhere.
Keentel Engineering holds a Florida Certificate of Authorization and maintains offices in Tampa, Austin, Sacramento, and Baltimore, supporting projects across the interconnections.
17. References and Further Reading
The following are referenced by subject in the body of this document. The edition adopted by the authority having jurisdiction governs code requirements, and the current published edition of each standard governs its own content.
Code and Loading
- ANSI C2, National Electrical Safety Code — clearance requirements, district and extreme loading cases, overload factors and grades of construction — Institute of Electrical and Electronics Engineers
https://standards.ieee.org/products-programs/nesc/ - ASCE Manual of Practice No. 74, Guidelines for Electrical Transmission Line Structural Loading — American Society of Civil Engineers
https://www.asce.org/ - IEC 60826, Design criteria of overhead transmission lines, for projects following the international framework — International Electrotechnical Commission
https://webstore.iec.ch/
Conductor, Sag-Tension, and Vibration
- IEEE Std 738, Standard for Calculating the Current-Temperature Relationship of Bare Overhead Conductors — the thermal rating basis that sets the maximum operating temperature — IEEE Standards Association
https://standards.ieee.org/ - Aluminum Association conductor data and stress-strain characteristics, and the manufacturer’s published physical, thermal and stress-strain properties for the specific conductor selected — The Aluminum Association
https://www.aluminum.org/ - IEEE Std 524, Guide to the Installation of Overhead Transmission Line Conductors, covering stringing practice, sag tables and construction loading — IEEE Standards Association
https://standards.ieee.org/ - CIGRE technical brochures on aeolian vibration, conductor self-damping and fatigue endurance, on galloping, and on the application of high-temperature low-sag conductors — CIGRE
https://www.cigre.org/
Survey, Structures, and Ratings
- ASPRS LAS specification and point classification definitions, and the ASPRS Positional Accuracy Standards for Digital Geospatial Data — American Society for Photogrammetry and Remote Sensing
https://www.asprs.org/ - ASCE 10 for latticed steel transmission structures, ASCE 48 for steel transmission pole structures, ASCE Manual of Practice No. 91 for guyed structures, and IEEE Std 691 for transmission structure foundation design and testing — ASCE and IEEE Standards Association
https://www.asce.org/ - NERC Reliability Standards — including the facility ratings and vegetation management standards whose inputs originate in the line design model — North American Electric Reliability Corporation
https://www.nerc.com/pa/Stand/Pages/ReliabilityStandards.aspx
17. Frequently Asked Questions
Q1. What is the parabolic sag formula?
Mid-span sag equals weight per unit length multiplied by span squared, divided by eight times the horizontal tension. It is an approximation to the true catenary, valid when sag is small relative to span.
Q2. Why did two versions of the same calculation give answers ten times apart?
A unit. One treated 1.2 as kilograms per metre and multiplied by gravitational acceleration to get about 11.77 newtons per metre. The other used 1.2 newtons per metre directly. Both then divided correctly. Only the first describes a real conductor.
Q3. How would I have caught that?
With a sense check. Divide tension by weight per unit length to get the catenary constant. For ordinary transmission construction it lands around one to two thousand metres and sag sits at a few percent of span. A catenary constant of fifteen thousand metres says the inputs are wrong, not the arithmetic.
Q4. Is the weight term a mass or a force?
A force per unit length. In metric working, a catalogue weight in kilograms per metre must be multiplied by gravitational acceleration first. In North American practice, weight is published in pounds per foot and tension in pounds, both already forces, so no conversion exists — which is exactly why the error appears when sources from different markets are mixed.
Q5. Is the tension in the formula the tension in the conductor?
It is the horizontal component, which is constant along the span. Tension at the support is higher because the conductor is inclined there. Strength checks are made against the support value, so using the horizontal one where the support value is required understates the loading.
Q6. What is the catenary constant and why does it matter?
Horizontal tension divided by weight per unit length. It has units of length and it characterises the span: sag equals span squared divided by eight times that constant. It is also used directly as a vibration control parameter, so it is a design quantity rather than just an intermediate step.
Q7. How accurate is the parabola compared with the true catenary?
Very good at ordinary sag-to-span ratios. For the corrected worked example, close to three percent sag-to-span, the difference is about a tenth of a percent. It grows with the ratio — around one percent at ten percent sag-to-span, approaching three percent at fifteen — and it always understates sag.
Q8. When should I use the catenary instead?
Long crossing spans, lightly tensioned construction, and any case where sag approaches a tenth of the span. Also never rely on the parabola to justify a marginal clearance, because its error works against you. Design software uses the catenary throughout regardless.
Q9. What is the biggest conceptual error in the circulating posts?
Treating horizontal tension as an input. In design it is the unknown. The designer sets a tension limit at one design condition, and the change-of-state calculation solves for tension at every other condition using the conductor’s stress-strain properties. Sag is then computed from the tension that calculation produced.
Q10. Why do conductor properties matter if the formula only needs weight and tension?
Because the formula evaluates a state somebody already solved. Solving for that state requires cross-sectional area, elastic modulus, thermal expansion coefficient and the stress-strain characteristic. Without them you cannot determine tension at any condition other than the one you were handed.
Q11. What is the difference between initial and final sag?
Initial is immediately after stringing. Final is after permanent elongation from metallurgical creep over years and from settlement under the first heavy load. A line strung to its final sag will end up sagging beyond the design; a line strung to its initial sag reaches the design condition years later.
Q12. Which condition governs ground clearance?
Normally final sag at the maximum operating temperature. That is the hottest, most elongated, most sagging state the line is rated for. Checking clearance at an everyday temperature produces a design that is compliant on paper and non-compliant on a hot afternoon at full load.
Q13. What does the formula assume about the supports?
That they are at the same elevation. Real alignments rarely are. With an elevation difference the low point moves toward the lower support and in steep terrain can fall outside the span entirely, which produces uplift at the lower structure.
Q14. Where is ground clearance actually measured?
Wherever the conductor comes closest to the ground, which on undulating terrain is not mid-span. That is one of the two main reasons line design uses a three-dimensional terrain model rather than a spreadsheet.
Q15. What is the other reason?
Spans are not independent. Between dead-ends, insulators swing and tension equalises across the whole tension section, so a span analysed in isolation with its own assumed tension does not describe how the section behaves.
Q16. What is the ruling span?
A single equivalent span representing a whole tension section, from which sag and tension for each individual span are derived. It works well for uniform terrain with comparable spans and underlies most routine design.
Q17. When does the ruling span fail?
Widely varying span lengths, steeply inclined spans, large elevation differences, and short spans next to long ones. It also cannot represent longitudinal cases at all — broken conductor, unbalanced ice, stringing — because those involve unequal tension either side, which the method assumes away. Those need a finite element solution.
Q18. How is stringing tension chosen?
By balancing three constraints. Strength sets an upper bound at the governing loading condition. Clearance pushes tension up, because sag drives structure height and span length. Vibration pushes tension down, because fatigue susceptibility rises with tension. The third is the one that gets forgotten, because its consequences appear in year twelve.
Q19. What does automated structure spotting actually do?
Given an alignment, terrain, a structure catalogue with capabilities and costs, design criteria, and a cost model, it searches an enormous number of combinations of position, type and height and returns the lowest modelled cost that satisfies every constraint. No manual process can search that space.
Q20. What can it not know?
Anything not entered. Land and easement cost, unwilling landowners, access and constructability, permitting, environmental and cultural constraints, and aviation obstruction. On most projects at least one of those governs, so the optimisation output is a starting point for judgment rather than a design.
Q21. What is the most common survey error?
Datum and geoid confusion — ellipsoidal versus orthometric height, or the wrong geoid model. It offsets the whole corridor vertically, so every clearance is wrong by the same amount, consistently, and nothing looks anomalous. Misclassification and interpolated ground under critical spans follow closely behind.
Q22. Are lidar classification codes standardised?
Yes, and the assignments matter. Ground is class two, shield wires thirteen, conductors fourteen, transmission structures fifteen, and structure connectors sixteen. Class ten is rail, not wire. Mapping that incorrectly puts railway returns in the conductor layer and is invisible until the clearance result is wrong.
Q23. What is different about an upgrade workflow?
The question. New line design asks where the line should go and what the cheapest compliant arrangement is. Upgrade asks what is actually out there and how much more it can carry. The powerful capability shifts from optimisation to recovering the as-built condition from captured conductor positions.
Q24. What usually limits an uprating?
Clearance, almost always. Raising the operating temperature increases sag, and the ground clearance at the worst location caps the rating. Calling those locations thermal constraints confuses the diagnosis — the conductor can run hotter, the ground is where it stops.
Q25. If I take one thing from this, what should it be?
That a sag figure without four qualifiers is not a design quantity. Which condition, at what tension, in what state of permanent elongation, and over what tension section. The equation itself is one line of algebra that anyone can get right, and getting it right proves nothing about whether the line is safe.
Notice and Disclaimer
This document is original technical content prepared by Keentel Engineering LLC for general professional information. It is not project-specific engineering advice and does not constitute a design, a study, or a calculation for any line. Sag, tension, clearance and structure design must be established by project-specific analysis using verified survey data, the manufacturer’s published conductor properties, and the code edition and utility standards applicable to the project.
Worked figures in this document are calculated from values published in third-party material for the purpose of demonstrating method and identifying an error in that material. They are illustrative and are not design values for any conductor, span or installation. Representative ranges quoted for catenary constants, sag-to-span ratios and approximation errors are general engineering discussion and vary with conductor, terrain, loading and design practice.
Software capabilities described here are discussed generically. Software platforms referred to are the products of their respective owners, and all product names and trademarks are the property of those owners. Keentel Engineering LLC is an independent engineering consultancy and is not affiliated with, endorsed by, sponsored by, or a partner or reseller of any software vendor, and no such relationship is implied. Capability or performance claims made in third-party promotional material are those of the vendor and are not adopted or endorsed here.
Reference to any standard, code, industry organisation, regulator, or equipment category in this document does not imply affiliation with, endorsement by, or sponsorship from any such organisation.

About the Author:
Sandip "Sonny" R. Patel, P.E.
IEEE Senior Member · Founder & CEO, Keentel Engineering
In 1995, Sonny Patel earned his Electrical Engineering degree from the University of Illinois. But degrees don't build legacies — action does.
For three decades, he has worked the power industry from every side of the table: 16 years as a utility engineer at Exelon/Commonwealth Edison; generation leadership across hydroelectric, industrial steam turbine, and a 9 GW renewable fleet; NERC Regional Entity Senior Compliance Engineer and Audit Team Lead, auditing some of the nation's largest utilities; and testing and commissioning lead on equipment up to 765 kV — the very top of the North American grid.Utility. Generator. Regulator. Consultant. Few engineers have seen all four seats. Fewer still have sat in them.
His experience spans nuclear, hydro, conventional generation, renewables, oil and gas, mining — and today's data centers, where he is authoring a three-book series on data center design. He is a Licensed Professional Engineer in six states and a Licensed Electrical Contractor in Florida (Unlimited EC) — he doesn't just design the work; he's qualified to stand behind its execution.Today, as Founder and CEO of Keentel Engineering, Sonny leads a nationwide team of engineers delivering substation design, power system studies, NERC compliance, and commissioning — done right, coast to coast.Three decades. Every side of the table. One standard: accountable engineering.
Services

Let's Discuss Your Project
Let's book a call to discuss your electrical engineering project that we can help you with.
About the Author:
Sandip "Sonny" R. Patel, P.E.
IEEE Senior Member · Founder & CEO, Keentel Engineering
In 1995, Sonny Patel earned his Electrical Engineering degree from the University of Illinois. But degrees don't build legacies — action does.
For three decades, he has worked the power industry from every side of the table: 16 years as a utility engineer at Exelon/Commonwealth Edison; generation leadership across hydroelectric, industrial steam turbine, and a 9 GW renewable fleet; NERC Regional Entity Senior Compliance Engineer and Audit Team Lead, auditing some of the nation's largest utilities; and testing and commissioning lead on equipment up to 765 kV — the very top of the North American grid.
Utility. Generator. Regulator. Consultant. Few engineers have seen all four seats. Fewer still have sat in them.
His experience spans nuclear, hydro, conventional generation, renewables, oil and gas, mining — and today's data centers, where he is authoring a three-book series on data center design. He is a Licensed Professional Engineer in six states and a Licensed Electrical Contractor in Florida (Unlimited EC) — he doesn't just design the work; he's qualified to stand behind its execution.
Today, as Founder and CEO of Keentel Engineering, Sonny leads a nationwide team of engineers delivering substation design, power system studies, NERC compliance, and commissioning — done right, coast to coast.Three decades. Every side of the table. One standard: accountable engineering.
Leave a Comment
Thank you for contacting us.
We will get back to you as soon as possible.
We will get back to you as soon as possible.
Oops, there was an error sending your message.
Please try again later.
Please try again later.
Related Posts
By SANDIP R PATEL
•
October 13, 2026
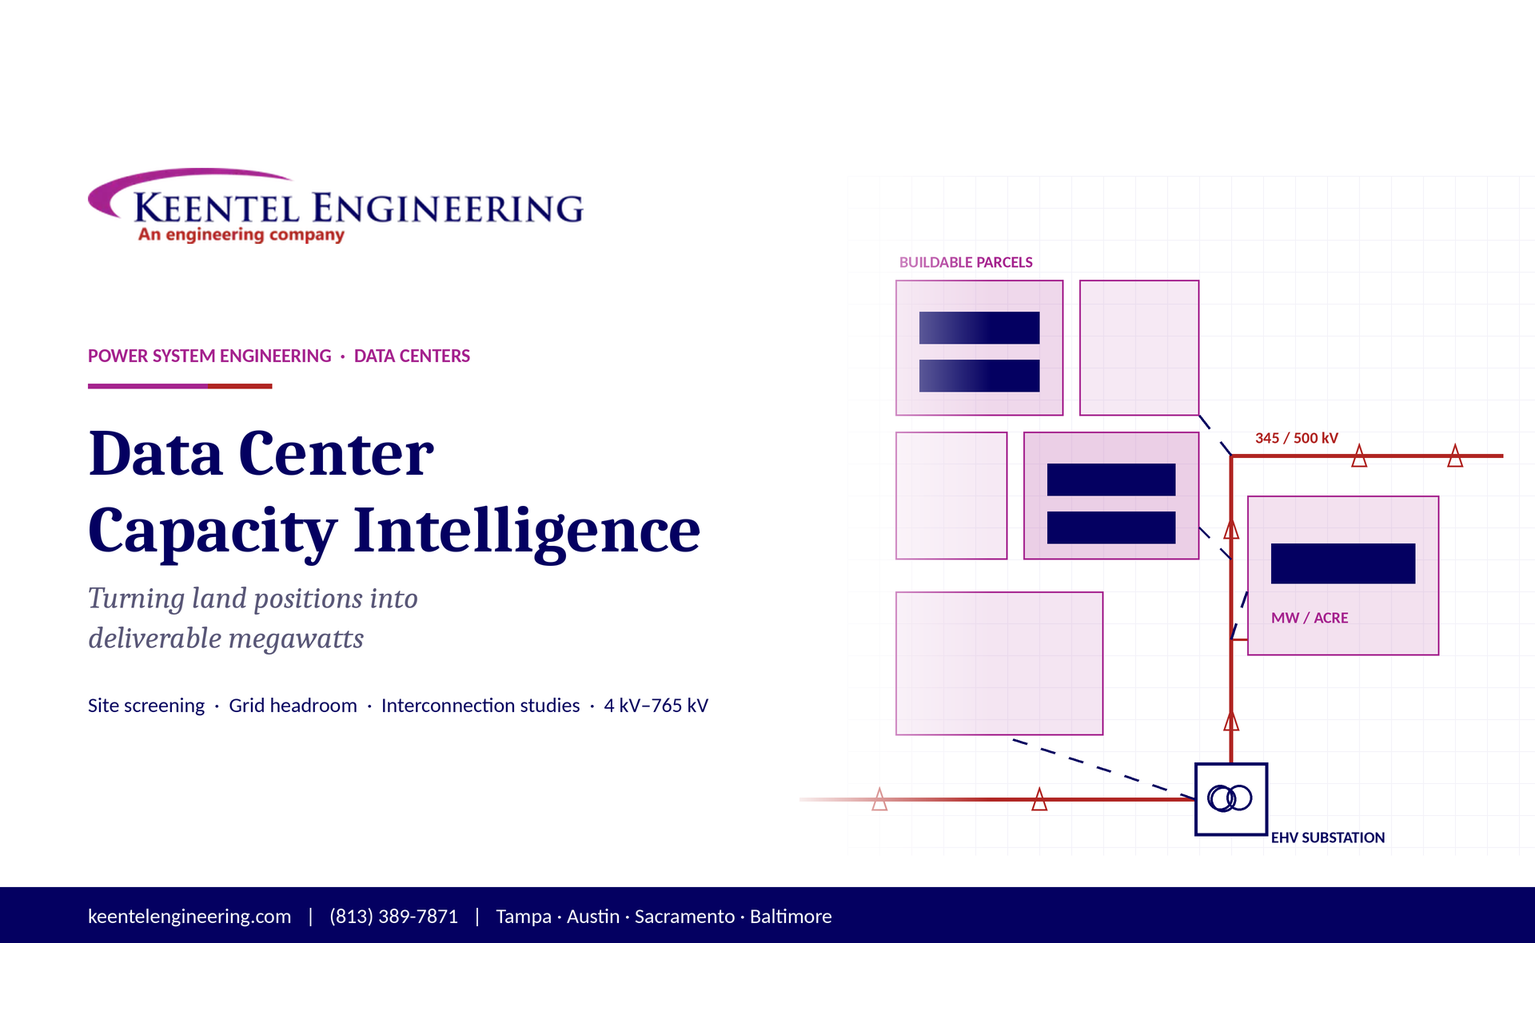
Plan data center capacity with land screening, MW-per-acre estimates, grid power availability and interconnection feasibility studies from Keentel Engineering.
By SANDIP R PATEL
•
October 11, 2026
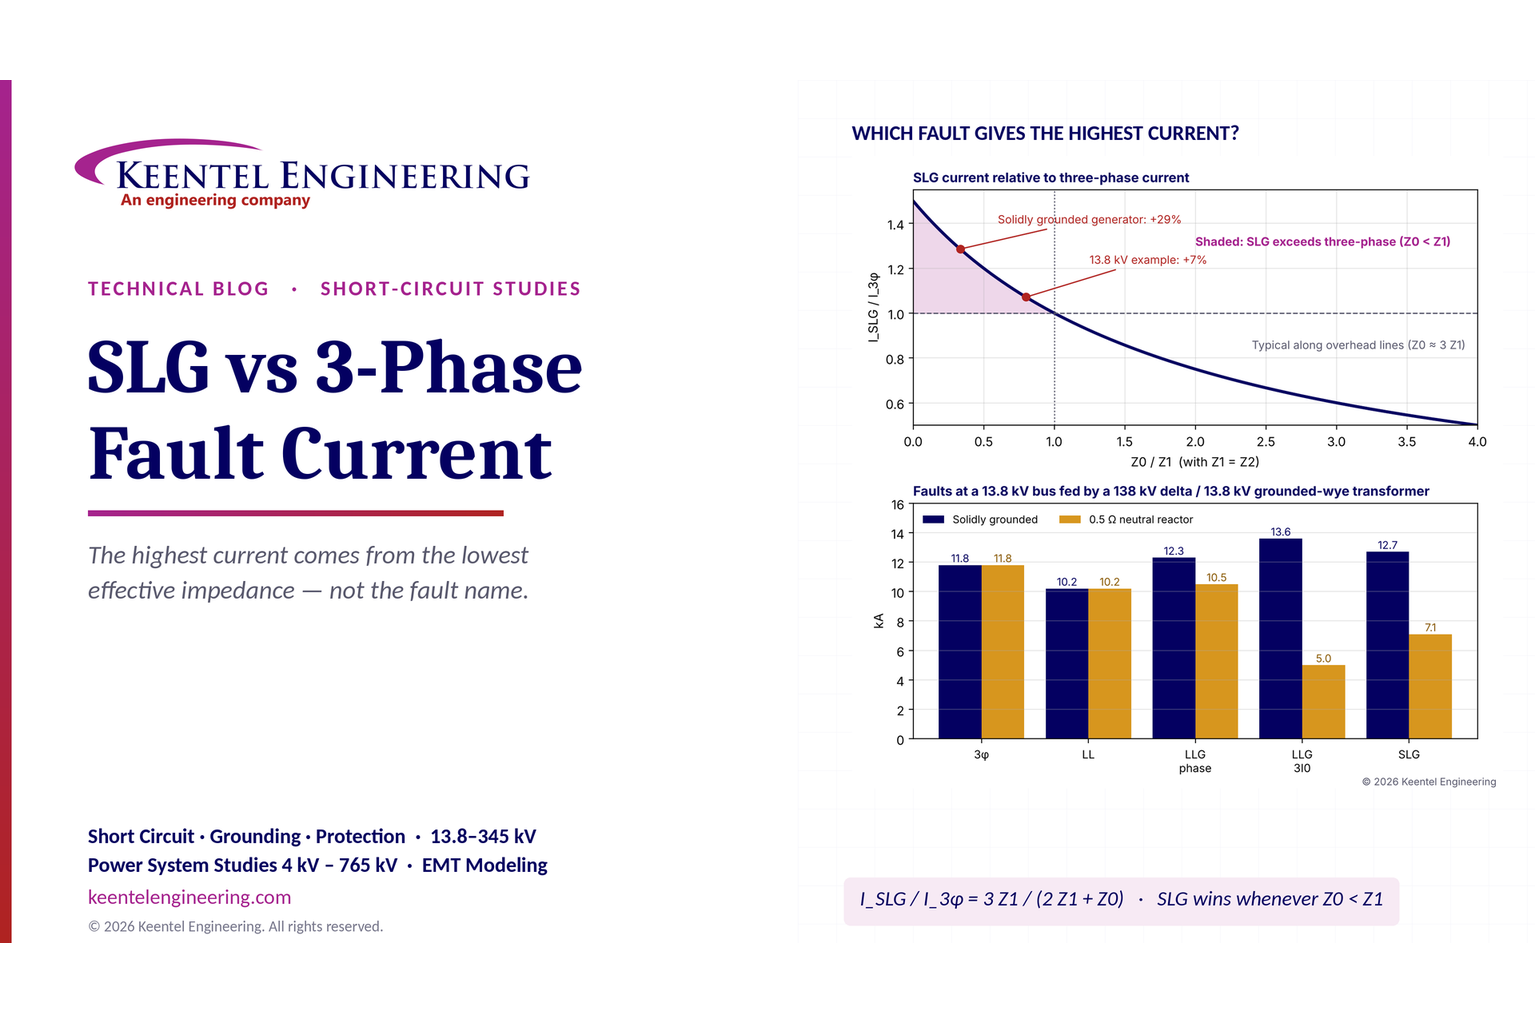
Learn which fault produces the highest current at a bus, why SLG faults can exceed three-phase faults, and how symmetrical components determine fault duty.
By SANDIP R PATEL
•
October 11, 2026
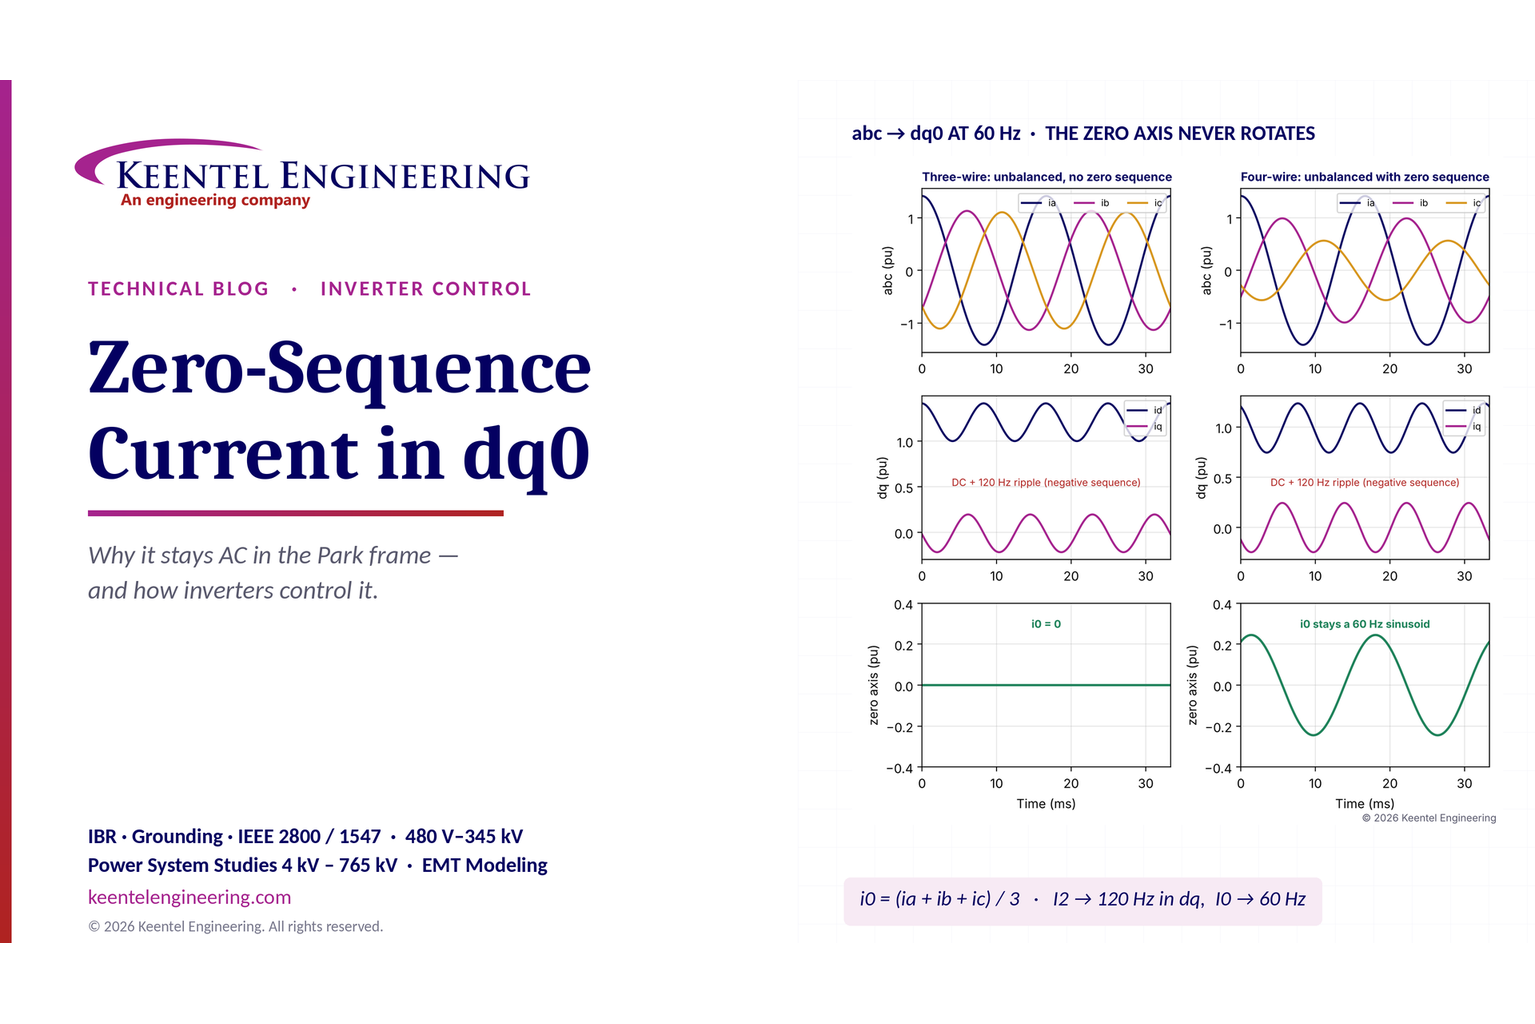
Learn why zero-sequence current pulsates in the dq0 frame, how Park's transformation works, and how inverter controls handle unbalance and ground faults.
By SANDIP R PATEL
•
October 11, 2026
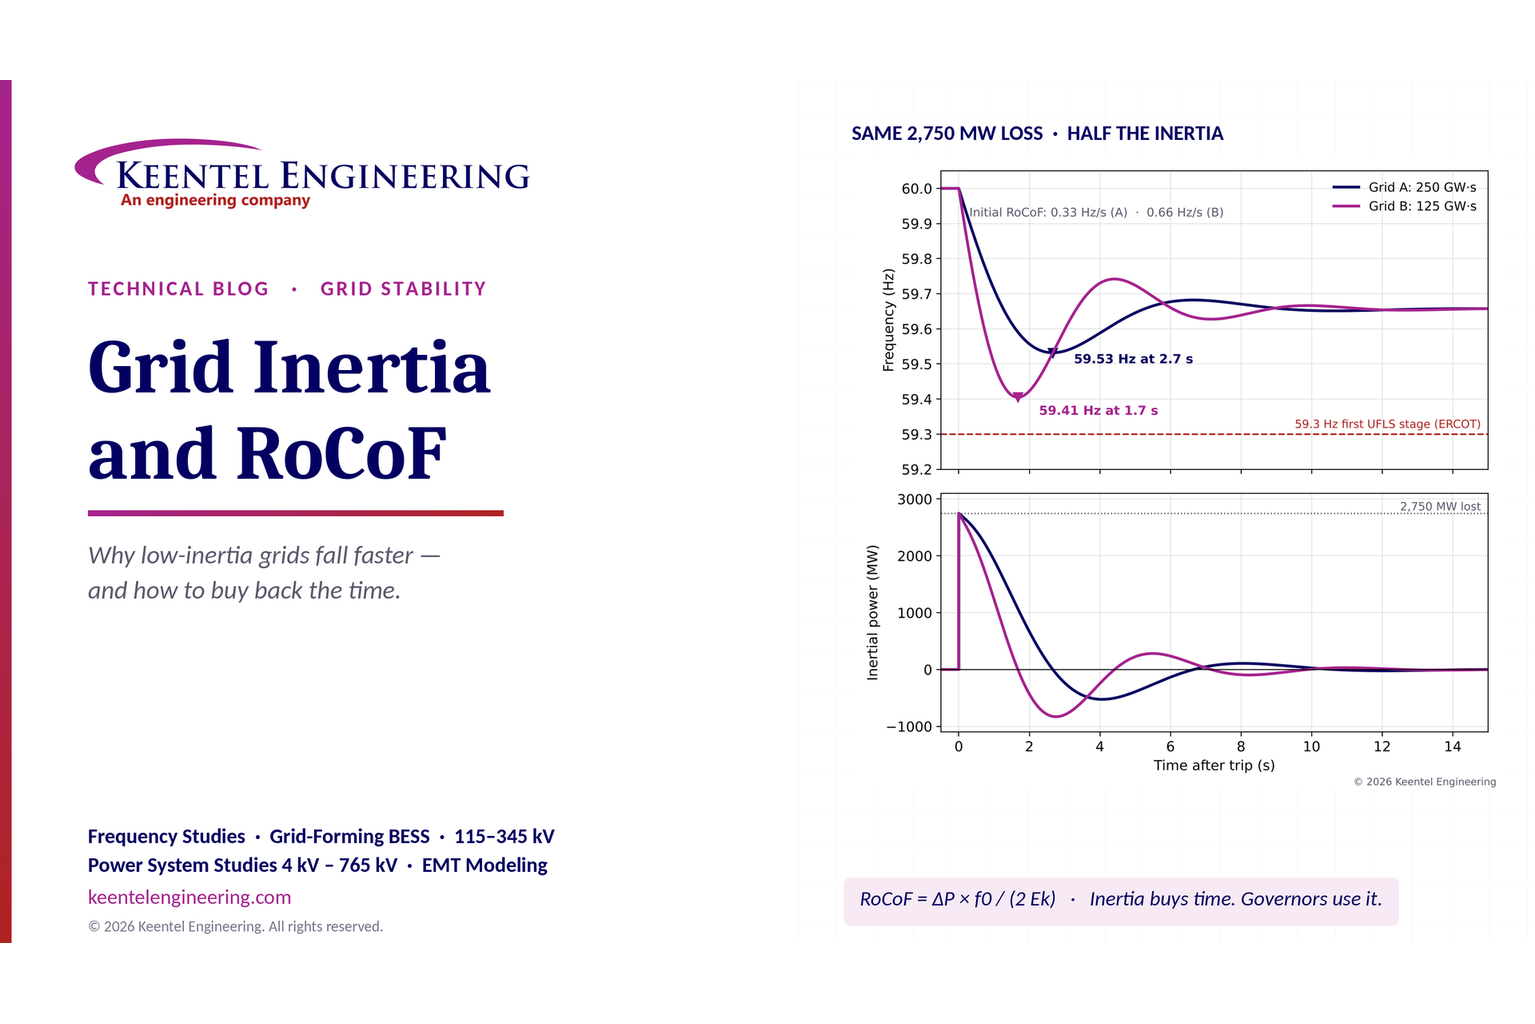
Explore grid inertia, RoCoF and frequency response, with swing equation calculations, frequency nadir analysis and US power system simulation examples.
By SANDIP R PATEL
•
October 11, 2026
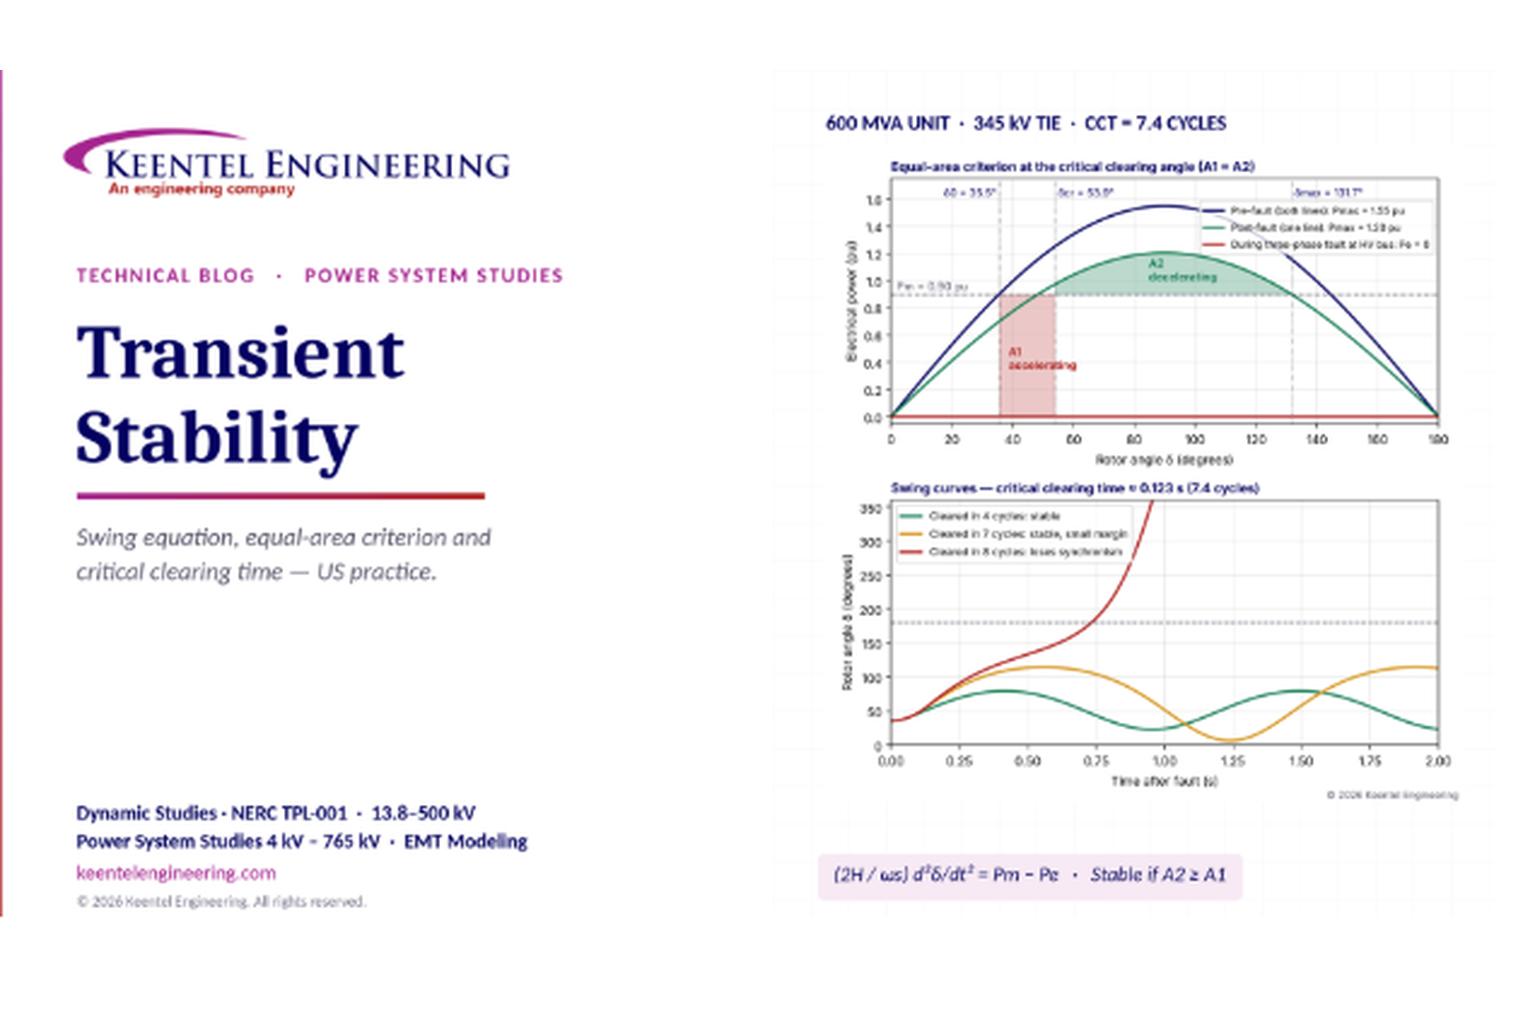
Learn transient stability analysis, swing equation, equal-area criterion and critical clearing time with a 345 kV worked example and NERC TPL-001 guidance.
By SANDIP R PATEL
•
October 11, 2026
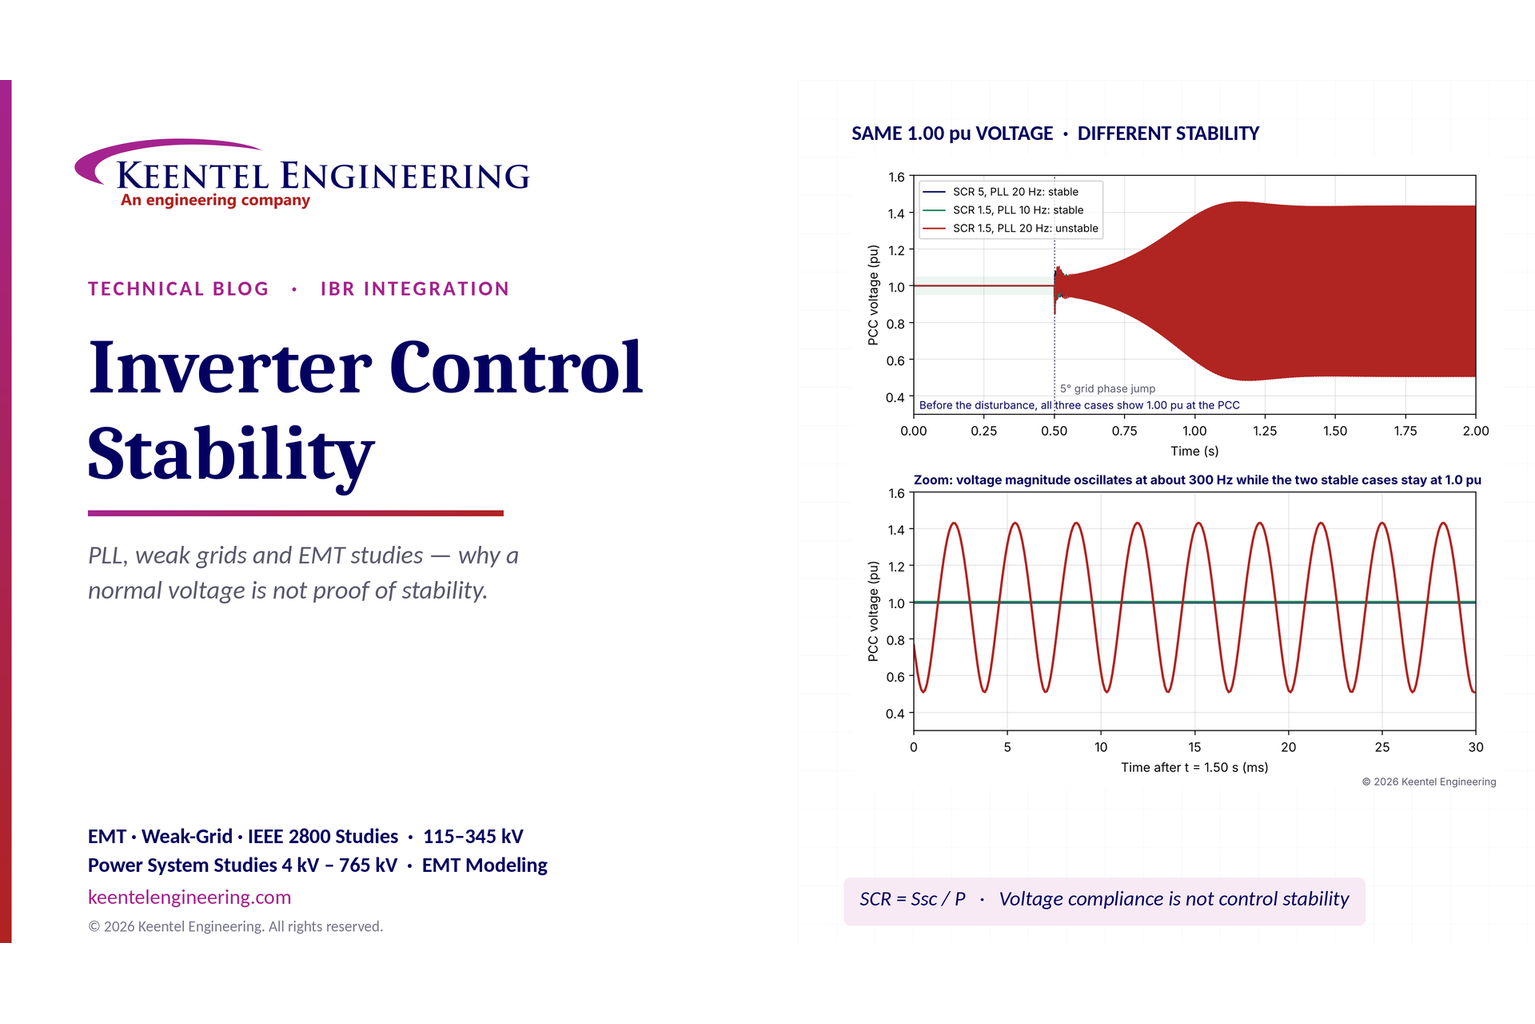
Learn why inverter controls become unstable in weak grids, how PLL bandwidth and SCR affect stability, and how PSCAD EMT studies identify and mitigate oscillations.
By SANDIP R PATEL
•
October 11, 2026
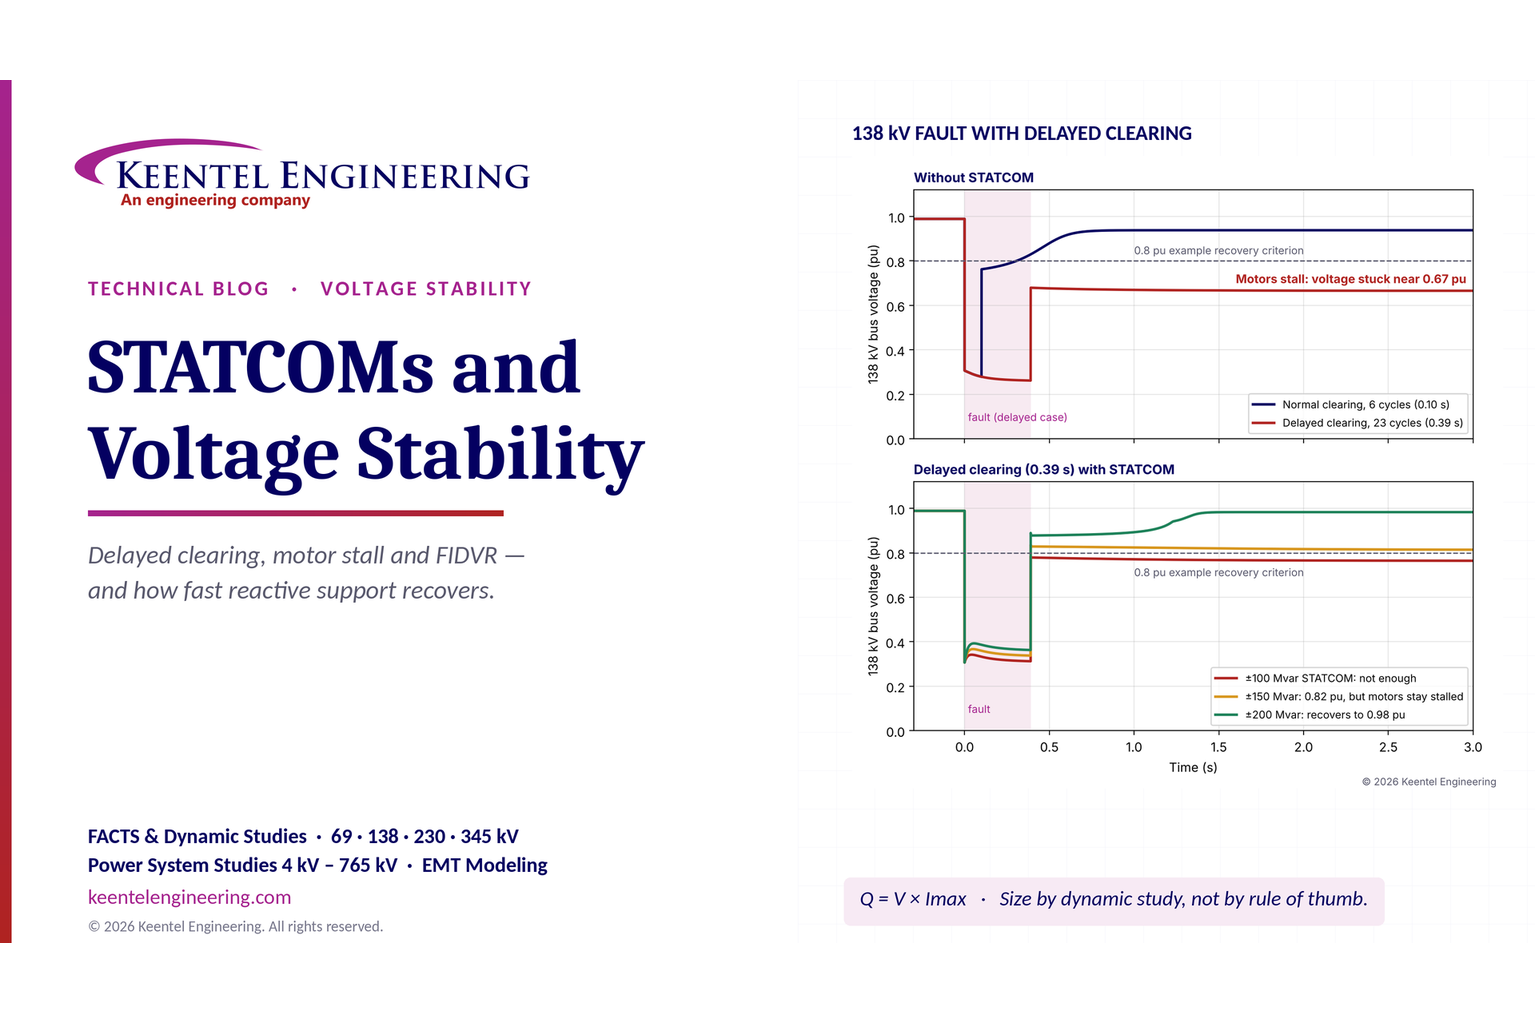
Learn how STATCOMs improve voltage stability and prevent FIDVR. Explore reactive power sizing, delayed fault clearing, NERC criteria and 138 kV simulation results.
By SANDIP R PATEL
•
October 10, 2026
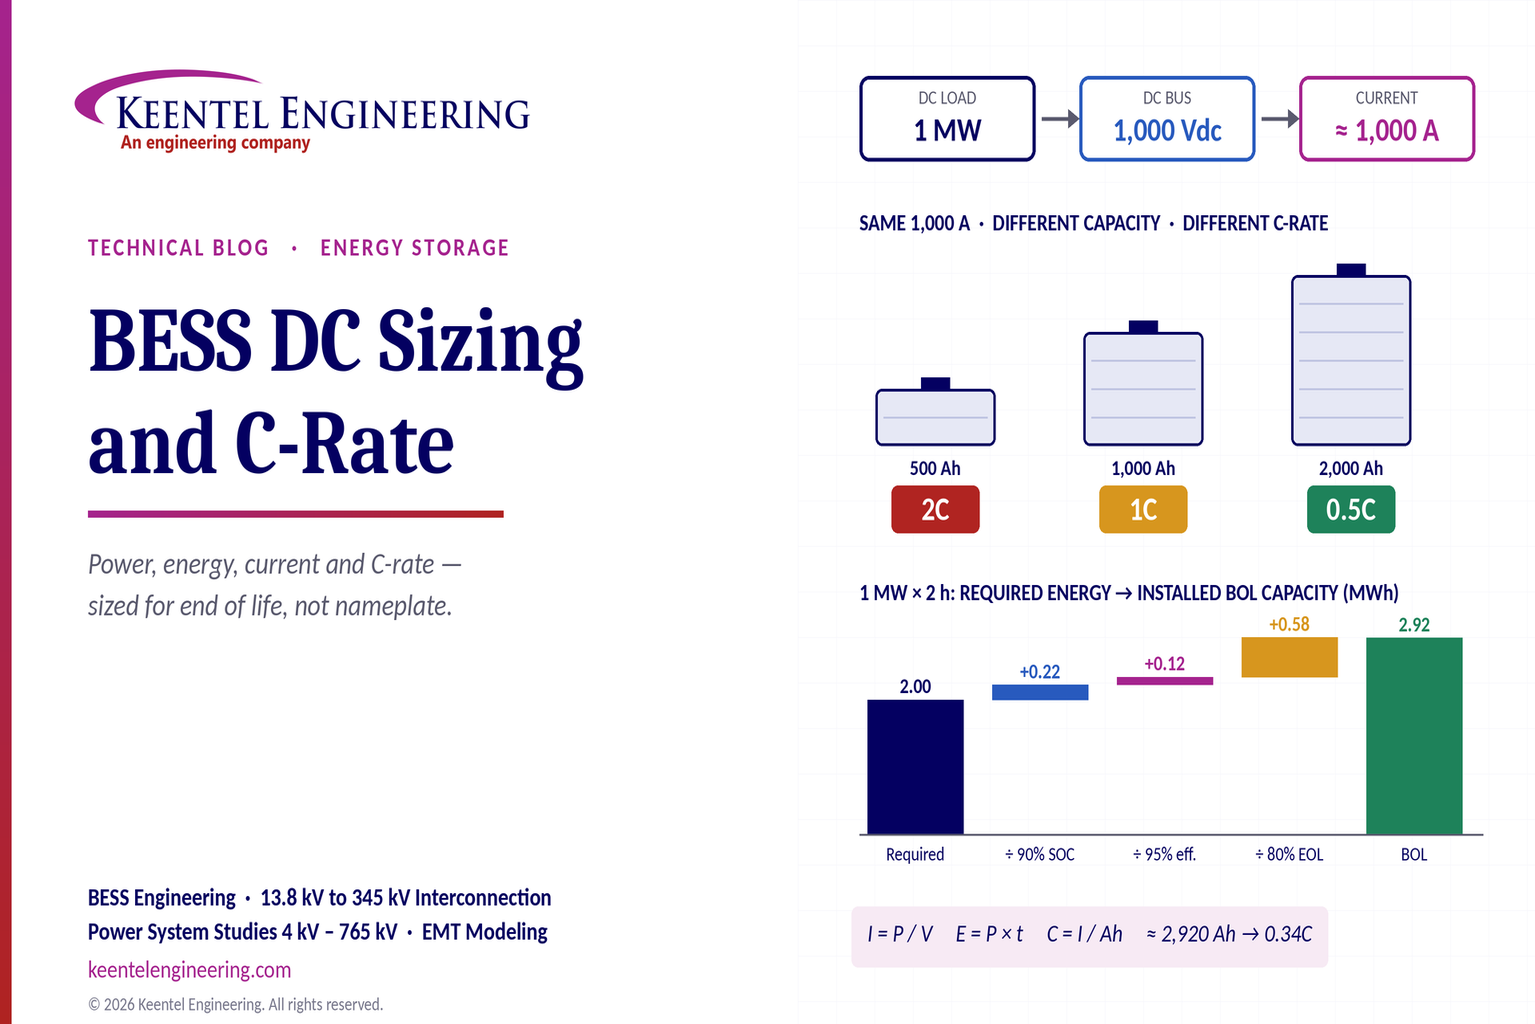
Learn BESS DC sizing with power, energy, current and C-rate calculations, battery losses, degradation and a 100 MW/400 MWh utility-scale example.
By SANDIP R PATEL
•
October 10, 2026
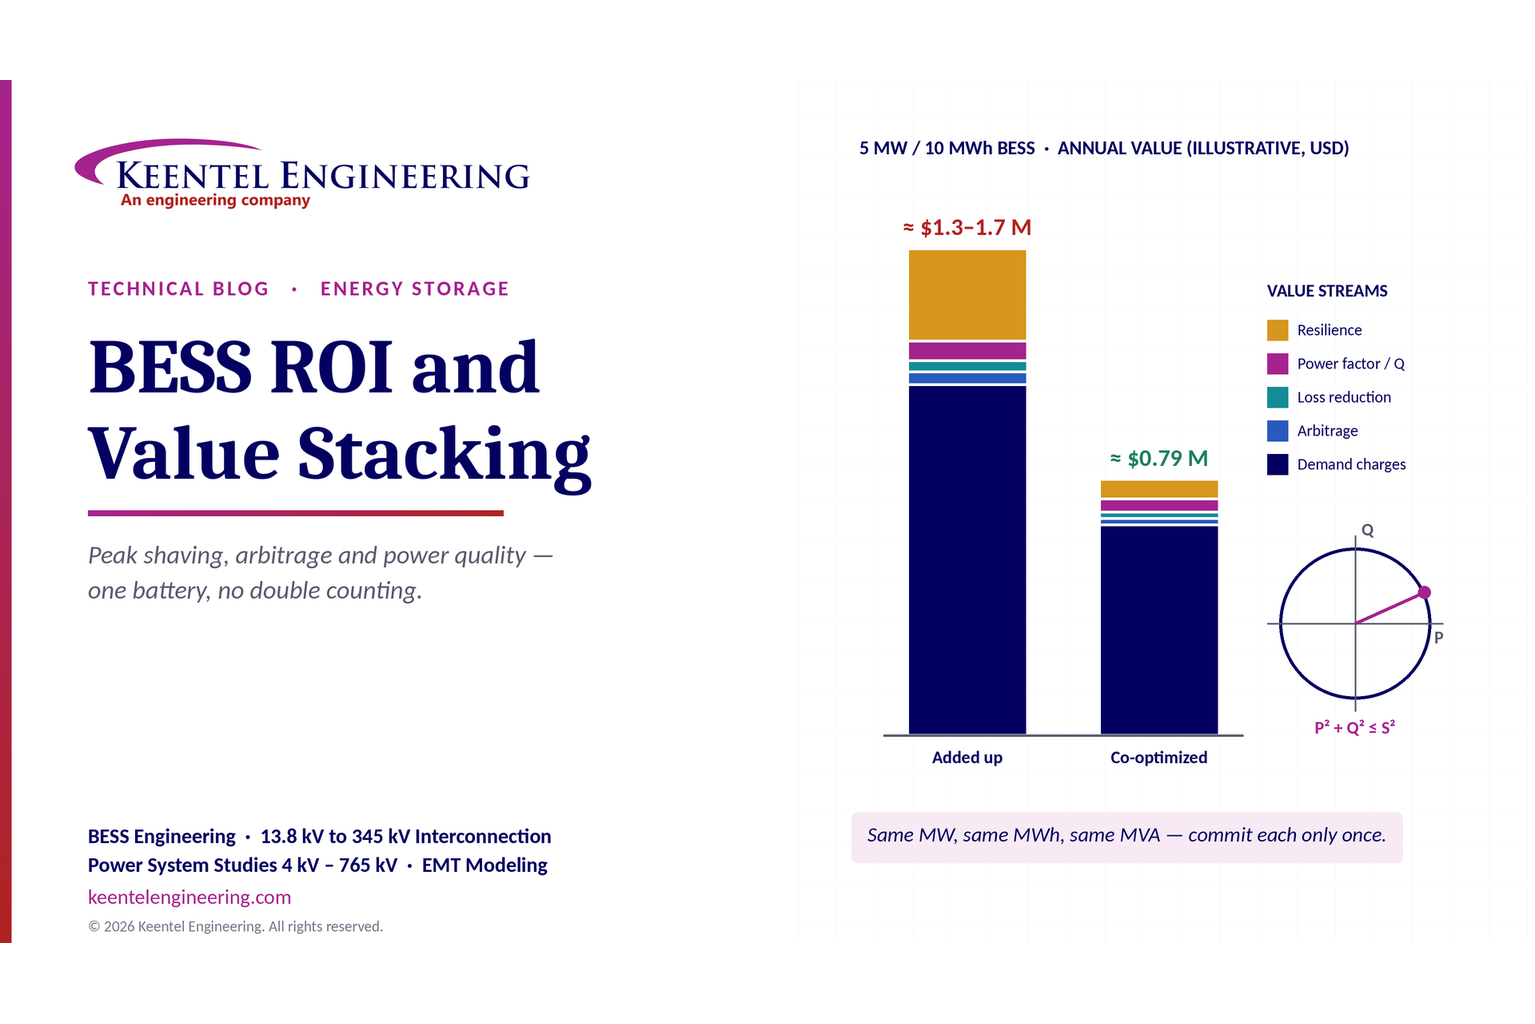
Learn how BESS ROI is calculated using peak shaving, energy arbitrage, power quality and battery storage economics, with a practical 5 MW/10 MWh example.





