A Coordinated Electric System Interconnection Review—the utility’s deep-dive on technical and cost impacts of your project.

Challenge: Frequent false tripping using conventional electromechanical relays
Solution: SEL-487E integration with multi-terminal differential protection and dynamic inrush restraint
Result: 90% reduction in false trips, saving over $250,000 in downtime

The three operating regions you have to design to

Device Output vs voltage Response Best suited to Main limitations
Mechanically switched capacitor or reactor Proportional to voltage squared Seconds; discrete steps; limited switching operations per day Steady-state reactive supply, voltage profile, loss reduction No dynamic capability; step voltage change on switching; capability collapses when most needed
Static var compensator Capacitive branches proportional to voltage squared A few cycles; continuously controllable Continuous control where cost matters and deep voltage support is not the driver Square-law capability loss; harmonic filters are part of the plant and interact with the network
STATCOM Approximately proportional to voltage — constant current capability One to two cycles closed loop; converter response faster still Voltage stability margin, weak interconnections, fast disturbance recovery, flicker and unbalance compensation Higher capital cost; converter losses; adds a converter and its control dynamics to the network
Synchronous condenser Governed by machine capability and excitation Excitation response in the hundreds of milliseconds; inherent inertial response instantaneous System strength and inertia, short-circuit contribution, black start support Rotating plant with maintenance and losses; slower controlled response than a converter
STATCOM with energy storage Reactive as a STATCOM, plus real power within the storage rating As STATCOM for reactive; real power limited by storage Where a real power deficiency is part of the problem Cost and complexity of the storage; different failure and maintenance profile
Service area What we do for SST campuses Typical deliverables
Grid interconnection Site screening, large-load applications, independent studies, utility and RTO coordination in ERCOT, NYISO, PJM and other markets Screening reports, application data packages, load flow, contingency and stability studies, study review memos
EMT modeling Model requirements, vendor model review, campus aggregation, ride-through, weak-grid, control interaction and load-oscillation studies EMT model specifications, model acceptance reports, PSCAD study reports, SCR screening
MV/MVDC system studies AC and DC short-circuit, DC protection philosophy, AC protection, arc flash, grounding, insulation coordination Study reports, protection philosophy documents, settings files, arc flash labels, interface control documents
Power quality Emission requirements, frequency scans, IEEE 519-2022 compliance, filter sizing, flicker assessment Harmonic study reports, filter specifications, monitoring plans
Substation and transmission design HV/EHV substations, MV collectors, transmission lines, utility interface protection Physical and electrical drawing packages, specifications, bills of material, protection and control design
NERC compliance Registration and applicability, ride-through requirements, model validation, monitoring, compliance programs Applicability assessments, compliance programs, evidence packages, model validation reports
Owner's engineer and QA/QC SST, storage and substation specifications, design reviews, FAT and SAT plans and witnessing, multi-unit QA Specifications, review comments, test plans, witness reports, due diligence reports
Onsite generation and BESS Role definition and sizing, DC bus control architecture, fire and code compliance coordination, performance testing Sizing studies, control architecture documents, specifications, test procedures

Storage and generation

Term Meaning
AFE Active front end. The actively switched AC/DC stage of an SST that connects to the MV grid and sets its grid behavior.
Aggregated model A model in which many converters are represented by a smaller number of equivalent converters to make campus-scale simulation practical.
Arc flash The release of energy from an electric arc fault, assessed as incident energy at a working distance to set PPE and safe work practices.
BESS Battery energy storage system.
Blocking Turning off all converter switches so the converter stops feeding current, used to limit DC faults.
Composite load model A positive-sequence load model that combines several load types, such as motors, electronics and static loads.
DAB Dual active bridge. An isolated DC/DC converter topology with active bridges on both sides of a high-frequency transformer.
DC-link The internal DC capacitor bank between converter stages.
EMT Electromagnetic transient simulation. Time-domain simulation with microsecond time steps, used to study fast converter and network behavior.
FAT Factory acceptance test.
Grid-forming A converter control mode that sets its own voltage and frequency reference rather than following the grid's, providing support to weak grids.
HIL Hardware-in-the-loop testing, in which a real controller is tested against a real-time simulation.
IBR Inverter-based resource. Generation or storage connected to the grid through power electronics.
Insulation coordination Matching the insulation strength of equipment to the voltage stresses the system produces, with surge protection where needed.
ISC/IL The ratio of available short-circuit current to maximum demand load current at the point of common coupling, used to set IEEE 519 limits.
ISOP Input-series, output-parallel. A modular converter arrangement that shares a high input voltage across cells in series and combines their outputs in parallel.
Large load A load large enough to affect transmission system reliability. Definitions vary, for example 75 MW and above under Texas SB 6, or loads above 20 MW in the federal rulemaking proposal.
LVDC Low-voltage DC, such as 800 VDC or ±400 VDC rack distribution.
MFT Medium-frequency transformer. The compact isolation transformer inside an SST, operating at kilohertz frequencies.
MMC Modular multilevel converter. A converter built from many submodules with their own capacitors, producing a stepped multilevel waveform.
MVDC Medium-voltage DC distribution, roughly 1 kV to 35 kV DC in common usage.
OE Owner's engineer. An independent engineer representing the owner's technical interests.
PCC / POI Point of common coupling / point of interconnection, where the campus connects to the utility system and where compliance is usually assessed.
PLL Phase-locked loop. The control element that tracks grid voltage phase and frequency.
Positive-sequence model A fundamental-frequency, balanced dynamic model used in PSS®E, PSLF and similar tools.
Ride-through The ability to stay connected and keep operating during and after a grid disturbance within defined limits.
SAT Site acceptance test.
SCR Short-circuit ratio. Available short-circuit power divided by converter rating, a measure of grid strength.
SiC Silicon carbide, a wide-bandgap semiconductor material that allows higher voltage, higher frequency switching.
SST Solid-state transformer. A power electronic converter with a high-frequency isolation stage that replaces a 60 Hz transformer and rectifier chain.
Supraharmonics Emissions in the 2 kHz to 150 kHz range, above the range covered by most harmonic limits.
TDD Total demand distortion. Harmonic current distortion relative to maximum demand current, used in IEEE 519.
WSCR Weighted short-circuit ratio. An SCR screen that accounts for several inverter-based plants sharing a network area.

Links were current at publication (November 2026). Large-load rules, NERC actions and standards editions are changing quickly, so confirm current versions before relying on them.


Large-load reliability and NERC


Federal and state large-load rules


Solid-state transformers and DC data center power


Standards referenced (consult the publisher for the current edition)

Step 5 — options. Replacing or retrofitting the drives with active-front-end or 18-pulse units at about 5% THDi gives a TDD of about 1.5%. An active harmonic filter sized for the 5th and 7th could achieve a similar result at the facility level. A passive 5th-harmonic tuned filter would also work but must be checked for resonance with the utility system and with any future capacitors.


What this means for you.


The same drives can be compliant on a strong system and non-compliant on a weak one. Ask your utility for the maximum short-circuit current at the PCC early in design. If the ratio is below 50, plan for low-harmonic drives or filtering from the start; it is much cheaper than retrofitting.


9. Inverter-based resources: solar, storage and wind


Solar PV, battery energy storage and full-converter wind turbines use pulse-width-modulated inverters with output filters. They are generally low-distortion sources. IEEE Std 1547-2018 (distribution-connected resources) and IEEE Std 2800-2022 (transmission-connected resources) limit their current distortion — total rated-current distortion (TRD) of 5% with individual limits by order, measured against rated current rather than present output. In practice, quality inverters measure 1–3% at rated output.


Three cautions apply:


  1. Percentages rise at low output. At 10% of rated output a 2% distortion (of rated current) looks like 20% THD. Limits referenced to rated current, like TDD, avoid this trap.
  2. Inverters change the system's impedance. Plant collector cables, inverter output filters and capacitor banks add capacitance. They can create resonances near the 5th to 13th harmonics on the 34.5 kV collector or at a 138 kV, 230 kV or 345 kV point of interconnection, amplifying background distortion that the plant did not create.
  3. Background distortion matters. Inverters can absorb or amplify existing voltage distortion depending on their control design. Utilities increasingly require harmonic impedance studies for new plants, sometimes using electromagnetic transient (EMT) simulation.


Keentel's articles on harmonic resonance and on
weak-grid inverter stability cover these interactions in depth.


10. Data centers and other electronic facilities


Data centers are a special case because almost all their load is electronic. Points to check:


  • UPS rectifiers. Double-conversion UPS units with IGBT rectifiers typically draw less than 5% THDi at rated load, rising at low load. Older six-pulse or 12-pulse thyristor UPS rectifiers may need input filters.
  • Server and network power supplies. Modern units with active power factor correction have low 3rd harmonic. Legacy equipment does not. Measure a representative panel rather than assuming.
  • 208Y/120 V and 415Y/240 V distribution. Check neutral current and transformer K-factor as in Sections 4 and 7.
  • Generator operation. Test UPS and generator compatibility at the actual load level. Generator THDv can be three to four times the utility THDv for the same load.
  • Cooling plant. Chiller, pump, fan and cooling distribution unit drives often contribute more low-order harmonics than the IT load. Specify low-harmonic drives where the facility is large relative to the utility source.
  • Large-load interconnection. Utilities and grid operators now treat large data centers as high-impact loads. Harmonic studies and power quality monitoring are increasingly part of interconnection requirements, alongside ride-through and dynamic studies.


11. How a harmonic study is done


A harmonic study answers four questions: How much harmonic current will the facility inject? What voltage distortion will it cause? Will any resonance amplify it? What is the cheapest reliable fix? Keentel's typical workflow:


  1. Gather data. Single-line diagram; utility short-circuit data (maximum and minimum) at the PCC; utility background distortion if known; transformer impedances; cable lengths; capacitor banks and filters; drive, UPS and inverter data sheets with harmonic spectra.
  2. Measure existing conditions. For existing facilities, install class-compliant power quality meters at the PCC and key buses for at least one week, capturing 10-minute and 3-second data up to the 50th harmonic.
  3. Build the model. Represent sources as harmonic current injections and the network as frequency-dependent impedances, including transformer phase shifts that can cancel 5th and 7th harmonics between delta-delta and delta-wye units.
  4. Run a frequency scan. Plot driving-point impedance versus frequency at each important bus to find resonances, for all credible system configurations (tie breakers open/closed, capacitor steps in/out, generator versus utility).
  5. Run harmonic load flow. Calculate harmonic currents and voltages and compare them with IEEE 519 at the PCC and with equipment limits (IEEE 18 for capacitors, C57.110 for transformers) inside the facility.
  6. Design mitigation. Compare options for performance, cost, losses, footprint and future flexibility.
  7. Verify. Measure again after installation and document compliance with the statistical criteria.


12. Fixing harmonics: options compared
Low-Voltage DC (LVDC) Power Distribution for Data Centers: Architectures, Protection and a Practical Path from AC to DC

LVDC data center power distribution chart comparing AC, hybrid, 380 VDC and 800 VDC efficiency. Copy
Calendar icon. D

November 11, 2026 | Blog

Part A — LVDC for Data Centers at a Glance

Data center power systems have been built on alternating current for decades. Power arrives from the utility as AC, passes through transformers and an AC uninterruptible power supply (UPS), and reaches each server, where a power supply finally converts it to the direct current (DC) that every processor actually uses. As rack power climbs from tens of kilowatts toward hundreds of kilowatts, the cost of all those conversion stages becomes harder to ignore: more heat, more copper, more floor space and more components that can fail.


Low-voltage DC (LVDC) distribution moves the AC-to-DC conversion upstream, to the facility or the row, and distributes DC to the racks. The idea is not new: telecom central offices have run on −48 V DC for a century, and 380 V DC data center demonstrations in the United States date back almost twenty years. What is new is the scale. AI and accelerated-computing racks now need so much power that the industry is working on common, vendor-neutral frameworks so that LVDC can be designed, protected, listed, operated and maintained the same way across sites and suppliers.

This guide is Keentel Engineering's engineering view of that framework. It explains the voltage classes in use, the architectures on the path from AC to DC, how DC systems are grounded and protected, what "interoperable" has to mean in practice, how LVDC is operated safely, and how to decide whether and how far a US facility should move to DC.


In plain terms: LVDC means doing the AC-to-DC conversion once, in a few large efficient converters, instead of thousands of times inside individual servers. It can save a few percent of total energy, free space at the rack and simplify storage integration but only if protection, grounding, codes and operating practices are designed for DC from the start.


Scope and companion guides


This guide covers the facility-wide framework: voltage classes, architectures, grounding, protection philosophy, interoperability, operations and migration. Four companion Keentel guides go deeper on specific topics and are referenced rather than repeated here:


  • 800 VDC rack fault protection — solid-state circuit breakers (SSCBs) and fault clearing at the rack.
  • 800 VDC AI data centers and the UPS — energy storage sizing, GPU load transients, generator coordination and DC arc flash.
  • 800 VDC chillers, CDUs and racks — the mechanical–electrical interface and powering cooling equipment from DC.
  • Inside the data center rack — rack power, redundancy and cabling.


The illustrative facility used in this guide

Item Value
Utility service 230 kV, two transformers, N-1
Medium-voltage distribution 34.5 kV to the data halls; 13.8 kV for mechanical plant
Low-voltage AC 480Y/277 V (facility), 415Y/240 V (rack-level AC in the baseline design)
IT hall studied 20 MW of IT load, measured at the 54 V rack busbar
Rack power 100–200 kW per rack, liquid-cooled
DC options evaluated 380 Vdc facility bus (±190 V), 800 Vdc (±400 V) bus, and hybrid AC distribution with an 800 V rack bus

The path from AC to DC

Stage What it looks like Where the AC-to-DC conversion happens
AC today MV transformer → 480 V switchboard → double-conversion or eco-mode AC UPS → PDU → 415/240 V rack → server or rack power supply Inside every server or rack power shelf
Hybrid AC/DC (transition) AC distribution to the row; a row- or rack-level rectifier creates a 400 V or 800 V DC rack bus; DC/DC converters feed a 48–54 V busbar At the row or rack sidecar
LVDC (target) MV transformer → central rectifier (or a medium-voltage solid-state converter) → facility DC bus with storage → DC distribution → rack DC/DC Once, at the facility level

What Keentel's analysis shows


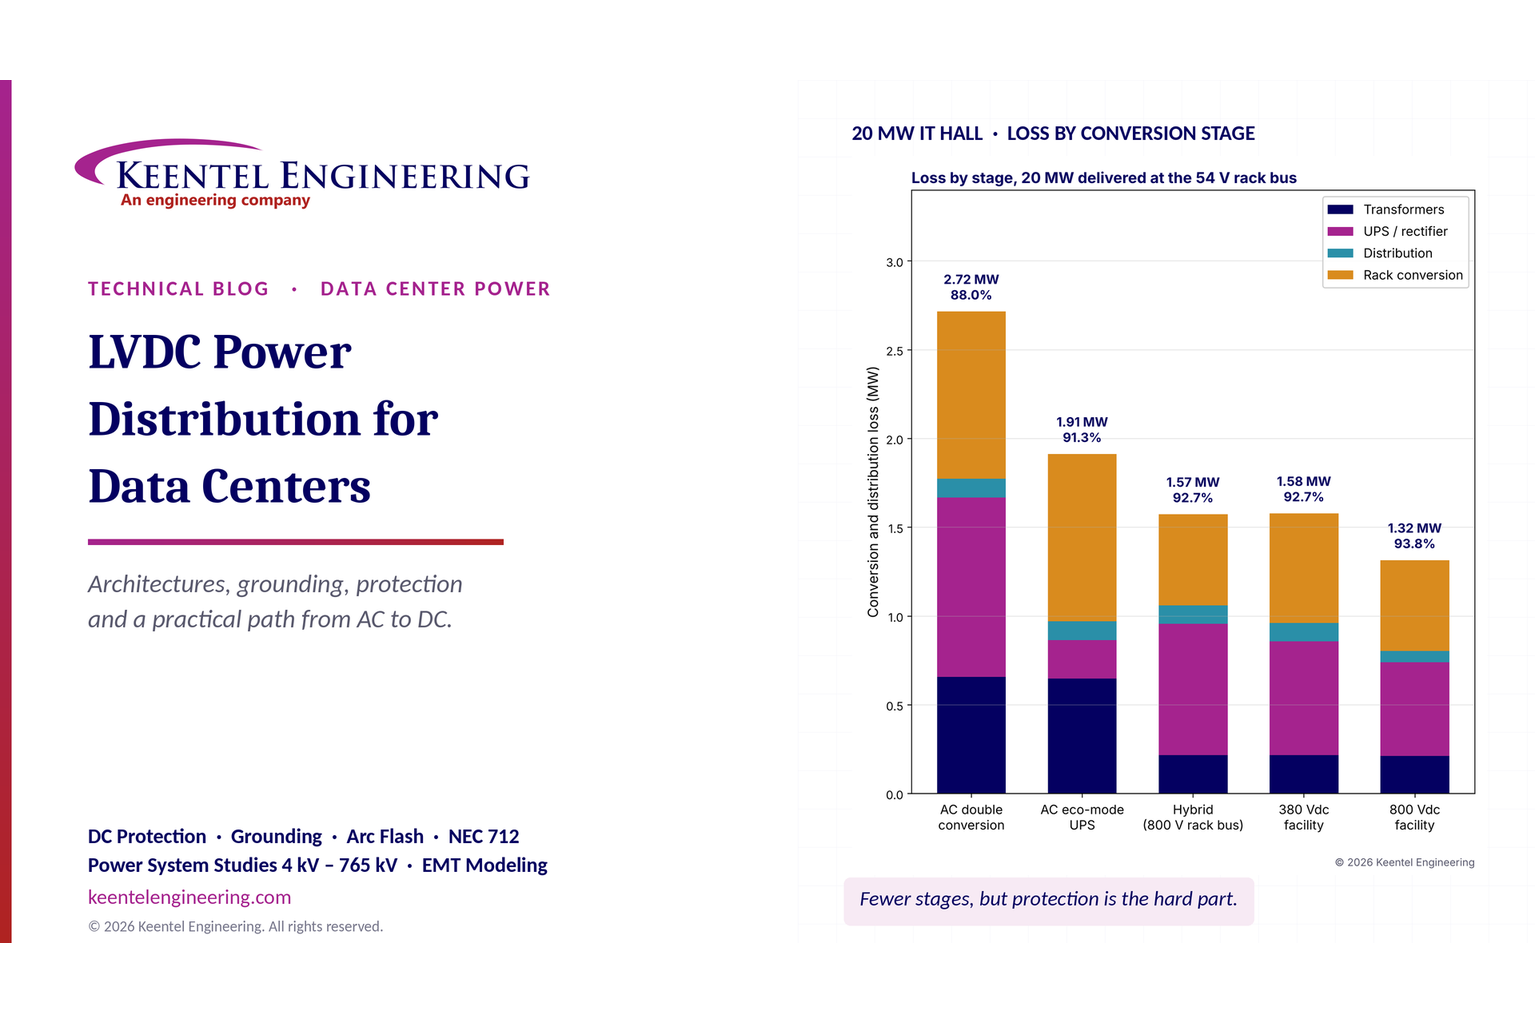
Keentel modeled five architectures delivering 20 MW to the 54 V rack busbar, using representative stage efficiencies for modern equipment (assumptions listed in Part B, Section 6).

Architecture End-to-end efficiency Loss at 20 MW Annual loss energy Savings vs. AC double conversion
A. AC, double-conversion UPS 88.0% 2.72 MW 23,800 MWh —
B. AC, eco-mode UPS 91.3% 1.91 MW 16,800 MWh 7,035 MWh/yr, about $0.49 M/yr
C. Hybrid, 800 V rack bus 92.7% 1.57 MW 13,800 MWh 10,009 MWh/yr, about $0.70 M/yr
D. 380 Vdc facility 92.7% 1.58 MW 13,800 MWh 9,965 MWh/yr, about $0.70 M/yr
E. 800 Vdc facility 93.8% 1.32 MW 11,500 MWh 12,274 MWh/yr, about $0.86 M/yr

Energy priced at $70/MWh. Every megawatt of loss also has to be removed by the cooling plant, which typically adds another 15–30% to the savings.

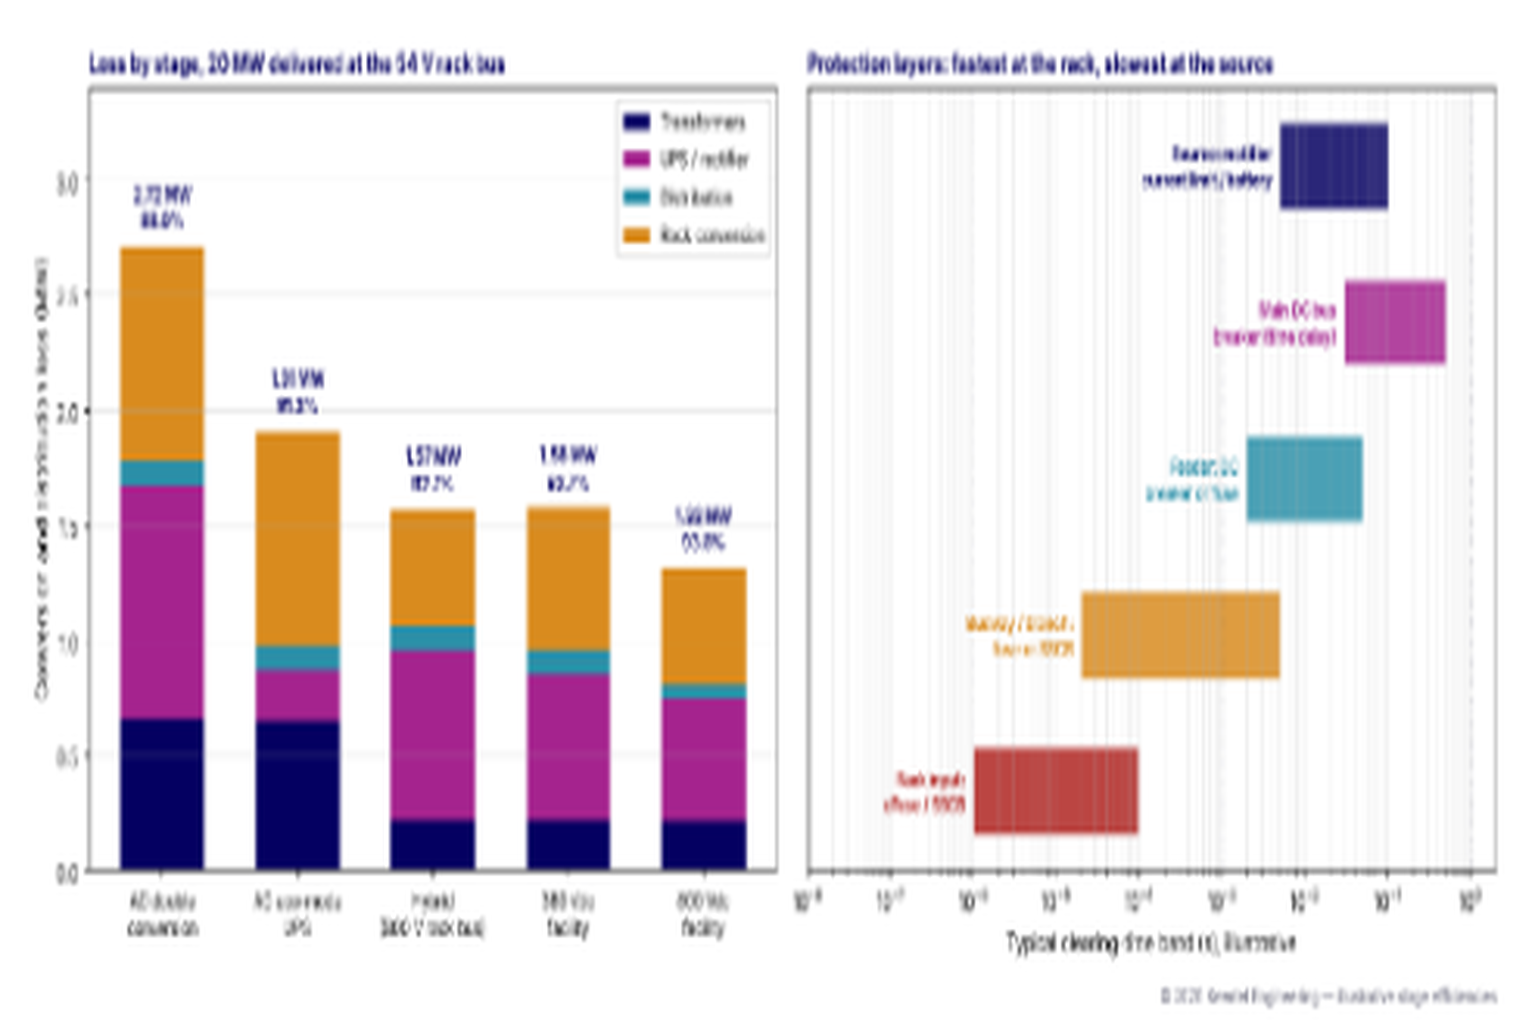
Figure 1. Left: Keentel's stage-by-stage loss comparison for 20 MW delivered at the 54 V rack busbar (illustrative stage efficiencies). Right: the layered protection philosophy for an LVDC system, with the fastest devices nearest the load and time-delayed devices at the source.


Five lessons


  • The efficiency gain is real but depends on the baseline. Against a double-conversion AC UPS, LVDC reduces input energy by about 5.0–6.2% in this model. Against an AC UPS running in eco-mode, the gap shrinks to about 1.5–2.7%. Claims of "much higher efficiency" need a stated baseline.
  • Voltage matters more than "DC" itself. At equal copper, a 380 Vdc two-wire feeder has higher conductor losses than a 415 V three-phase AC feeder. An 800 Vdc feeder has about one-third of the AC losses. The density benefit comes from higher voltage and fewer conversion boxes, not from DC as such.
  • Protection is the hardest part. DC has no current zero to help a breaker interrupt, batteries and capacitors can deliver very fast, very large fault currents, and ground faults are harder to find. LVDC needs a defined protection hierarchy from source to rack.
  • Grounding must be chosen deliberately. Midpoint high-resistance grounding, solidly grounded and ungrounded systems with insulation monitoring each change fault behavior, touch voltage and equipment ratings.
  • Codes and listings set the pace. In the United States, LVDC "at scale" depends on equipment that is listed for the DC voltage and fault duty, on NEC requirements for DC systems and storage, and on NFPA 70E work practices for DC. Plan the listing path before the single-line diagram.


Engineering review of common LVDC claims

Common statement Keentel's check
"LVDC is more efficient because it has fewer conversion stages." Correct in direction. The size of the gain depends on the AC baseline (double conversion vs. eco-mode), the rectifier and DC/DC efficiencies, and the load level. Our model shows reductions of about 1.5–6.2% in input energy, depending on the comparison. Published US demonstrations have reported gains of roughly 5–7% against good AC designs; treat any figure above that with caution.
"DC allows higher compute density." Partly. Higher distribution voltage (800 V) cuts current and copper, and removing AC power supplies frees rack space. A 380 V DC bus by itself does not reduce copper compared with three-phase AC.
"LVDC integrates storage and on-site DC sources more easily." Correct. Batteries, supercapacitors, solar and fuel cells are DC sources; connecting them to a DC bus removes inverter stages. But the bus must then be protected against much higher fault currents.
"LVDC lowers complexity and risk." In the long run, possibly. In the near term, DC protection, grounding, listing and workforce training add complexity that must be managed deliberately.
"Mature LVDC components exist." Rectifiers, DC/DC converters, busways and DC breakers exist, and telecom has decades of DC experience. But listed equipment for 800 V-class data center distribution, rated for the fault duty of large battery systems, is still limited. Verify listings for every device.
"DC breakers work like AC breakers." No. AC breakers rely on the natural current zero every half-cycle. DC breakers must force the current to zero, which requires different arc chutes, DC-specific ratings, fuses with DC ratings or solid-state devices.
"Ground faults are easy to detect." Not on DC. Residual-current methods used for AC do not work the same way, and an ungrounded DC system can run with a first fault undetected unless insulation is continuously monitored.

Part B — The LVDC Framework: An Engineering Guide

1. What "low-voltage DC" means in a data center


1.1 Voltage classes in use


"LVDC" is used loosely in the industry to describe any DC distribution below the medium-voltage range. In practice, four voltage classes appear in data center designs, each with a different purpose and a different set of codes, components and safety practices.

Class Nominal value Typical configuration Where it is used Comment
Board and rack bus 12 V, 48 V, 54 V Unipolar, positive or negative grounded Rack busbar feeding server boards; 48 V telecom heritage (−48 V) Below the 60 V threshold commonly treated as “extra-low” for safety; extra-low voltage for touch purposes, but very high currents at rack power levels
Facility DC, first generation 380 Vdc (often 380–400 V; 360–400 V operating band) Bipolar ±190 V with midpoint grounding, or unipolar Facility or row distribution to IT; US data center and telecom demonstrations since the mid-2000s Comparable insulation stress to 415/240 V AC; mature component base from telecom and industrial DC
High-density rack and row DC 800 Vdc (±400 V), sometimes 750–800 V Bipolar with midpoint high-resistance grounding, or unipolar Rack power for AI and accelerated computing at 100 kW to beyond 500 kW per rack Halves current versus 400 V; protection and listing are less mature
Upper LV DC Up to 1,000 V (US) or 1,500 V (international LV definition) Varies Battery systems, PV and some large DC buses Above 1,000 V the US NEC applies requirements for over-1,000-V systems, and listings change

A key point for US projects: the National Electrical Code (NEC) does not use the international "low voltage directive" definition (up to 1,500 Vdc). Since the 2023 edition, the NEC generally draws its main threshold at 1,000 V, with separate articles and equipment requirements above that. A DC system at or below 1,000 V is still subject to the NEC's general wiring rules, its articles for DC microgrids, storage and batteries, and the listing requirements for every piece of equipment.


1.2 Voltage quantities that must be specified


"800 V" or "380 V" alone is not a specification. A complete LVDC voltage definition includes:


  • Nominal voltage and whether it is measured pole-to-pole or pole-to-ground. A bipolar ±400 V system is 800 V pole-to-pole and 400 V pole-to-ground.
  • Normal operating band — the steady-state range the bus must hold, for example 760–820 V or 360–400 V.
  • Battery float, equalize and end-of-discharge voltages, if storage is on the bus. These often define the extremes of the operating band.
  • Transient limits — the overvoltage and undervoltage levels and durations that loads must ride through without tripping.
  • Insulation coordination — the maximum continuous voltage to ground, the impulse withstand of components, and surge protection levels.


Practical guidance: write the voltage specification as a table with nominal, steady-state band, battery-defined extremes, ride-through envelope and maximum voltage to ground. Every rectifier, converter, breaker, fuse, busway and connector must be rated against that table, not against the nominal value.


1.3 Why the conversation has shifted to higher DC voltages


At 54 V, a 200 kW rack draws about 3,700 A. At 800 V the same rack draws 250 A. Rack busbars, cords, connectors and the conversion equipment inside the rack all scale with current. That is why recent industry work has focused on 800 V-class rack inputs, while 380 Vdc remains attractive at the facility and row level where its components are more mature.


2. Why move from AC to DC at all


2.1 The conversion chain today


In a conventional US facility, power passes through these stages before it reaches a processor:

1. Utility transformer (for example 230 kV to 34.5 kV) and a facility MV/LV transformer (34.5 kV to 480Y/277 V).

2. A double-conversion UPS: rectifier (AC to DC), battery bus, inverter (DC back to AC).

3. A PDU transformer (480 V to 415Y/240 V), if racks use 415/240 V.

4. The rack or server power supply: AC to DC, with power-factor correction, then DC/DC to 54 V or 12 V.

5. Board-level voltage regulators (12 V or 54 V down to below 1 V for processors).

Stages 2 and 4 each convert AC to DC. Stage 2 converts DC back to AC in between. An LVDC architecture removes the inverter in stage 2, removes the PDU transformer, and replaces many small AC power supplies with fewer, larger rectifiers.


2.2 What LVDC can deliver


  • Efficiency — fewer conversion stages and larger, more efficient converters.
  • Space — removing the AC power supplies from racks frees space for compute; removing PDU transformers frees white space.
  • Storage integration — batteries connect to the DC bus without an inverter, and fast storage can buffer large load swings.
  • Simpler harmonics management — the facility rectifier becomes the single point where harmonic performance at the utility interface is controlled (IEEE 519).
  • A path to on-site DC sources — solar, fuel cells and storage can feed the DC bus directly.


2.3 What LVDC does not deliver automatically


  • It does not reduce the heat generated by the IT equipment itself, which is most of the load.
  • It does not remove the need for redundancy, generators or utility-grade protection.
  • It does not, by itself, reduce copper: that depends on voltage level and conductor count (Worked example 1).
  • It does not simplify protection — it changes it.


Worked example 1 — Current and copper for a 500 kW row

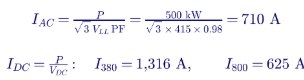
A 500 kW row of racks is fed three ways: 415 V three-phase AC at 0.98 power factor, a 380 Vdc two-wire bus, and an 800 Vdc two-wire bus.

For a fixed total copper cross-section shared equally among n current-carrying conductors, each carrying current I, the conductor loss is proportional to n²I²:

Feeder Current per conductor Current-carrying conductors Relative loss at equal copper
415 V three-phase AC 710 A 3 (plus neutral) 1.00
380 Vdc two-wire 1,316 A 2 1.53
800 Vdc two-wire 625 A 2 0.34

Interpretation. A 380 Vdc bus needs about 50% more copper than 415 V three-phase AC to have the same losses the opposite of what many presentations imply. Three-phase AC is very efficient at delivering power through copper. An 800 Vdc bus needs about one-third of the copper of 415 V AC for the same losses. The copper and density benefit of LVDC comes from moving to higher DC voltage.


3. Architectures on the path from AC to DC


3.1 Architecture A — AC with double-conversion UPS (today's baseline)


MV transformer → 480 V switchboard → double-conversion UPS → PDU → 415/240 V rack → rack power shelf (AC to 54 V). This is the most widely deployed design. It isolates IT from utility disturbances well, but each kilowatt passes through two full conversions plus the rack power supply.


3.2 Architecture B — AC with eco-mode or multi-mode UPS


The UPS normally passes utility power through a bypass path and transfers to inverter operation only when the supply is disturbed. UPS efficiency rises from about 95–96% to about 99%. This is the fairest efficiency baseline when evaluating LVDC, because it is what an efficiency-focused AC design would actually use. Its trade-offs are a short transfer on disturbance and less filtering of utility events; IT power supplies and rack storage must ride through.


3.3 Architecture C — Hybrid: AC to the row, DC at the rack


AC distribution continues to the row. A row- or rack-level "sidecar" rectifier converts 415 V or 480 V AC to an 800 V (or 400 V) DC rack bus, and DC/DC converters in the rack produce 54 V. Battery backup units may sit on the rack DC bus. This architecture is the usual transition step: it changes the rack without rebuilding the facility, and it can be deployed hall by hall.


3.4 Architecture D — 380 Vdc facility distribution


A central rectifier plant (N+1 modules) converts 480 V AC to a 380 Vdc bus, with batteries connected directly to the bus. DC switchgear and busway distribute to rows, and rack DC/DC converters produce 54 V. This architecture removes the UPS inverter and all AC power supplies and has the longest operating history among facility DC designs.


3.5 Architecture E — 800 Vdc facility distribution


Similar to Architecture D but at ±400 V. Current is halved, so busway and cable sizes fall and the rack can accept several hundred kilowatts. The rectifier may be fed from 480 V AC or, in emerging designs, from a medium-voltage solid-state converter connected directly at 13.8 kV or 34.5 kV. Medium-voltage solid-state conversion removes the 60 Hz MV/LV transformer, but it is a newer technology whose reliability, protection and listing must be evaluated carefully.


3.6 Comparing the architectures

Criterion A. AC double conversion B. AC eco-mode C. Hybrid D. 380 Vdc E. 800 Vdc
End-to-end efficiency (this model) 88.0% 91.3% 92.7% 92.7% 93.8%
Rack power practical limit ~50–150 kW ~50–150 kW 200 kW+ ~100–200 kW 200 kW to beyond 500 kW
Storage on DC bus UPS battery only UPS battery only Rack-level Facility Facility and rack
Equipment maturity Very high Very high Growing Moderate Emerging
Listing availability (US) Broad Broad Growing Moderate Limited
Workforce familiarity High High Moderate Low to moderate Low
Change to existing buildings None Settings only Rack and row Major Major

3.7 Where the storage sits


  • Central storage on the facility DC bus (Architectures D and E): fewest conversion stages, but the full battery fault current is available on the bus.
  • Distributed storage in each rack (battery backup units, Architecture C): the fault energy at any point is smaller and storage scales with the racks, but there are many more battery systems to monitor and maintain.
  • Both: a central plant for ride-through to generator start, plus rack-level fast storage to smooth workload power swings.


4. Grounding the DC system


4.1 Why grounding is a first decision


Grounding decides what voltage appears between any conductor and earth, what happens at the first ground fault, how large the fault current is, how faults are detected, and which equipment ratings apply. It must be fixed early because it affects every component.


4.2 The main options

Scheme How it works First ground fault Strengths Weaknesses
Solidly grounded unipolar (one pole bonded to ground) Negative or positive pole bonded to the grounding system A fault on the ungrounded pole is a short circuit and trips protection Simple, familiar from telecom (−48 V positive-grounded) Full pole voltage to ground; nuisance trips; risk of DC corrosion where the grounded pole is wrongly referenced
Midpoint high-resistance grounded (bipolar ±V) Midpoint connected to ground through a resistor that limits ground-fault current to a low value Small fault current; the system keeps running and an alarm is raised Halves the voltage to ground (for example ±400 V); allows continued operation; limits arc energy for ground faults Requires sensitive ground-fault detection and location; a second fault on the other pole is a pole-to-pole short
Ungrounded ("floating") with insulation monitoring No intentional connection to ground; an insulation monitoring device (IMD) continuously measures insulation resistance Negligible current; alarm from the IMD Highest continuity; used in battery and PV systems First fault may persist unnoticed without good monitoring; overvoltage to ground during faults and transients
Midpoint solidly grounded (bipolar) Midpoint bonded to ground Pole-to-ground fault is a short circuit on half the voltage Simple fault detection; halved voltage to ground Trips on every ground fault; higher fault current

For facility-scale data center DC, midpoint high-resistance grounding with continuous insulation and ground-fault monitoring is the most common recommendation, because it limits the voltage to ground and lets the system ride through a single ground fault while it is located. Whatever is chosen, the scheme must match the listings of the equipment, the requirements of the NEC for DC systems, and the assumptions in the arc-flash study.


4.3 Ground-fault detection on DC


AC residual-current devices rely on the alternating current to induce a signal; they do not detect smooth DC residual current. DC systems use one or more of the following:


  • Insulation monitoring devices (IMDs) that inject a low-frequency test signal and measure insulation resistance between the system and ground.
  • Midpoint-resistor current measurement in high-resistance grounded systems, with the polarity of the current indicating which pole is faulted.
  • DC-capable residual current sensors at feeders, to locate the faulted circuit.
  • Pulse-injection location systems that trace a test signal to the faulted branch.


Worked example 2 — Insulation monitoring thresholds

A common practice is to set the insulation alarm at about 100 Ω per volt of system voltage, with an earlier warning at about 500 Ω/V. These are typical values; follow the equipment manufacturer and the applicable product standard.

System voltage Warning at 500 Ω/V Alarm at 100 Ω/V
380 Vdc 190 kΩ 38 kΩ
800 Vdc 400 kΩ 80 kΩ

Interpretation. A large DC system has many parallel paths to ground cables, busway, converters, EMI filter capacitors — so its normal insulation resistance falls as the system grows. A threshold set for one rack can nuisance-alarm for a whole hall. Insulation monitoring should therefore be zoned (per bus section or per row), and EMI-filter capacitance to ground should be limited by specification so that monitoring remains effective.


5. Holding the DC bus voltage


5.1 Regulation and droop sharing


Several rectifier modules usually feed one DC bus. To share load without fighting each other, each module's output voltage drops slightly as its current rises a "droop" characteristic. Load then divides according to how closely the modules' setpoints match.

Worked example 3 — Droop sharing between two rectifiers

Two 500 kW rectifiers feed a 380 V bus carrying 1,316 A in total. Their setpoints differ by 0.5 V (0.13%) because of calibration tolerance.

With 2% droop at rated current (1,316 A per rectifier):

Droop R_d Bus voltage at full load Rectifier 1 Rectifier 2 Sharing imbalance
2% 5.78 mΩ 376.0 V 701 A 615 A 13%
4% 11.55 mΩ 372.2 V 680 A 636 A 7%

Interpretation. More droop gives better sharing but a larger voltage swing with load. Tight setpoint calibration, digital current sharing or a master–slave control can reduce imbalance without widening the voltage band. The bus voltage band, droop and sharing method must be specified together, because the rack DC/DC converters must accept the full resulting voltage range.


5.2 Load steps and stability


Accelerated-computing workloads can change rack power by tens of percent within milliseconds. The DC bus must hold voltage through those steps using converter control bandwidth, bus capacitance and fast storage. Large numbers of constant-power DC/DC converters present a negative incremental resistance to the bus, which can cause oscillation if the source impedance and control are not designed together. A DC bus stability study impedance-based or EMT simulation — belongs in every LVDC design. Keentel's 800 VDC UPS guide gives a worked capacitance example for a rack load step.


6. Efficiency: counting every stage


6.1 The method


End-to-end efficiency is the product of the efficiency of each stage in series. Small differences in each stage multiply.

6.2 Stage assumptions used in this guide


These are representative values for modern equipment near rated load. Real values vary with load level, temperature, input voltage and product; use manufacturer curves at the expected operating point.

Stage A. AC double conv. B. AC eco-mode C. Hybrid D. 380 Vdc E. 800 Vdc
MV/LV transformer (34.5 kV to 480 V) 99.0% 99.0% 99.0% 99.0% 99.0%
UPS or central rectifier 95.5% 99.0% 99.0% (eco-mode UPS) 97.0% 97.5%
PDU transformer (480 V to 415 V) 98.0% 98.0% — — —
Distribution (cable, busway) 99.5% 99.5% 99.5% 99.5% 99.7%
Row rectifier (415 Vac to 800 Vdc) — — 97.5% — —
Rack conversion to 54 V 95.5% (AC PSU) 95.5% (AC PSU) 97.5% (DC/DC) 97.0% (DC/DC) 97.5% (DC/DC)
End-to-end 88.0% 91.3% 92.7% 92.7% 93.8%

Worked example 4 — Annual savings for a 20 MW IT hall

For 20 MW delivered at the 54 V rack busbar, operating continuously:

Comparison Power saved Energy saved per year Value at $70/MWh Including cooling at 1.25×
B (eco-mode) vs. A 0.80 MW 7,035 MWh $0.49 M $0.62 M
C (hybrid) vs. A 1.14 MW 10,009 MWh $0.70 M $0.88 M
D (380 Vdc) vs. A 1.14 MW 9,965 MWh $0.70 M $0.87 M
E (800 Vdc) vs. A 1.40 MW 12,274 MWh $0.86 M $1.07 M
D (380 Vdc) vs. B (eco-mode) 0.33 MW 2,929 MWh $0.21 M $0.26 M
E (800 Vdc) vs. B (eco-mode) 0.60 MW 5,239 MWh $0.37 M $0.46 M

Interpretation. Against an efficiency-optimized AC design, LVDC is worth a few hundred thousand dollars a year per 20 MW hall, not millions. The decision therefore rests as much on density, storage integration and future rack power as on efficiency. The figures also show that a well-applied eco-mode AC UPS captures more than half of the gain available from DC.


6.3 Part-load behavior


Most data center equipment runs well below its rating because of redundancy: in a 2N design, each path carries at most half its rated load. Converter efficiency curves typically peak at 40–70% load and fall at low load. A design that looks efficient at rated load may lose much of its advantage at 25–35% load. Compare architectures at the expected operating point, including redundancy.


7. Protecting an LVDC system


7.1 What makes DC protection different


  • No natural current zero. An AC arc extinguishes at each current zero (120 times per second at 60 Hz); a DC arc does not. DC breakers must build an arc voltage higher than the system voltage, or use semiconductors to force the current to zero. Breakers, fuses and switches must carry DC ratings at the actual system voltage and time constant.
  • Two very different fault sources. Rectifiers are current-limited — typically to 1.1–1.5 times rated current within milliseconds. Batteries, supercapacitors and DC-link capacitors can deliver very large currents with very fast rates of rise.
  • Fast rate of rise. With little inductance, DC fault current can reach damaging levels in microseconds near the source of stored energy, before mechanical breakers can move.
  • Selectivity is harder. Time-current coordination between rectifier-fed and battery-fed faults behaves very differently, and protective devices must coordinate across both.


Worked example 5 — Battery-fed versus rectifier-fed fault current

A 380 V lithium-ion battery string with total internal resistance 30 mΩ is connected to the bus, with 5 mΩ of cable and bus resistance to the fault. A 500 kW rectifier feeds the same bus, current-limited to 1.5 times rated.

With 10 µH of loop inductance, the initial rate of rise and the circuit time constant are:

Interpretation. The battery delivers more than five times the rectifier's limited current, reaching most of it within about a millisecond. A protective device sized and coordinated for rectifier-fed faults may never see enough current from the rectifier alone to trip quickly and may be unable to interrupt the battery's contribution. Every protective device must be rated for the maximum prospective current (battery plus capacitors plus rectifiers) at the actual time constant, and must also trip reliably for the minimum (rectifier-only, battery disconnected) case.


7.2 A layered protection hierarchy


A practical LVDC framework defines protection levels from the source to the rack, each with a clear job and coordination rules.

Level Location Typical devices Job
1. Source Rectifiers, battery strings, MV solid-state converter Converter current limit and electronic shutdown; battery string fuses and disconnects; battery management system Limit and isolate each source; never become the first device to clear a downstream fault
2. Main DC bus DC switchgear DC power circuit breakers or listed DC switches with fuses; bus differential or zone protection where justified Clear bus faults; time-delayed backup for feeders
3. Feeder DC switchgear or distribution boards to busway and rows DC-rated molded-case breakers, DC fuses, solid-state breakers Clear feeder and busway faults; coordinate with branch devices
4. Branch / busway tap Plug-in units, row power distribution DC fuses, solid-state breakers Isolate a rack feed or tap without affecting neighbors
5. Rack input Rack power entry, converter input Electronic fuses (eFuses), solid-state breakers, converter input protection with precharge Clear rack faults in microseconds and limit let-through to upstream devices

The design principle is simple: the device closest to the fault clears it first and fastest, and every upstream device waits. Because DC fault current can rise so quickly, the lower levels increasingly use solid-state or hybrid devices that act in microseconds, while upstream mechanical devices provide time-delayed backup.


7.3 Selectivity tools for DC


  • Current magnitude — useful where fault current falls with distance, less useful on short, stiff buses.
  • Time delay — upstream devices wait for downstream ones; limited by the energy that can flow while waiting.
  • Rate of rise (di/dt) — fast-acting devices can detect a fault by its rate of rise before current becomes large.
  • Direction — on buses with storage at several points, directional detection identifies which side the fault is on.
  • Communication — zone-selective interlocking or fast communication between devices lets the device nearest the fault act, while others block.
  • Current limiting — fuses and solid-state devices that limit let-through make upstream coordination easier.


7.4 Precharge and inrush


Connecting a discharged DC-link capacitor to a live bus draws a very large inrush current. Every converter and every bus section with significant capacitance needs a precharge path — a resistor and bypass contactor, or an electronically controlled soft-start — and the protection must distinguish precharge inrush from a fault. Interoperability rules (Section 9) should define precharge behavior for every connectable device.


7.5 Arc flash on DC


The IEEE 1584 arc-flash model applies to three-phase AC systems only. DC incident energy is estimated with the methods in NFPA 70E Informative Annex D, such as the maximum-power method and arc-resistance-based models. DC arcs can be sustained at lower voltages and longer gaps than many engineers expect, and battery-fed faults can last until the battery is disconnected. Keentel's 800 VDC UPS guide includes a worked DC incident-energy example.


8. Reliability and availability


8.1 Fewer stages, fewer failures


For components in series, availability is the product of component availabilities. Each component's steady-state availability depends on its mean time between failures (MTBF) and mean time to repair (MTTR):

Worked example 6 — Single-path availability, AC versus DC

Illustrative values for a single, non-redundant path (real designs are redundant):

Component MTBF (h) MTTR (h) In AC chain In DC chain
MV/LV transformer 400,000 72 Yes Yes
UPS module (AC) 150,000 8 Yes —
PDU transformer 300,000 24 Yes —
Rectifier module (DC) 150,000 8 — Yes
Rack power supply or DC/DC 200,000 1 Yes Yes

Removing the PDU transformer from the path cuts the expected unavailability of a single path by about a quarter. With N+1 redundancy for example seven rectifier modules where six carry the load the unavailability attributable to rectifier modules drops to a few seconds per year, and the transformer and distribution elements dominate.


Interpretation. Fewer series stages help, but redundancy design matters far more than AC versus DC. An LVDC plant must still be designed to the facility's redundancy target (N+1, 2N, distributed redundant), and the DC switchgear, busway and protection become the new single points of failure to manage.


9. Interoperability: what must be common


An LVDC framework only works at industry scale if equipment from different suppliers can be connected, protected and operated together. The areas that must be specified include:

Area What must be defined
Voltage Nominal, steady-state band, transient envelope, ride-through, maximum voltage to ground (Section 1.2)
Grounding System grounding scheme; limits on capacitance and leakage to ground per device; insulation-monitoring compatibility
Fault behavior Maximum fault contribution of each source; minimum fault current for protection; required let-through limits of rack devices
Start-up and connection Precharge method, maximum inrush, hot-plug rules, sequence for connecting and disconnecting under load
Mechanical interfaces Busbar dimensions and positions in the rack, connector types and current ratings, touch-safe design, polarization so that polarity cannot be reversed
Power quality Ripple and noise limits on the bus, converter input impedance for bus stability, harmonic limits at the AC interface (IEEE 519)
Storage interface Battery voltage window, charge and discharge limits, battery management communication, ride-through behavior
Communications Telemetry and control points over open protocols (for example Modbus TCP, SNMP or Redfish-style management APIs), time synchronization for event analysis
Monitoring Required measurements per device: voltage, current, power, energy, temperature, insulation resistance, alarms
Safety labeling DC-specific labels, arc-flash labels, stored-energy warnings and discharge times

Practical guidance: put these items into the purchase specification for every DC device — rectifier, busway, breaker, rack power shelf and battery and require type-test evidence. Interoperability is proved at the interface, not assumed from a nameplate.


10. Integrating storage, on-site sources and cooling


10.1 Energy storage on the DC bus


Connecting batteries directly to the DC bus removes the UPS inverter and gives the fastest possible response. The design questions are:


  • Voltage window. The battery's voltage swings from float to end of discharge. Either the bus accepts that whole range, or a DC/DC converter regulates between battery and bus (adding a stage but decoupling the two).
  • Fault contribution. A directly connected battery sets the maximum fault current on the bus (Worked example 5). String fuses and fast disconnects are essential.
  • Listing and siting. Stationary lithium-ion systems in the United States are listed to UL 9540, with large-scale fire testing to UL 9540A, and installed under NFPA 855 and NEC Article 706. These requirements apply whether the battery sits in a central battery room or inside a rack.
  • Function. Storage may provide ride-through to generator start, smoothing of fast workload swings, or both. These functions have very different power, energy and cycle-life requirements; Keentel's 800 VDC UPS guide sizes each.


10.2 On-site DC sources


Solar, fuel cells and some storage technologies are natively DC. On a DC bus they can connect through a DC/DC converter instead of an inverter and a rectifier. The benefits are real but bounded: on-site solar is usually small relative to data center demand, and fuel cells need fuel supply, permits and their own protection. Any source that can export to the utility, or that is paralleled with the utility through the facility rectifiers, must be evaluated under the utility's interconnection requirements (IEEE 1547 for distribution-connected resources, or transmission-level requirements for larger systems).


10.3 Cooling equipment


Pumps, fans and coolant distribution units (CDUs) must stay running through utility events, or the IT equipment will throttle within seconds. In an LVDC facility they can be fed from the DC bus through drives listed for DC input, or kept on AC with their own ride-through. Chillers and dry coolers usually remain on AC, backed by generators and thermal storage. Keentel's 800 VDC chillers, CDUs and racks guide covers drive DC-link voltages, precharge and discharge, and thermal ride-through.


11. Operations and safety


11.1 Monitoring


An LVDC system should be monitored at every protection level:


  • Bus voltage, current and power at sources, buses and feeders.
  • Rectifier module status, sharing and temperature.
  • Battery state of charge, state of health, cell voltages and temperatures through the battery management system.
  • Insulation resistance and ground-fault location by zone.
  • Protective-device status and trip events, time-stamped for sequence-of-events analysis.
  • Power-quality data at the AC interface (harmonics, voltage events).


11.2 Working safely on DC


  • NFPA 70E applies to DC systems. It includes DC shock-protection boundaries and a DC arc-flash PPE category table, as well as Annex D methods for DC incident energy. An electrical safety program must address DC explicitly.
  • Stored energy. Capacitors in converters and on the bus can stay charged after the source is removed. Specify maximum discharge times and require verification of absence of voltage before work. Batteries cannot be "switched off" — only disconnected — and their terminals remain live.
  • Lockout/tagout procedures must identify every DC source: rectifiers, batteries, rack-level storage and any backfeed through converters.
  • Test instruments must be rated for DC at the system voltage and the appropriate measurement category.
  • Labeling. DC equipment needs labels for voltage, polarity, available fault current, arc-flash incident energy and stored-energy hazards.
  • Training. Most data center technicians have years of AC experience and little DC experience. Training must cover DC arc behavior, polarity, grounding schemes and insulation-monitoring alarms.


11.3 Maintenance


  • Thermographic inspection of DC busway joints and connections, which can loosen and overheat like AC joints.
  • Functional testing of DC breakers and solid-state protection, including trip settings and communication-based schemes.
  • Battery maintenance per the manufacturer, NFPA 855 and, where applicable, IEEE battery maintenance guides.
  • Periodic verification of insulation-monitoring alarms and ground-fault location systems.
  • Firmware management for rectifiers, converters and solid-state breakers, with change control.


12. Codes, standards and listing in the United States


Equipment for an LVDC facility must be listed for its application. The key US documents are:

Area US codes and standards
Installation NFPA 70 (NEC), including articles for DC microgrids (Article 712), energy storage systems (Article 706), storage batteries (Article 480) and IT equipment rooms (Article 645); local amendments
Electrical safety NFPA 70E (DC shock and arc-flash requirements, Annex D DC methods)
Storage UL 9540, UL 9540A, UL 1973, NFPA 855
UPS and power conversion UL 1778 (UPS), UL 62368-1 (IT equipment, including power supplies), UL 1741 (converters for distributed energy resources)
Switchgear and breakers UL 891 (switchboards), UL 1558 and IEEE C37.20.1 (metal-enclosed low-voltage power circuit breaker switchgear), IEEE C37.14 (low-voltage DC power circuit breakers), UL 489 (molded-case breakers, including DC ratings), UL 489B (DC breakers for PV systems)
Fuses UL 248 series (low-voltage fuses, with DC ratings where listed), UL 2579 (PV fuses)
Utility interface IEEE 519 (harmonics), IEEE 1547 (distributed resources, where applicable), serving utility interconnection requirements
Building and fire International Building and Fire Codes as adopted, NFPA 75 and NFPA 76 where applicable

Two practical points matter on every project:


  • Listing gaps. A device listed for AC, or for DC at a lower voltage or lower fault current, is not listed for the LVDC application. For 800 V-class distribution with large battery fault currents, verify DC voltage rating, interrupting rating, time constant and listing for every protective device. Where listed equipment does not exist, field evaluation by a nationally recognized testing laboratory and early engagement with the authority having jurisdiction (AHJ) are needed.
  • Code editions. NEC requirements for DC systems have changed in recent editions and will continue to change. Confirm which edition the AHJ has adopted and check for local amendments.


International standards such as the IEC voltage definitions, telecom DC interface standards and IEC UPS standards are useful references for terminology and interface design, but US installations are governed by the documents above.


13. Cost and adoption barriers

Barrier Why it matters Mitigation
Equipment listing and availability Few listed products at 800 V class with high DC interrupting ratings Specify early; budget for field evaluation; use hybrid designs while the market matures
Protection complexity New coordination problems, solid-state devices, battery fault currents Protection study from the start; layered hierarchy; type-tested devices
Workforce Technicians trained mainly on AC DC-specific safety program, training and procedures
Supply chain Long lead times for DC switchgear and busway; fewer suppliers Multi-sourcing based on interface specifications
Utility interface Large rectifier plants must meet harmonic and ride-through expectations IEEE 519 study; active front-end rectifiers; coordinate with the utility early
Retrofit cost Existing AC facilities cannot simply be converted Hybrid rack-level DC first; facility DC for new halls
Insurance and AHJ familiarity New technology draws scrutiny Engage the AHJ and insurer at concept stage; provide documentation and test evidence

Capital cost comparisons vary widely by site. LVDC removes UPS inverters, PDU transformers and server power supplies, but adds DC switchgear, busway, protection and monitoring. In most current projects the business case is driven by rack power density and storage integration, with efficiency as a secondary benefit.


14. A practical migration roadmap


14.1 Stages

Stage Typical timing What changes Key engineering work
0. Optimize AC Now Eco-mode or multi-mode UPS; higher-efficiency rack power supplies; 415 V distribution Ride-through and transfer testing; harmonic study
1. Rack-level DC Now to near term 400 V or 800 V rack bus fed by sidecar rectifiers; rack battery backup units Rack protection, precharge, grounding; listing review
2. Row or hall DC Near term DC busway to rows from hall-level rectifier plants; central or rack storage DC switchgear, protection hierarchy, insulation monitoring, arc-flash study
3. Facility DC Medium term Facility rectifier plant (or MV solid-state converter) and facility DC bus Bus stability study, utility interface, full DC operating procedures
4. DC-integrated campus Longer term Storage, on-site DC generation and cooling equipment on DC buses Multi-source protection and control, interconnection studies

14.2 Decision matrix

Project situation Recommended approach
Existing AC facility, racks below about 50 kW Optimize AC (stage 0). DC conversion rarely pays.
Existing facility adding AI racks of 100 kW or more Hybrid rack-level DC (stage 1), with AC upstream.
New hall, racks 100–200 kW, conventional supply chain Hybrid or 380 Vdc row distribution; evaluate 800 V for future racks.
New hall or campus, racks of 200 kW to beyond 500 kW 800 V-class rack and row distribution, with a clear listing and protection plan.
Campus with large on-site storage or DC generation Facility DC bus (stage 3 or 4), after a full protection and utility-interface study.

15. LVDC design checklist


  • Voltage specification table: nominal, band, battery extremes, ride-through envelope, maximum voltage to ground.
  • Grounding scheme selected and coordinated with equipment listings, insulation monitoring and the arc-flash study.
  • Fault-current study covering battery, capacitor and rectifier contributions; maximum and minimum fault cases.
  • Protection hierarchy defined for all five levels, with selectivity method for each.
  • Every protective device verified for DC voltage, interrupting rating, time constant and listing.
  • Precharge and inrush limits defined for all connectable equipment.
  • DC bus stability study for converter interaction and load steps.
  • Efficiency comparison at the expected operating point, including redundancy and part load.
  • Storage sized for each function (ride-through, smoothing) and listed to UL 9540 / 9540A.
  • Utility interface study (IEEE 519 harmonics, ride-through and reconnection), plus monitoring, communications and time synchronization.
  • DC safety program (NFPA 70E DC requirements, lockout/tagout for all sources, stored-energy discharge, training), with the AHJ, insurer and utility engaged at concept stage.

Part C — Three Anonymous Case Studies

These composite case studies reflect the kinds of problems Keentel Engineering sees on US data center projects. Names, locations and details have been changed or combined.


Case study 1 — An existing hall that needed 150 kW racks


Situation


An operator in the Mid-Atlantic had a 12 MW data hall built around 480 V switchgear, double-conversion AC UPS and 415/240 V rack distribution, designed for about 15 kW per rack. A tenant wanted to install accelerated-computing racks at about 150 kW each in part of the hall. The operator's first idea was to convert the whole hall to a 380 Vdc facility bus.


Analysis


Keentel reviewed the existing switchgear, UPS, busway, cooling and structure. Converting the whole hall to facility DC would have required new DC switchgear, new busway, a new battery system and an outage the tenant could not accept. Keentel's efficiency model showed that the operator could capture about 3.3 points of efficiency simply by enabling the multi-mode function on its existing UPS systems, after ride-through testing with the new rack power equipment. The new racks themselves needed a higher-voltage rack bus to keep busbar current manageable.


Engineered solution


The hall kept its AC infrastructure. The UPS systems were reconfigured for multi-mode operation after transfer testing. The high-density rows received hybrid power: 415 V AC busway to each row, sidecar rectifiers producing an 800 V rack bus, and rack-level battery backup units for ride-through and load smoothing. Keentel specified the rack bus grounding (midpoint high-resistance), insulation monitoring per row, precharge limits for each rack, and solid-state rack-input protection coordinated with the sidecar rectifier current limit and the upstream AC breakers.


Outcome


The high-density rows were energized in phases without a hall-wide outage. The operator avoided a full DC conversion, captured most of the available efficiency gain through UPS settings, and established a rack-level DC standard it could repeat in other halls.


Case study 2 — A battery that out-muscled the protection


Situation


A developer in the Southwest designed a new hall with a 380 Vdc distribution bus, central rectifiers and a lithium-ion battery plant connected directly to the bus. The protective devices on the DC feeders had been selected using the rectifier current limit as the fault level, because the design team assumed the rectifiers would "limit the fault."


Analysis


Keentel performed a DC fault study that included the battery strings, the DC-link capacitance of the rack converters and the bus inductance. With the battery connected, the prospective fault current at the main bus was more than five times the rectifier-limited current, with a rate of rise of tens of amperes per microsecond. Several feeder devices were not rated to interrupt that current at the system time constant, and the main bus devices would not have coordinated with the feeders for battery-fed faults. In the opposite case battery disconnected for maintenance some downstream devices would not have tripped quickly on rectifier current alone.


Engineered solution


The design was revised with current-limiting DC fuses on each battery string, a fast battery disconnect, feeder devices rated for the full prospective current, and solid-state devices at the busway taps to limit let-through. The protection settings were coordinated for both the maximum (battery connected) and minimum (rectifier only) cases, and the arc-flash study was redone with DC methods.


Outcome


The revised design passed the authority having jurisdiction's review with listed devices at every protection level. Arc-flash labels were reduced at the feeder level because the faster branch devices limited fault duration.


Case study 3 — Insulation alarms that would not stop


Situation


A campus operator in the Midwest commissioned an ungrounded DC distribution system with a single insulation monitoring device for an entire data hall. During commissioning, the insulation alarm triggered repeatedly as racks were added, but no ground fault could be found.


Analysis


Keentel measured insulation resistance and capacitance to ground section by section. Each rack's DC/DC converters had EMI-filter capacitors connected to the chassis, and the long busway runs added capacitance and leakage. As more racks came online, the total insulation resistance of the hall dropped below the alarm threshold, and the large capacitance to ground also disturbed the monitoring device's measurement. There was no fault the system had simply outgrown a single monitoring zone.


Engineered solution


The hall was divided into insulation-monitoring zones by row, each with its own device and DC-capable residual current sensors on the feeders for fault location. A limit on capacitance and leakage to ground was added to the rack power equipment specification, and alarm thresholds were set per zone using the warning and alarm levels in Worked example 2. The operating procedures were updated to explain how to respond to a first ground-fault alarm.


Outcome


Nuisance alarms stopped, and the operator gained the ability to locate a real ground fault to a single row within minutes. The capacitance limit became part of the operator's standard purchase specification.


Part D — 20-Question Technical FAQ

  • 1. What is LVDC in a data center?

    Low-voltage DC distribution delivers DC power from a facility- or row-level rectifier to the racks, instead of distributing AC and converting to DC inside each server. In practice it covers rack buses of 48–54 V, facility or row buses of about 380–400 V, and rack and row buses of about 800 V (±400 V).

  • 2. Is LVDC new?

    No. Telecom facilities have used −48 V DC for about a century, and US demonstrations of 380 Vdc data center distribution began in the mid-2000s. What is new is the push for a common, vendor-neutral framework so that DC can be deployed at the scale required by high-density AI racks.

  • 3. How much more efficient is LVDC than AC?

    It depends on the baseline. In Keentel's model, a 380 Vdc or 800 Vdc facility reduces input energy by about 5.0–6.2% compared with an AC design using a double-conversion UPS, but only by about 1.5–2.7% compared with an AC design using an eco-mode UPS. Published US demonstrations have reported gains in the range of roughly 5–7% against good AC designs. Compare designs at the expected operating load, including redundancy.

  • 4. Why do some designs use 380 V and others 800 V?

    380 Vdc has the longer track record and a broader component base, and its insulation stress is similar to 415/240 V AC. 800 Vdc halves current, which matters when racks reach hundreds of kilowatts. Many designs are expected to use 800 V-class buses for high-density racks and keep lower voltages elsewhere.

  • 5. Does DC really reduce copper?

    Only at higher voltage. For equal losses, a 380 Vdc two-wire feeder needs about 50% more copper than 415 V three-phase AC. An 800 Vdc two-wire feeder needs about one-third of the copper of 415 V AC (Worked example 1).

  • 6. Is 800 V DC "low voltage" under US codes?

    Under the NEC, systems up to 1,000 V are treated differently from systems above 1,000 V, and an 800 V DC system falls below that threshold. But it is still a hazardous voltage: NEC wiring, DC-specific equipment listing and NFPA 70E work practices all apply. The international definition of "low voltage" (up to 1,500 Vdc) does not govern US installations.

  • 7. How should an LVDC system be grounded?

    Most facility-scale designs favor a bipolar system with midpoint high-resistance grounding, which halves the voltage to ground and allows operation to continue after a single ground fault while it is located. Ungrounded systems with insulation monitoring and solidly grounded systems are also used. The choice must match equipment listings and the protection and arc-flash studies.

  • 8. Why are DC ground faults harder to find?

    Standard AC residual-current devices do not respond to smooth DC residual current, and an ungrounded or high-resistance grounded system draws very little current on a first fault. DC systems need insulation monitoring devices, midpoint-current measurement, DC-capable residual current sensors or pulse-injection location systems.

  • 9. Why are DC breakers different from AC breakers?

    AC current crosses zero 120 times per second at 60 Hz, which helps extinguish the arc in a breaker. DC current does not. A DC breaker must create an arc voltage higher than the system voltage, or use semiconductors, to force the current to zero. Breakers and fuses must carry DC ratings at the actual voltage and circuit time constant.

  • 10. Do rectifiers limit fault current?

    Rectifiers typically limit their own output to about 1.1–1.5 times rated current. But batteries, supercapacitors and converter capacitors on the bus are not limited, and can deliver many times that current within a millisecond (Worked example 5). Protection must be designed for both the maximum and the minimum fault cases.

  • 11. What is a protection hierarchy for LVDC?

    A defined set of levels — source, main bus, feeder, branch or busway tap, and rack input — each with devices rated and coordinated so that the device nearest the fault clears it first. Because DC faults rise quickly, lower levels increasingly use solid-state devices that act in microseconds.

  • 12. What is precharge and why does it matter?

    Converters have DC-link capacitors that draw a very large inrush when connected to a live bus. A precharge circuit limits that inrush. Without precharge, connecting equipment can damage connectors and capacitors, and can trip upstream protection.

  • 13. How does storage connect to an LVDC bus?

    Either directly — the battery voltage defines part of the bus voltage range — or through a DC/DC converter that regulates between battery and bus. Direct connection is more efficient and faster but sets the maximum fault current. Storage must be listed to UL 9540, fire-tested to UL 9540A and installed under NFPA 855 and NEC Article 706.

  • 14. Can solar or fuel cells feed the DC bus?

    Yes, through DC/DC converters, which removes inverter stages. But on-site sources are usually small relative to data center demand, and any source that can parallel with or export to the utility must meet the utility's interconnection requirements.

  • 15. How do paralleled rectifiers share load?

    Typically through droop control, where each rectifier's voltage falls slightly with current. Sharing accuracy depends on setpoint matching and the droop slope; in Worked example 3, a 0.5 V setpoint difference causes a 13% imbalance at 2% droop and 7% at 4% droop. Digital current sharing can improve this without widening the voltage band.

  • 16. Is DC arc flash a real concern?

    Yes. DC arcs can be sustained at low voltages, and battery-fed faults can last until the battery is disconnected. IEEE 1584 applies only to three-phase AC; DC incident energy is estimated with the methods in NFPA 70E Informative Annex D. Fast branch-level protection is one of the best ways to reduce DC arc-flash energy.

  • 17. Does LVDC make a data center more reliable?

    Removing series stages helps: in Worked example 6, removing the PDU transformer from a single path cuts expected unavailability by about a quarter. But redundancy design matters much more, and the DC switchgear and protection become new elements to manage. LVDC is not automatically more reliable; it must be designed to the same redundancy target.

  • 18. What standards apply to LVDC equipment in the United States?

    Key documents include the NEC (including Articles 712, 706, 480 and 645), NFPA 70E, UL 9540 and 9540A, UL 1973, NFPA 855, UL 1778, UL 62368-1, UL 1741, UL 891, UL 1558, IEEE C37.14, UL 489 and the UL 248 fuse series. Verify DC voltage and interrupting ratings and listings for every device.

  • 19. Should an existing AC facility convert to DC?

    Usually not all at once. The most practical path is to optimize the existing AC system (eco-mode or multi-mode UPS), then add rack-level DC for high-density racks, and reserve full facility DC for new halls or campuses where the design can start from DC.

  • 20. What is the first step for an owner considering LVDC?

    Define the rack power roadmap, then run a concept study comparing an optimized AC design, a hybrid design and a DC design at the expected operating load. The study should cover efficiency, copper, storage, protection, grounding, listing availability and the utility interface. Engage the authority having jurisdiction, the insurer and the utility early.


Keentel Services, References and Contact

How Keentel Engineering Helps


Keentel Engineering supports data center owners, developers, operators and EPC contractors through every stage of the move from AC to DC power.


  • Architecture and concept studies. Side-by-side comparison of optimized AC, hybrid and LVDC designs at the expected operating load: efficiency, copper, space, storage and cost.
  • DC protection and coordination. Fault-current studies including batteries and capacitors, a five-level protection hierarchy, device rating and listing verification, and coordination for maximum and minimum fault cases.
  • Grounding and insulation monitoring. Selection of the grounding scheme, insulation-monitoring zoning, ground-fault location and specification limits for equipment leakage and capacitance.
  • DC arc-flash studies. Incident-energy analysis using NFPA 70E Annex D methods, labeling and safe work practice support.
  • Bus stability and power quality. EMT and impedance-based studies of converter interaction, load steps and bus voltage regulation; IEEE 519 harmonic studies at the utility interface.
  • Storage and on-site source integration. Battery sizing for ride-through and smoothing, UL 9540 / NFPA 855 coordination, and interconnection studies for on-site generation.
  • Specifications and interoperability. Voltage, grounding, fault, precharge, mechanical and communication requirements written into purchase specifications.
  • Utility interconnection and substation design. Large-load interconnection studies, 138 kV to 345 kV substations, and 34.5 kV and 13.8 kV distribution.
  • Commissioning support. Protection testing, insulation-monitoring verification and integrated systems testing for DC systems.


Why Clients Choose Keentel


  • AC and DC under one roof. We design utility interconnections, substations and facility power systems, so the DC design fits the whole system.
  • Power system studies from 4 kV to 765 kV, including EMT modeling of power-electronic systems.
  • US code and standards fluency — NEC, NFPA 70E, UL, IEEE, NESC and utility requirements.
  • Independent, vendor-neutral advice focused on what the facility actually needs.
  • Responsive senior engineers who stay with the project from concept through energization.


Talk to Keentel Engineering


Considering DC power for a new hall, planning high-density racks in an existing facility or reviewing a DC design? Keentel Engineering can help you choose the right architecture and design it safely.


  • Phone: (813) 389-7871
  • Email: contact@keentelengineering.com
  • Book a 15-minute call: calendly.com/keentel-engineering/15min
  • Web: keentelengineering.com


References


  • NFPA 70, National Electrical Code, 2023 edition (including Articles 480, 645, 706 and 712).
  • NFPA 70E, Standard for Electrical Safety in the Workplace, 2024 edition (including Informative Annex D).
  • NFPA 855, Standard for the Installation of Stationary Energy Storage Systems.
  • UL 9540, Energy Storage Systems and Equipment; UL 9540A, Test Method for Evaluating Thermal Runaway Fire Propagation in Battery Energy Storage Systems.
  • UL 1973, Batteries for Use in Stationary and Motive Auxiliary Power Applications.
  • UL 1778, Uninterruptible Power Systems.
  • UL 62368-1, Audio/Video, Information and Communication Technology Equipment.
  • UL 1741, Inverters, Converters, Controllers and Interconnection System Equipment for Use With Distributed Energy Resources.
  • UL 891, Switchboards; UL 1558, Metal-Enclosed Low-Voltage Power Circuit Breaker Switchgear.
  • IEEE C37.14, Standard for DC (3200 V and below) Power Circuit Breakers Used in Enclosures.
  • IEEE C37.20.1, Standard for Metal-Enclosed Low-Voltage Power Circuit Breaker Switchgear.
  • UL 489, Molded-Case Circuit Breakers, Molded-Case Switches and Circuit-Breaker Enclosures; UL 489B, for use with photovoltaic systems.
  • UL 248 series, Low-Voltage Fuses; UL 2579, Low-Voltage Fuses — Fuses for Photovoltaic Systems.
  • IEEE Std 519, Harmonic Control in Electric Power Systems.
  • IEEE Std 1547, Interconnection and Interoperability of Distributed Energy Resources with Associated Electric Power Systems Interfaces.
  • IEEE Std 1584, Guide for Performing Arc-Flash Hazard Calculations (AC only; cited for scope).
  • ASHRAE TC 9.9, Thermal Guidelines for Data Processing Environments.
  • Lawrence Berkeley National Laboratory, DC power distribution demonstration reports for data centers (mid-2000s).
  • Industry alliance specifications for 380 Vdc distribution in data centers and telecom facilities (current editions).
  • Open hardware industry group publications on rack-level and facility-level DC power distribution (current editions).


Disclaimer


This article is provided by Keentel Engineering for general technical education. It is not engineering advice for any specific project. Stage efficiencies, MTBF and MTTR values, fault parameters, thresholds and costs are illustrative; real projects must use manufacturer data, site-specific studies and the code editions adopted by the authority having jurisdiction. DC power distribution technology, equipment listings and code requirements are changing quickly; confirm current requirements before design. Case studies are composite and anonymized. Keentel Engineering accepts no liability for decisions made on the basis of this article without a project-specific review. © 2026 Keentel Engineering. All rights reserved. Written by Keentel Engineering.


Office Address Phone
Head Office — Tampa 400 N Ashley Dr STE #2600, Tampa FL 33602 (813) 389-7871
Austin 5900 Balcones Drive STE 100, Austin TX 78731 (512) 591-0752
Sacramento 1401 21st St Ste R, Sacramento CA 95811 (916) 913-4524
Baltimore 306 W Redwood St STE 200, Baltimore MD 21201 (410) 225-2181


A smiling man with glasses and a beard wearing a blue blazer stands in front of server racks in a data center.

About the Author:

Sandip "Sonny" R. Patel, P.E.

IEEE Senior Member · Founder & CEO, Keentel Engineering

In 1995, Sonny Patel earned his Electrical Engineering degree from the University of Illinois. But degrees don't build legacies — action does.

For three decades, he has worked the power industry from every side of the table: 16 years as a utility engineer at Exelon/Commonwealth Edison; generation leadership across hydroelectric, industrial steam turbine, and a 9 GW renewable fleet; NERC Regional Entity Senior Compliance Engineer and Audit Team Lead, auditing some of the nation's largest utilities; and testing and commissioning lead on equipment up to 765 kV — the very top of the North American grid.Utility. Generator. Regulator. Consultant. Few engineers have seen all four seats. Fewer still have sat in them.

His experience spans nuclear, hydro, conventional generation, renewables, oil and gas, mining — and today's data centers, where he is authoring a three-book series on data center design. He is a Licensed Professional Engineer in six states and a Licensed Electrical Contractor in Florida (Unlimited EC) — he doesn't just design the work; he's qualified to stand behind its execution.Today, as Founder and CEO of Keentel Engineering, Sonny leads a nationwide team of engineers delivering substation design, power system studies, NERC compliance, and commissioning — done right, coast to coast.Three decades. Every side of the table. One standard: accountable engineering.

Four workers in safety vests and helmets stand with arms crossed near wind turbines.

Let's Discuss Your Project

Let's book a call to discuss your electrical engineering project that we can help you with.

Man in a blazer and open shirt, looking at the camera, against a blurred background.

About the Author:

Sandip "Sonny" R. Patel, P.E.

IEEE Senior Member · Founder & CEO, Keentel Engineering

In 1995, Sonny Patel earned his Electrical Engineering degree from the University of Illinois. But degrees don't build legacies — action does.

For three decades, he has worked the power industry from every side of the table: 16 years as a utility engineer at Exelon/Commonwealth Edison; generation leadership across hydroelectric, industrial steam turbine, and a 9 GW renewable fleet; NERC Regional Entity Senior Compliance Engineer and Audit Team Lead, auditing some of the nation's largest utilities; and testing and commissioning lead on equipment up to 765 kV — the very top of the North American grid.

Utility. Generator. Regulator. Consultant. Few engineers have seen all four seats. Fewer still have sat in them.

His experience spans nuclear, hydro, conventional generation, renewables, oil and gas, mining — and today's data centers, where he is authoring a three-book series on data center design. He is a Licensed Professional Engineer in six states and a Licensed Electrical Contractor in Florida (Unlimited EC) — he doesn't just design the work; he's qualified to stand behind its execution.

Today, as Founder and CEO of Keentel Engineering, Sonny leads a nationwide team of engineers delivering substation design, power system studies, NERC compliance, and commissioning — done right, coast to coast.Three decades. Every side of the table. One standard: accountable engineering.

Leave a Comment

Related Posts

Grid reliability vs. resilience comparison showing storm outage and power restoration performance
By SANDIP R PATEL • November 11, 2026
Explore grid reliability vs. resilience, extreme weather planning, outage recovery, IEEE 1366 metrics, microgrids and IBR challenges with Keentel Engineering.
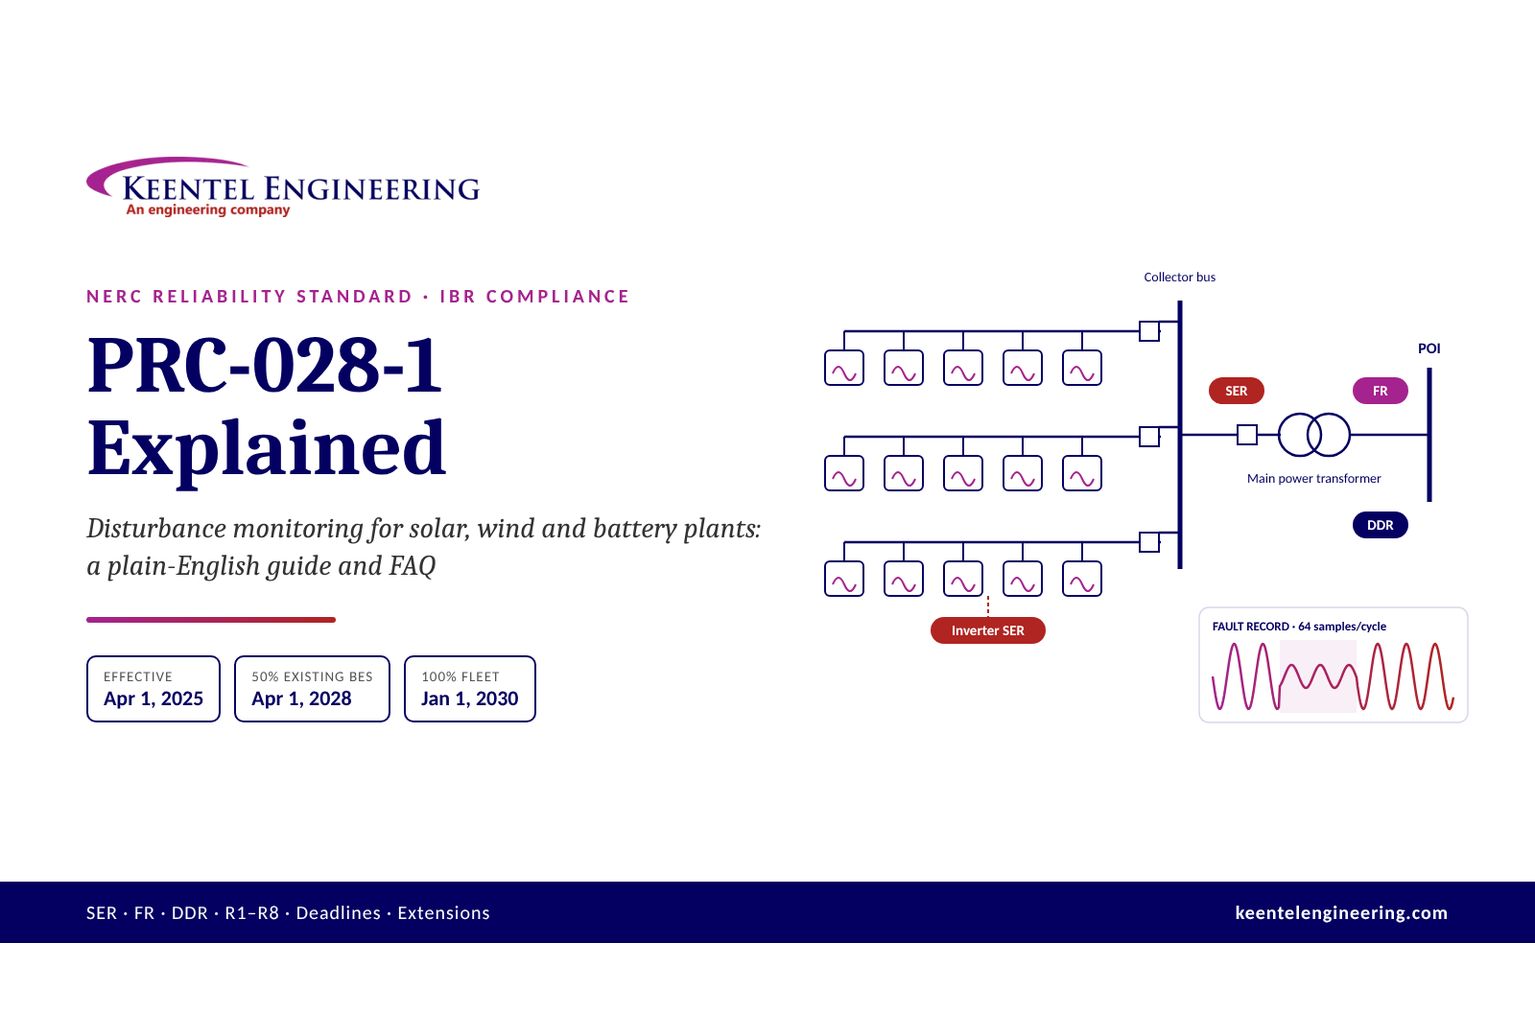
PRC-028-1 Explained: What Every Solar, Wind & Battery Owner Needs to Know
By SANDIP R PATEL • November 10, 2026
Learn NERC PRC-028-1 requirements for solar, wind and BESS, including disturbance monitoring, recording standards, deadlines and compliance steps from Keentel.
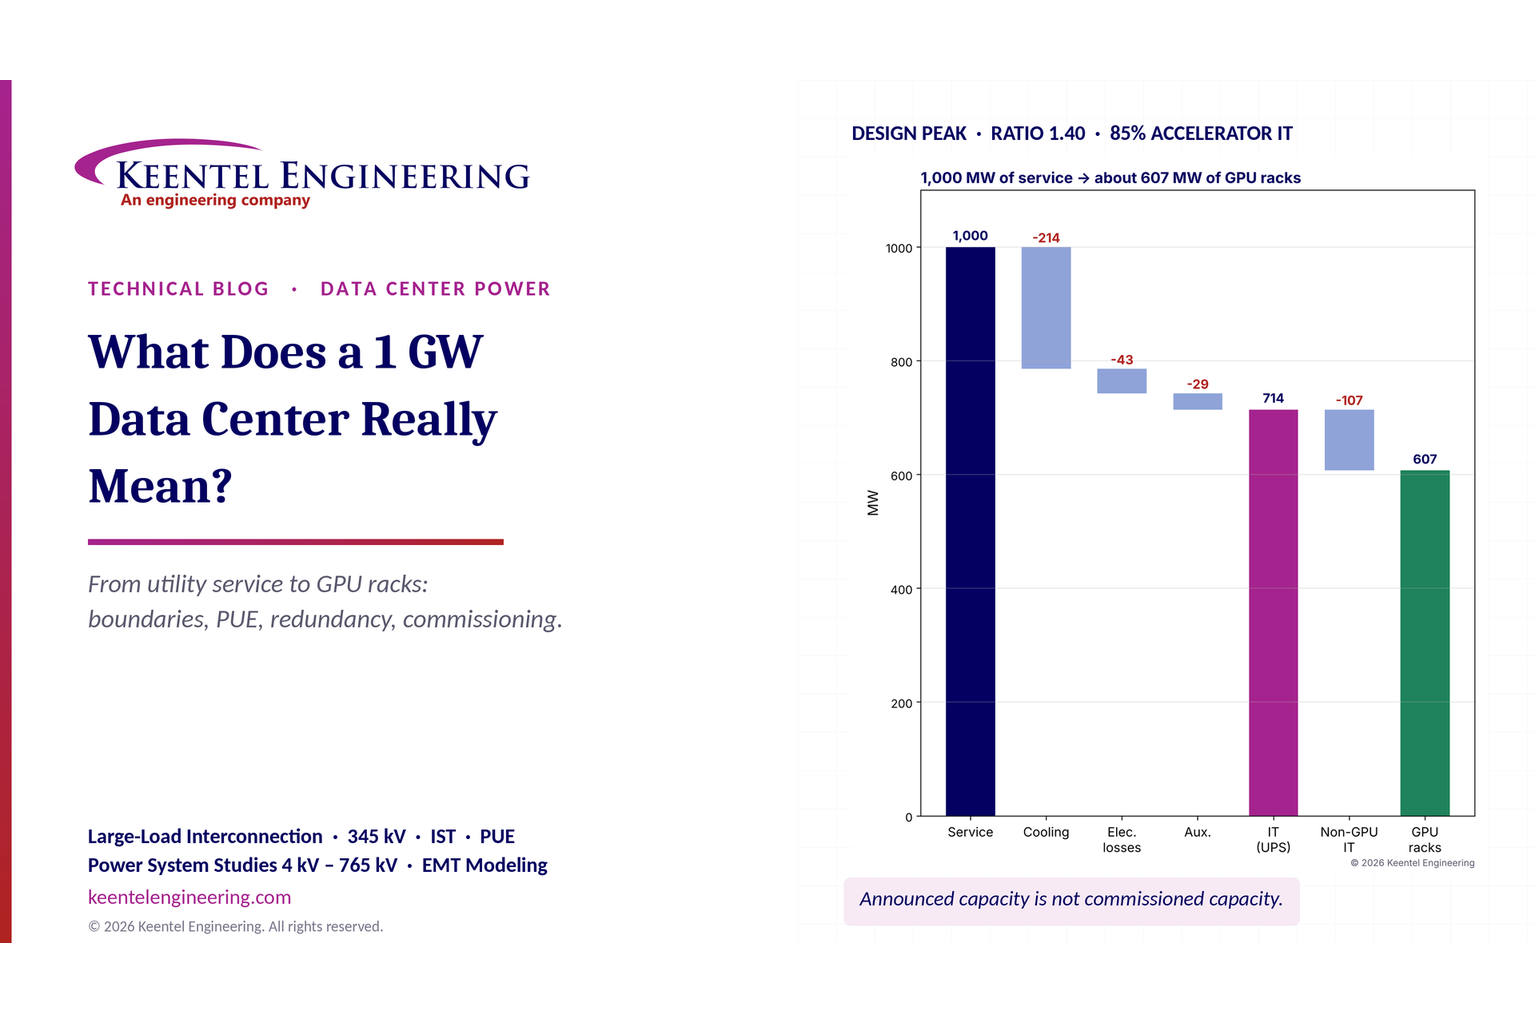
1 GW data center power capacity breakdown from utility service to GPU racks.
By SANDIP R PATEL • November 8, 2026
What does a 1 GW data center mean? Explore power capacity, PUE, GPU racks, grid interconnection and commissioning with Keentel Engineering's expert guide.
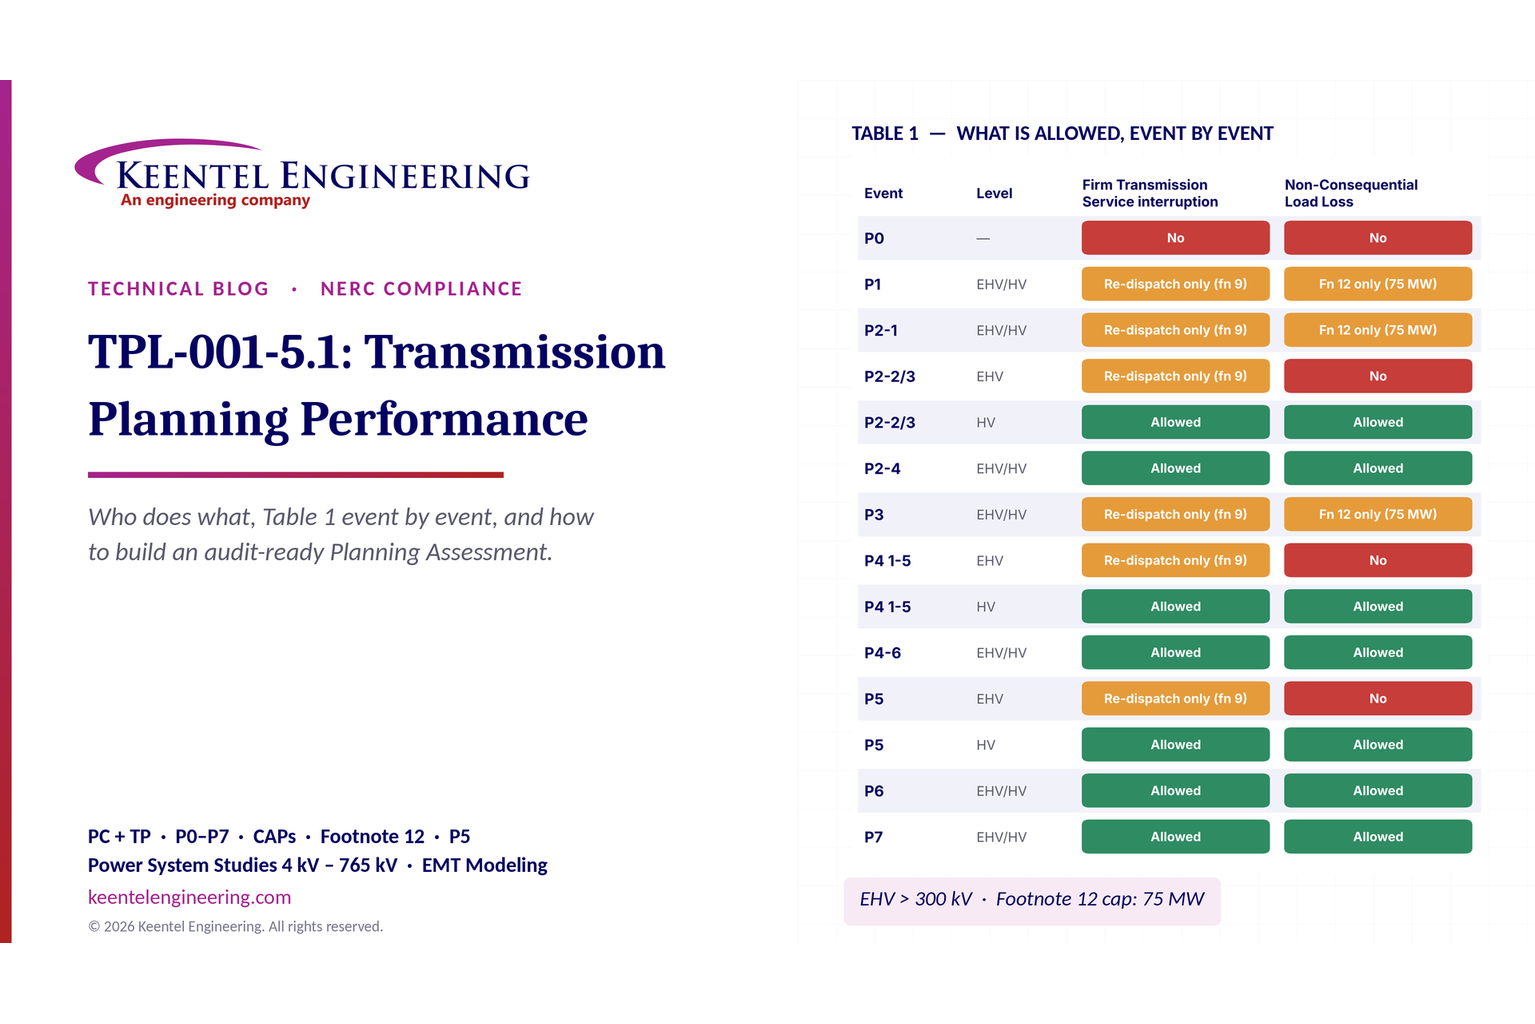
TPL-001-5.1 transmission planning performance and NERC compliance requirements
By SANDIP R PATEL • November 8, 2026
Explore NERC TPL-001-5.1 requirements, P0–P7 planning events, Table 1, corrective action plans and annual assessments with Keentel Engineering.
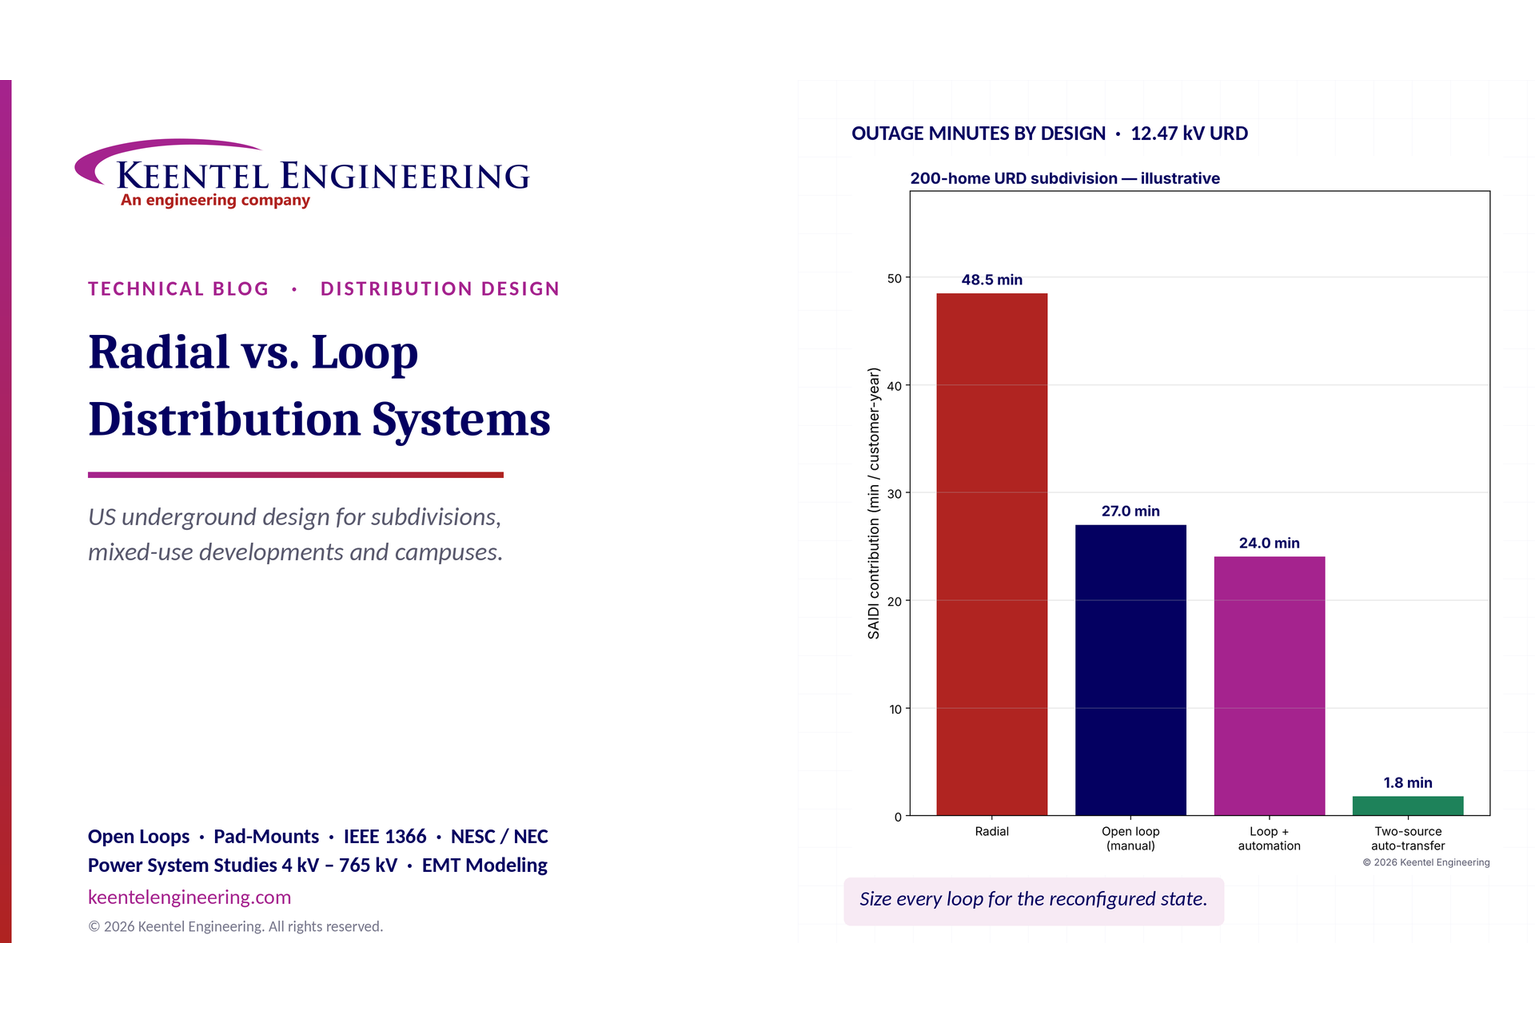
Radial vs. loop distribution systems comparison showing outage minutes and reliability.
By SANDIP R PATEL • November 6, 2026
Compare radial vs. loop distribution systems in the US. Explore reliability, underground cables, protection, voltage drop and design with Keentel Engineering.
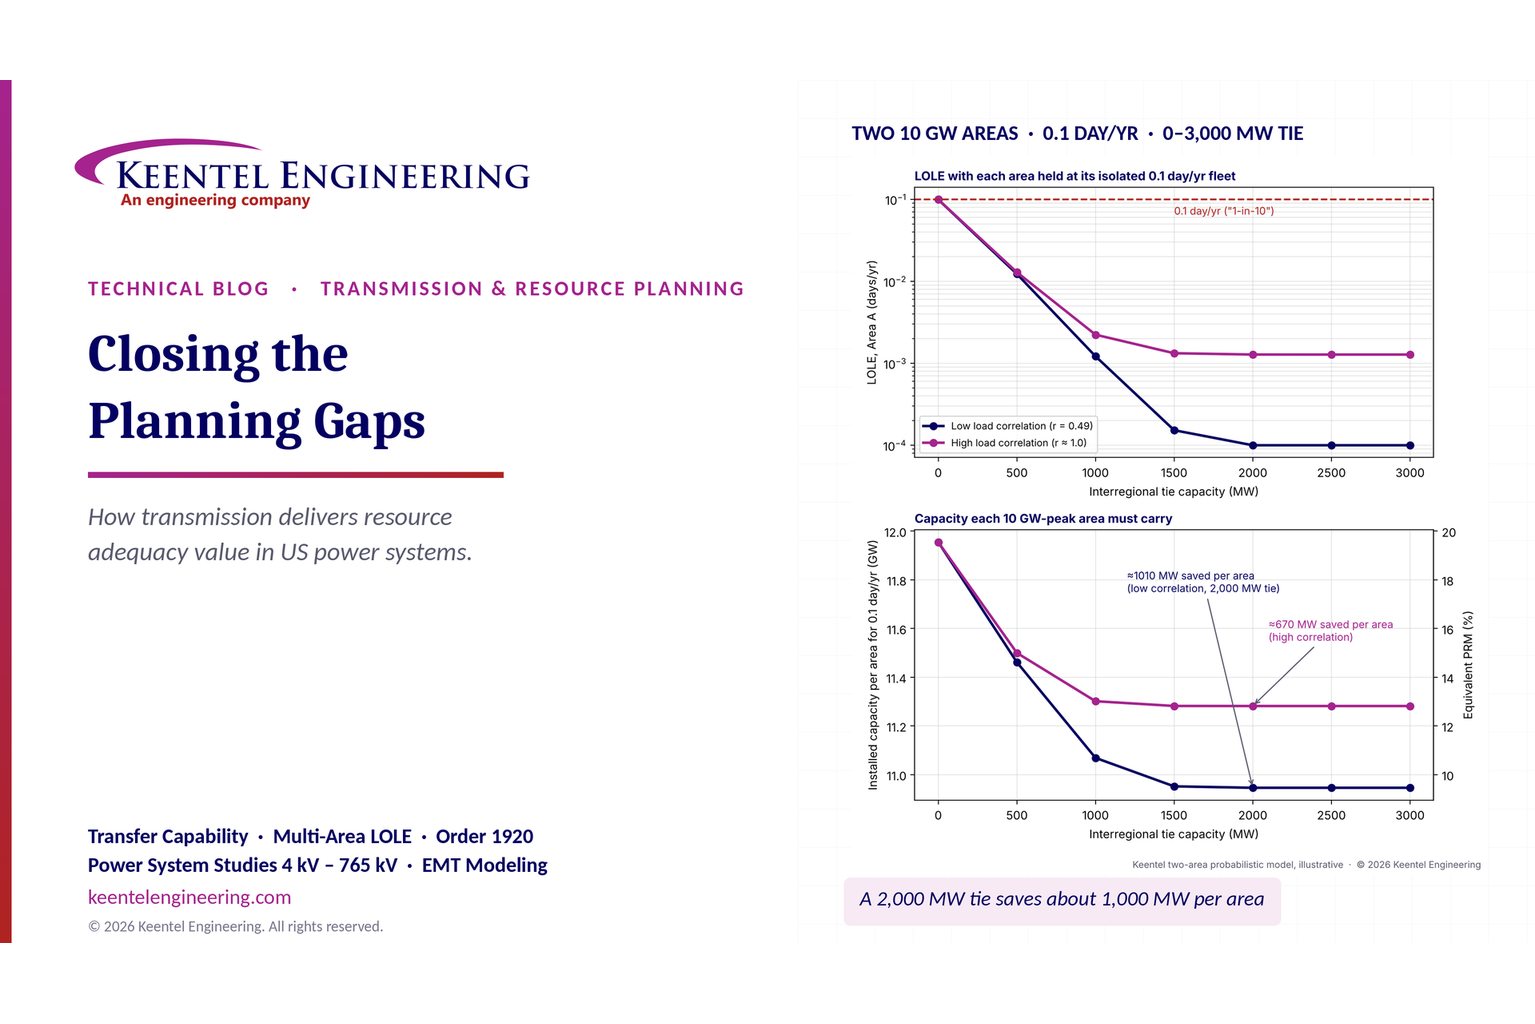
Transmission planning and resource adequacy analysis showing LOLE reduction and interregional transf
By SANDIP R PATEL • November 6, 2026
Learn how transmission planning improves US resource adequacy through LOLE, reserve sharing and FERC Order 1920 analysis from Keentel Engineering.
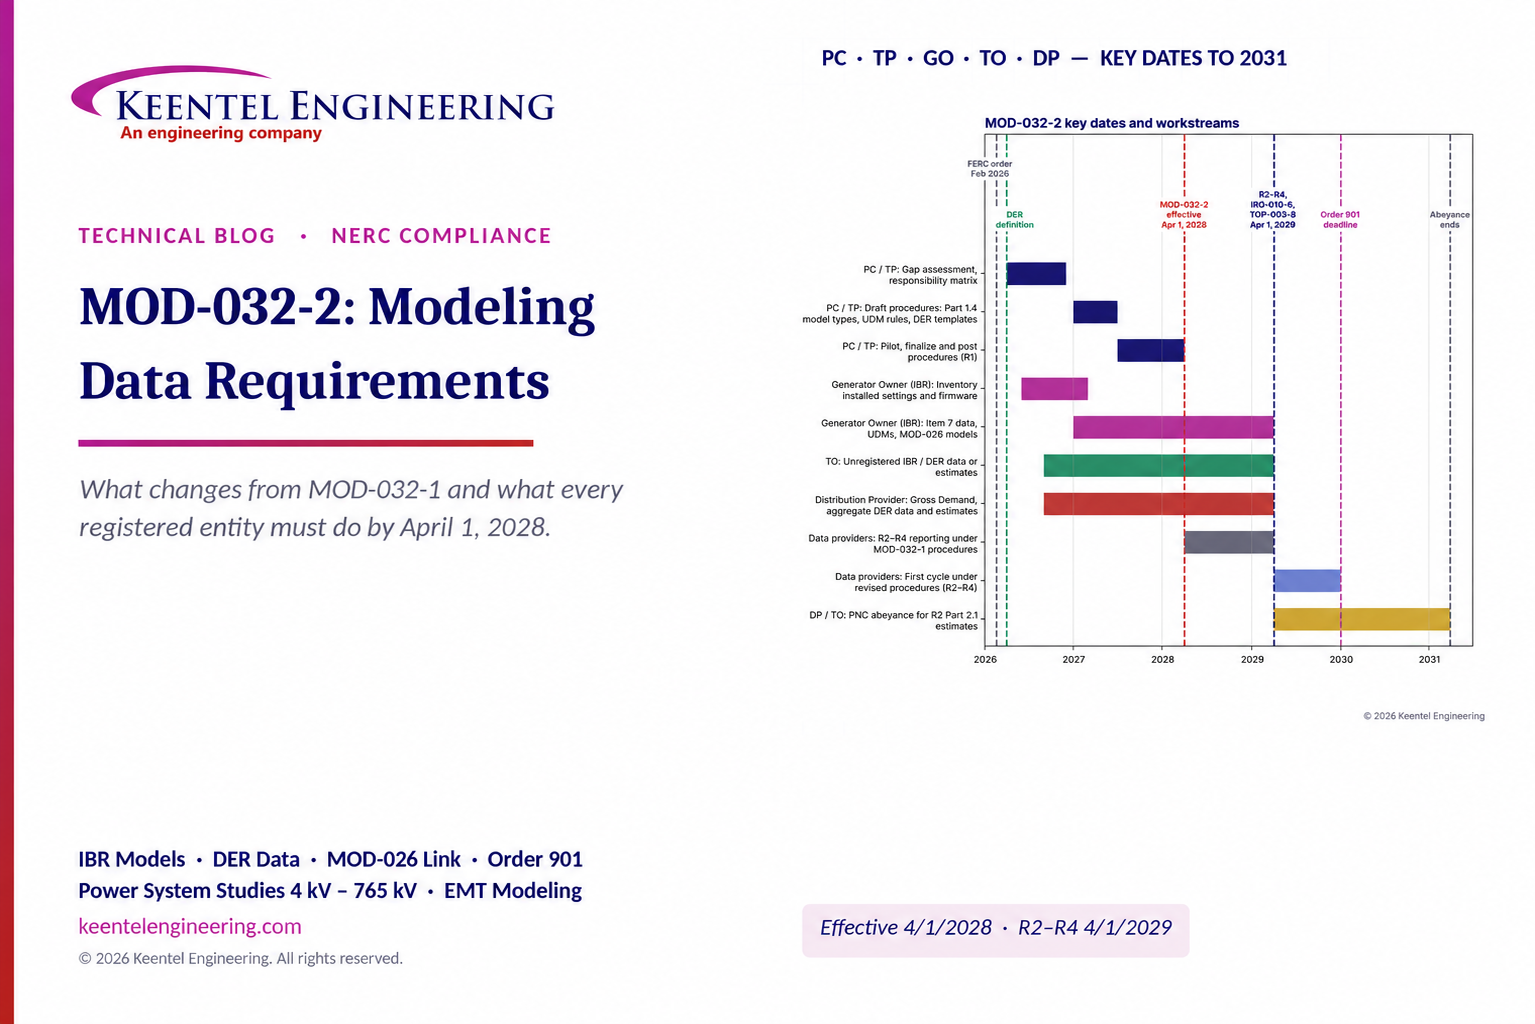
MOD-032-2 modeling data requirements and NERC compliance timeline through 2031.
By SANDIP R PATEL • November 6, 2026
Understand NERC MOD-032-2 requirements, key compliance dates, IBR modeling, DER data reporting and changes from MOD-032-1 with Keentel Engineering.
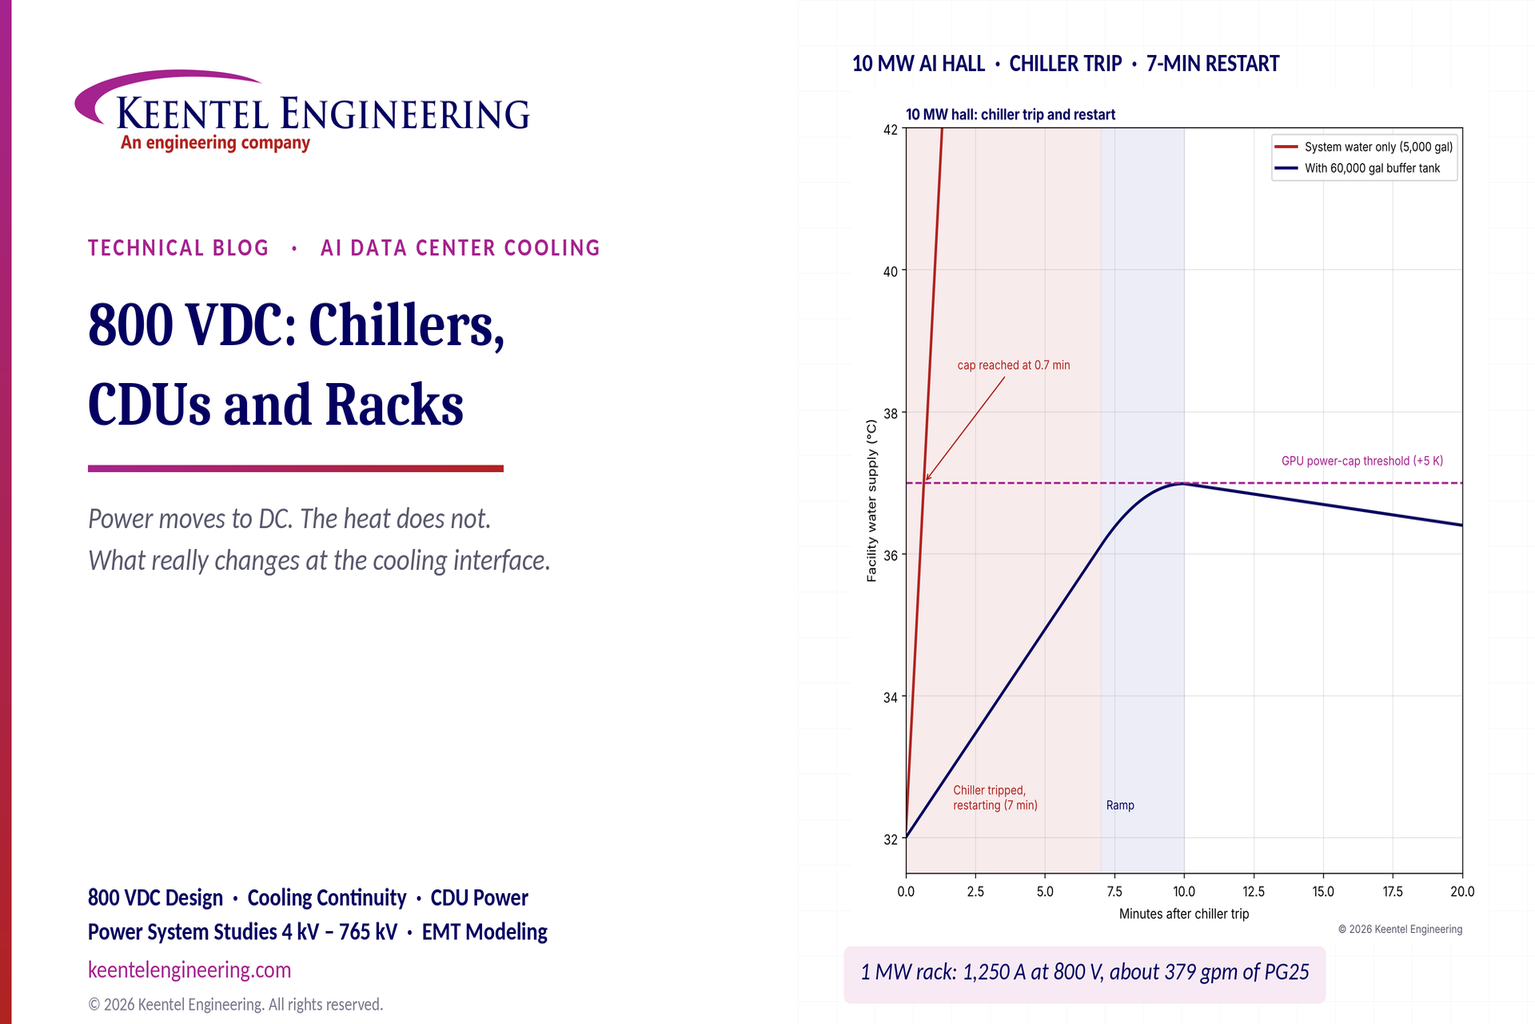
800 VDC AI data center cooling and chiller restart temperature comparison chart.
By SANDIP R PATEL • November 5, 2026
Learn how 800 VDC affects AI data center cooling, including chillers, CDUs, liquid-cooled racks, pump backup and DC safety. Keentel Engineering, USA.
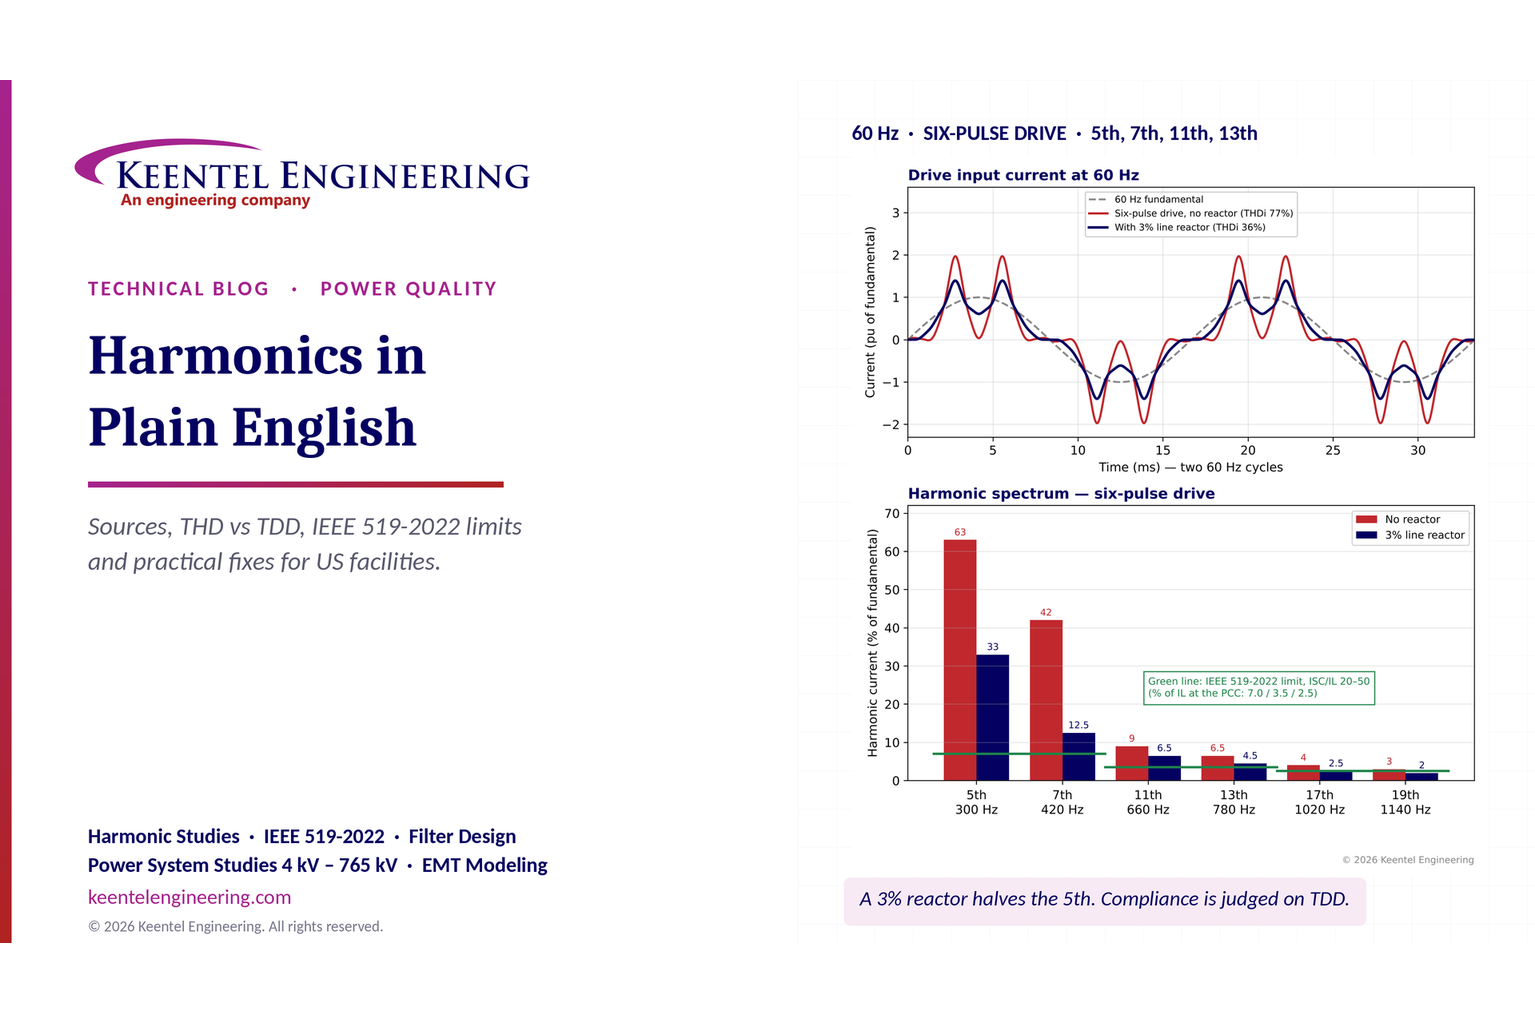
Keentel Engineering harmonics analysis showing current waveforms, harmonic spectrum, and IEEE 519-20
By SANDIP R PATEL • November 5, 2026
Understand electrical harmonics, THD vs TDD and IEEE 519-2022 limits. Keentel Engineering explains US harmonic studies, equipment risks and mitigation.