
A Coordinated Electric System Interconnection Review—the utility’s deep-dive on technical and cost impacts of your project.
Challenge: Frequent false tripping using conventional electromechanical relays
Solution: SEL-487E integration with multi-terminal differential protection and dynamic inrush restraint
Result: 90% reduction in false trips, saving over $250,000 in downtime
The three operating regions you have to design to
| Device | Output vs voltage | Response | Best suited to | Main limitations |
|---|---|---|---|---|
| Mechanically switched capacitor or reactor | Proportional to voltage squared | Seconds; discrete steps; limited switching operations per day | Steady-state reactive supply, voltage profile, loss reduction | No dynamic capability; step voltage change on switching; capability collapses when most needed |
| Static var compensator | Capacitive branches proportional to voltage squared | A few cycles; continuously controllable | Continuous control where cost matters and deep voltage support is not the driver | Square-law capability loss; harmonic filters are part of the plant and interact with the network |
| STATCOM | Approximately proportional to voltage — constant current capability | One to two cycles closed loop; converter response faster still | Voltage stability margin, weak interconnections, fast disturbance recovery, flicker and unbalance compensation | Higher capital cost; converter losses; adds a converter and its control dynamics to the network |
| Synchronous condenser | Governed by machine capability and excitation | Excitation response in the hundreds of milliseconds; inherent inertial response instantaneous | System strength and inertia, short-circuit contribution, black start support | Rotating plant with maintenance and losses; slower controlled response than a converter |
| STATCOM with energy storage | Reactive as a STATCOM, plus real power within the storage rating | As STATCOM for reactive; real power limited by storage | Where a real power deficiency is part of the problem | Cost and complexity of the storage; different failure and maintenance profile |
| Stage | Keentel scope | Outcome |
|---|---|---|
| Screening | Series-compensation proximity, radial contingency review, UIF and short-circuit ratio screening, frequency scans | Early identification of which SSO types apply |
| Detailed studies | PSCAD/EMTDC EMT studies with vendor real-code models, impedance-based and frequency-scan analysis | Clear evidence of stability margins or risk |
| Model quality | EMT model review, benchmarking against positive-sequence models, model acceptance support | Models that system operators accept |
| Mitigation | Control retuning recommendations with vendors, SSDC and bypass logic requirements, protection and monitoring specifications | Practical, coordinated solutions |
| Interconnection support | SSR and SSO study reports for ISO and utility requirements, response to reviewer comments | Fewer delays in the interconnection process |
Resilience: designing CDUs to the facility Tier objective
Liquid cooling makes heat removal more critical, not less. Cold plates hold only seconds of thermal buffer. If TCS flow stops, processors throttle or shut down very quickly. Resilience design must therefore cover:
- Pump redundancy: N+1 pumps at minimum, with automatic changeover.
- CDU redundancy: N+1 CDUs on a common TCS header, or 2N CDUs serving A and B manifolds for fault-tolerant designs.
- Power to CDUs: dual-corded CDUs fed from A and B sources, with pumps and controls on UPS power so coolant keeps flowing through a utility failure and generator start. This is the liquid-cooling equivalent of continuous cooling.
- Facility water continuity: chilled water or condenser water must also continue, through thermal storage, UPS-backed pumps or a high enough FWS temperature that the TCS can coast on stored thermal mass for the transfer period.
- Concurrent maintainability: isolation valves so any CDU, pump, filter or manifold section can be serviced without stopping the others.
- Leak management: leak detection, drip trays, automatic isolation valves and procedures for fluid spills.
Electrical engineering considerations
CDUs and liquid-cooling plants are electrical loads with their own design requirements:
- Pump motors and VFDs. Large CDUs use variable-frequency drives on their pump motors. These introduce harmonic current that must be included in the facility's harmonic study and IEEE 519 evaluation.
- Critical mechanical load on UPS. Putting CDU pumps on UPS increases UPS and battery sizing. The mechanical UPS load must be included in redundancy and ride-through calculations.
- Feeder and protection design. Dual feeds, automatic transfer, selective coordination and arc-flash labelling apply to CDU power distribution just as they do to IT power.
- Generator transient response. CDU pumps restarting together after a transfer create motor inrush on the generators. Staged restarts and soft acceleration reduce the step load.
- Load dynamics. AI training loads can swing rapidly between high and low power. Cooling controls must track those swings without temperature overshoot, and electrical systems must handle both the IT and the cooling load changes.
Commissioning a liquid-cooled data hall
- Flush and clean the TCS piping and manifolds to the specified cleanliness, using high-purity flush water.
- Fill and vent with the specified coolant, verifying glycol concentration and chemistry.
- Pressure test for leaks at design and test pressures, including quick-disconnect fittings.
- Verify sensors and controls: flow meters, temperature sensors, pressure transmitters, leak detection and BMS points.
- Load test with heat load banks connected through the cold-plate interfaces or rack manifolds, across the operating range.
- Prove the heat balance on both loops at several load steps, and the approach temperature against the design.
- Test failure scenarios: pump failure, CDU failure, power transfer to generator, valve failure and loss of facility water, confirming temperatures stay within the IT vendor's limits.
How Keentel Engineering helps
Keentel Engineering supports data center owners, developers and EPCs with the electrical engineering that liquid-cooled facilities depend on, and coordinates with the mechanical engineer of record and cooling vendors on the integrated design.
Grid Inertia, RoCoF and Frequency Response: An Engineering Guide for the US Power SystemNew Title
October 10, 2026 | Blog
Part A — Grid Inertia at a Glance
When a large generator trips, the power system loses supply instantly, but load keeps consuming. For the first moments, before any control system can react, the missing power comes from the kinetic energy stored in the rotating masses of synchronous generators and their turbines. As they give up that energy, they slow down, and system frequency falls. The amount of stored rotating energy, the system inertia, sets how fast frequency falls. Governors and other frequency-responsive resources then arrest the decline. Inertia buys time; primary frequency response uses it.
Same loss, half the inertia
Keentel Engineering modeled two 60 Hz systems, each serving 50 GW of load, with identical governors and load characteristics. The only difference is the stored rotating energy. Both lose 2,750 MW of generation, equal to ERCOT's resource loss criterion.
| Result | Grid A: 250 GW·s | Grid B: 125 GW·s |
|---|---|---|
| System inertia constant (on 50 GW) | H = 5.0 s | H = 2.5 s |
| Initial rate of change of frequency (RoCoF) | 0.33 Hz/s | 0.66 Hz/s |
| Time to reach 59.3 Hz at the initial RoCoF | ≈ 2.1 s | ≈ 1.1 s |
| Frequency nadir (lowest point) | ≈ 59.53 Hz at 2.7 s | ≈ 59.41 Hz at 1.7 s |
| Margin above a 59.3 Hz first UFLS stage | ≈ 0.23 Hz | ≈ 0.11 Hz |
| Settling frequency before AGC | ≈ 59.66 Hz | ≈ 59.66 Hz |
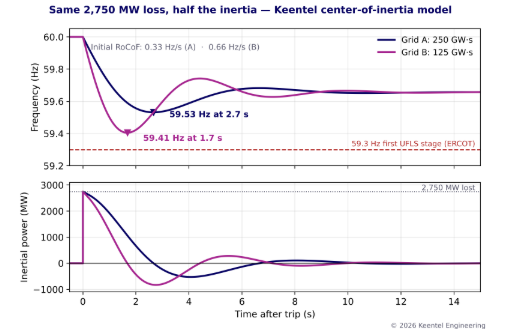
Figure 1. Frequency (top) and power supplied by rotating inertia (bottom) after the same 2,750 MW loss in two systems that differ only in inertia. Below zero, the rotors are absorbing energy as they speed back up.
What the comparison shows
- The initial RoCoF doubles exactly when inertia halves. At the instant of the trip it depends only on the lost power and the stored rotating energy.
- At t = 0, all of the missing power comes from inertia in both systems. Governors have not yet moved.
- The nadir is lower and arrives sooner with less inertia, because governors have less time to respond.
- The settling frequency is the same. It depends on governor droop and load sensitivity, not on inertia.
Inertia buys time. Governors use it. As inverter-based resources displace synchronous generation, the same trip produces a faster fall and leaves less time to stop it.
Part B — Grid Inertia, RoCoF and Frequency Response: An Engineering Guide for the US Power System
Frequency is the heartbeat of an interconnection. Every US interconnection — Eastern, Western, ERCOT and Québec — must keep frequency close to 60 Hz and arrest it quickly after the largest credible loss of generation. For most of the history of the grid, that was helped by massive synchronous machines whose rotating inertia slowed frequency decline automatically. Today, wind, solar and battery storage connect through inverters, and their share of online generation keeps growing. This guide explains what inertia is, how it determines the first seconds of a frequency event, how to calculate RoCoF, nadir and settling frequency, and what engineers can do as synchronous inertia declines.
What is inertia?
Every synchronous generator and its turbine form a heavy flywheel rotating in step with the grid. The kinetic energy stored in that rotor is commonly expressed by the inertia constant H, in seconds:
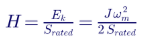
where Ek is the stored kinetic energy, J is the moment of inertia of the rotating mass, ωm is mechanical speed and S is the machine rating. H is the number of seconds the machine could supply its rated power from stored kinetic energy alone.
Typical inertia constants
| Machine type | Typical H (s, on machine MVA) |
|---|---|
| Large steam turbine-generator (nuclear, coal) | 3 to 6 |
| Combustion turbine | 4 to 9 |
| Combined-cycle steam turbine | 3 to 5 |
| Hydro generator | 2 to 4 |
| Synchronous condenser | 1 to 2, or 5 to 8 with an added flywheel |
| Wind turbine (Type 3 or Type 4, inverter-coupled) | No inherent synchronous inertia; synthetic response possible |
| Solar PV and battery storage (grid-following) | None |
System inertia
System stored energy is the sum over all online synchronous machines:
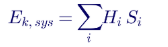
It is often reported in GW·s (equivalently, gigawatt-seconds or GJ). Because only online machines count, system inertia changes hour by hour with commitment and dispatch. Low-load, high-renewable hours, such as spring middays and windy nights, usually have the lowest inertia.
| Online unit (illustrative) | Rating (MVA) | H (s) | Stored energy (GW·s) |
|---|---|---|---|
| Nuclear unit | 1,350 | 4.0 | 5.40 |
| Coal unit | 800 | 3.5 | 2.80 |
| 2×1 combined cycle (two CTs at 250 MVA, one ST at 300 MVA) | 800 | — | 4.20 |
| Hydro unit | 150 | 3.0 | 0.45 |
| Synchronous condenser (no flywheel) | 250 | 1.5 | 0.38 |
| 300 MW solar plant | 330 | 0 | 0 |
| 200 MW grid-following battery | 220 | 0 | 0 |
The swing equation and initial RoCoF
The center-of-inertia form of the swing equation relates frequency change to the power imbalance:
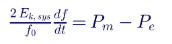
Immediately after a loss of ΔP, before any governor or load response, the initial RoCoF is:
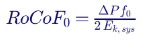
For Grid A: 2,750 MW × 60 Hz ÷ (2 × 250,000 MW·s) = 0.33 Hz/s. For Grid B, with half the stored energy, the result is exactly double: 0.66 Hz/s. This relationship is exact at t = 0 in the aggregate model, because no other term has yet changed.
How much power comes from inertia?
The power released by the rotating masses is proportional to the rate of frequency decline:
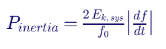
At t = 0, inertial power equals the full 2,750 MW in both systems. As governors and load relief begin to supply power, the RoCoF falls and inertial power declines. At the nadir, RoCoF is zero and inertia supplies nothing. After the nadir, frequency recovers and the rotors absorb energy as they speed back up, so inertial power briefly becomes negative.
A simple time buffer
Dividing the frequency margin by the initial RoCoF gives a conservative measure of how much time the system has:

With a 59.3 Hz first UFLS stage, Grid A has about 0.7 ÷ 0.33 ≈ 2.1 s and Grid B about 0.7 ÷ 0.66 ≈ 1.1 s. In reality frequency slows as response arrives, so the actual nadir is higher, but the comparison shows how quickly the available time shrinks.
Frequency nadir: where inertia and response meet
The nadir is the lowest frequency reached after the disturbance. It occurs when the combined response of governors, load relief and any fast frequency response equals the lost power. The nadir depends on:
- Inertia: how quickly frequency falls before response arrives.
- Response speed: governor and turbine time constants, deadbands and response delays.
- Response amount: headroom on units with active governors.
- Load relief: motor loads draw less power at lower frequency, typically about 1 to 2% of load per 1% frequency change.
- Fast frequency response: batteries, load resources and other resources that inject or shed power within a fraction of a second.
In Keentel's model, halving inertia moved the nadir from about 59.53 Hz to about 59.41 Hz and brought it a full second sooner. Further reductions bring the nadir to the UFLS threshold:
| System stored energy | Nadir without FFR | Nadir with 1,000 MW FFR (trigger 59.7 Hz, full output in 0.25 s) |
|---|---|---|
| 250 GW·s | ≈ 59.53 Hz at 2.7 s | ≈ 59.63 Hz |
| 125 GW·s | ≈ 59.41 Hz at 1.7 s | ≈ 59.55 Hz |
| 100 GW·s | ≈ 59.36 Hz at 1.5 s | ≈ 59.51 Hz |
| 80 GW·s | ≈ 59.30 Hz at 1.3 s | ≈ 59.47 Hz |
Even modest amounts of fast frequency response restore much of the nadir margin lost when inertia declines.
Settling frequency: governed by droop, not inertia
After the nadir, frequency settles at a level determined by the total frequency response characteristic of the interconnection, before automatic generation control (AGC) restores 60 Hz:
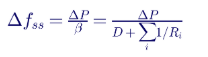
where β is the frequency response in MW/Hz, D is load damping and R is governor droop. In the model, β is about 8,300 MW/Hz, so the 2,750 MW loss settles about 0.33 Hz below nominal, near 59.67 Hz, in both systems. Inertia does not appear in this equation. It changes the path, not the destination.
NERC Reliability Standard BAL-003 sets a frequency response obligation for each balancing authority, expressed in MW per 0.1 Hz, to ensure the interconnection settles above under-frequency load shedding thresholds for its design-basis resource loss.
The US frequency protection framework
| Mechanism | Purpose | US reference |
|---|---|---|
| Primary frequency response | Governors and IBR controls arrest and stabilize frequency within seconds | NERC BAL-003; FERC Order No. 842 requires primary frequency response capability from new generators |
| Fast frequency response | Very fast power injection or load reduction, typically within 0.5 s or less | ERCOT FFR and Responsive Reserve products; NERC fast frequency response guidance |
| Under-frequency load shedding | Automatic load shedding in stages to prevent collapse | NERC PRC-006 and regional UFLS programs; ERCOT's first stage is 59.3 Hz |
| Generator and IBR ride-through | Keep resources online during frequency excursions and high RoCoF | NERC PRC-024, PRC-029; IEEE 2800-2022 for transmission-connected IBRs; IEEE 1547-2018 for DERs |
| AGC | Restores frequency and scheduled interchange over minutes | NERC BAL-001 |
RoCoF and ride-through
High RoCoF creates problems beyond the nadir. Older RoCoF-based anti-islanding relays (device 81R) at distributed generation can trip unnecessarily, removing more generation. IEEE 2800-2022 requires transmission-connected inverter-based resources to ride through RoCoF values up to 5 Hz/s, and IEEE 1547-2018 specifies RoCoF ride-through capability by DER performance category. Ride-through settings must be coordinated so the resources the grid depends on do not trip during the very event they are meant to help.
Why it matters now
Inverters do not add synchronous inertia
Wind, solar and battery storage connect through power electronic inverters. Most operate in grid-following mode: they synchronize to the measured grid voltage with a phase-locked loop and inject controlled current. They have no rotating mass coupled to the grid and provide no inherent inertia. As inverter-based output displaces synchronous units, the same trip produces a faster frequency fall.
Smaller interconnections feel it first
The Eastern Interconnection has very high inertia because of its size. ERCOT, a smaller interconnection with limited DC ties and very high wind and solar penetration, is more sensitive. ERCOT monitors system inertia in real time and has identified a critical inertia level, roughly 100 GW·s, below which existing reserves may not prevent UFLS for its resource loss criterion. It has responded with fast frequency response products, load resources and procurement changes.
Options for replacing synchronous inertia
| Option | What it provides | Engineering considerations |
|---|---|---|
| Keep synchronous units online | Inertia, short-circuit strength, voltage support | Cost of must-run commitments and emissions |
| Synchronous condensers | Inertia and short-circuit strength without fuel | New units or converted retired generators; added flywheels increase inertia |
| Grid-forming inverters | Voltage-source behavior, fast inherent response, synthetic inertia | Current and energy limits; IEEE 2800 and emerging ISO/RTO grid-forming requirements; EMT studies required |
| Fast frequency response from batteries | Very fast active power injection | Trigger settings, response time, sustained duration, state-of-charge management |
| Load resources | Very fast load reduction on under-frequency relays | Customer participation and verification |
| Synthetic inertia from wind turbines | Short-term power boost from rotor kinetic energy | Recovery period reduces output after the event |
| Faster primary frequency response | Faster governor and IBR droop response | Headroom, deadband settings and verification under BAL-003 |
How much does each option help?
The scale of each option matters. Three 350 MVA synchronous condensers with flywheels at H ≈ 6 s add about 6.3 GW·s, a 5% increase on a 125 GW·s system. A 200 MVA grid-forming battery emulating H = 8 s provides inertial power proportional to RoCoF:
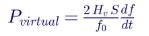
At 0.66 Hz/s, that is about 2 × 8 × 200 ÷ 60 × 0.66 ≈ 35 MW. The same battery delivering fast frequency response could provide its full 200 MW within a fraction of a second. In practice, the most effective solutions combine inertia, grid-forming behavior and fast frequency response, selected through studies of the specific system.
Studying frequency performance
Frequency studies combine several tools:
- Aggregate frequency models: center-of-inertia models, like the one in this article, give quick insight into RoCoF, nadir and reserve needs.
- Positive-sequence dynamic simulation: PSS®E or PSLF simulations with detailed generator, governor, IBR (WECC REGC/REEC/REPC) and load models.
- EMT studies: PSCAD studies verify grid-forming behavior, inverter current limits and protection performance during high-RoCoF events.
- Real-time inertia monitoring: operators track online stored energy and compare it with critical levels.
- Event analysis: PMU and DFR data from actual disturbances validate models and settings.
On its own, inertia does not change where primary response settles frequency. It changes how fast frequency falls and how much time every other resource has to stop it.
How Keentel Engineering helps
Keentel Engineering provides frequency, stability and
interconnection studies for utilities, ISOs and RTOs, independent power producers and large loads, from 4 kV to 765 kV.
| Stage | Keentel scope | Outcome |
|---|---|---|
| Frequency response studies | Aggregate and detailed dynamic studies of RoCoF, nadir and settling frequency; BAL-003 support | Clear understanding of system frequency risk |
| Grid-forming and FFR projects | BESS sizing, control settings, FFR qualification studies and EMT modeling | Batteries that meet market and grid requirements |
| Synchronous condenser projects | Feasibility, sizing, generator conversion studies and interconnection | Added inertia and system strength where it is needed |
| Interconnection studies | PSS®E and PSCAD studies for solar, wind and storage at 115 kV to 345 kV | Faster, more reliable interconnection approvals |
| Ride-through and protection | PRC-024, PRC-029, IEEE 2800 and IEEE 1547 ride-through assessments; UFLS and RoCoF relay coordination | Resources that stay online when the grid needs them |
| Microgrids and large loads | Islanded frequency studies for data centers and industrial campuses | Stable operation during load steps and islanding |
Why clients choose Keentel Engineering
- Deep power system expertise: stability, frequency, EMT and protection studies delivered by experienced power system engineers.
- From studies to design: one team covers dynamic studies, substation and transmission design, and commissioning support.
- NERC compliance experience: practical support for BAL, PRC and MOD standards.
- Licensed professional engineering: a Florida-registered firm with offices in Tampa, Austin, Sacramento and Baltimore, supporting projects nationwide.
- Independent advice: recommendations based on system needs, not on a single technology or vendor.
Planning a battery, synchronous condenser or large load in a low-inertia area? Talk to Keentel Engineering at (813) 389-7871, contact@keentelengineering.com, or book a 15-minute scoping call at calendly.com/keentel-engineering/15min.
Part C — Case Studies
The following are illustrative scenarios based on conditions typical of US power systems. They show how Keentel Engineering approaches inertia and frequency response problems; site details are generalised and figures are rounded.
Case Study 1 — 300 MW battery at 345 kV: qualifying for fast frequency response
Situation. A developer plans a 300 MW / 600 MWh battery connected at 345 kV in a high-renewable region and wants it to qualify for fast frequency response and responsive reserve products.
Analysis. Keentel models the plant's frequency measurement, trigger logic, response time and ride-through behavior. EMT simulations show that the original control settings would reach full output too slowly at the plant's point of interconnection, and that a protective RoCoF setting would trip the plant during severe low-inertia events.
Engineered solution. Keentel recommends revised frequency measurement filtering, faster power ramp settings and RoCoF ride-through settings consistent with IEEE 2800-2022. A state-of-charge strategy reserves energy for the required response duration.
Outcome. The plant meets the response-time requirement in simulation and testing and remains online for RoCoF events well beyond credible system values.
Case Study 2 — 230 kV system: converting a retiring coal unit to a synchronous condenser
Situation. A utility is retiring a coal unit at a 230 kV plant in an area with growing solar and wind generation. Studies show that the retirement would reduce local inertia and short-circuit strength, increasing RoCoF and creating weak-grid concerns for nearby inverter-based plants.
Analysis. Keentel evaluates three options: a new synchronous condenser, conversion of the existing generator to a synchronous condenser, and grid-forming batteries. Dynamic and short-circuit studies compare inertia, system strength, voltage support and cost.
Engineered solution. Conversion of the existing generator, with a clutch to decouple the turbine and a starting system, provides inertia and short-circuit strength using existing interconnection facilities. A grid-forming battery is recommended as a later complement.
Outcome. Local system strength is maintained after the retirement, nearby inverter-based plants meet stability criteria, and the utility reuses its existing 230 kV interconnection.
Case Study 3 — data center campus at 13.8 kV: islanded frequency stability
Situation. A data center campus with on-site gas generation at 13.8 kV plans to operate in island mode during grid outages. AI training workloads can change campus load by tens of megawatts in seconds.
Analysis. Keentel's islanded dynamic study shows that the small on-site generator fleet has limited inertia. Large load steps produce high RoCoF and frequency deviations that could trip generators on under-frequency protection or disrupt sensitive IT equipment.
Engineered solution. A grid-forming battery is added to supply fast power during load steps, with coordinated load ramp limits in the facility controls and revised generator protection and UFLS settings for island operation.
Outcome. The campus maintains frequency within its design limits during the largest credible load steps, and the generators remain online during island operation.
Part D — Technical FAQ: Grid Inertia, RoCoF and Frequency Response
Inertia is the kinetic energy stored in the rotating masses of synchronous generators and motors connected to the grid. When supply and demand become unbalanced, this energy is released or absorbed automatically, slowing the rate of frequency change.
H is the stored kinetic energy divided by the machine rating, in seconds. It represents how long the machine could supply rated power from stored rotational energy alone. Typical values for large generators are 2 to 9 seconds.
RoCoF is the rate of change of frequency, in Hz per second. Immediately after a generation loss, it equals the lost power times nominal frequency divided by twice the system stored energy.
At the moment of the trip, the same lost power must come entirely from stored rotating energy. With half the stored energy, the machines must slow down twice as fast to deliver the same power.
No. Settling frequency depends on governor droop, load damping and other frequency-responsive resources. Inertia changes how fast frequency falls and how low it goes, not where it settles.
The nadir is the lowest frequency reached after a disturbance, occurring when frequency-responsive resources have increased output enough to balance the lost power. It must remain above the first under-frequency load shedding stage.
Inertia, the speed and amount of primary frequency response, load damping, governor deadbands and any fast frequency response. Lower inertia or slower response produces a lower nadir.
UFLS automatically disconnects blocks of load in stages when frequency falls below set thresholds, preventing a frequency collapse. It is governed by NERC PRC-006 and regional programs. ERCOT's first stage is 59.3 Hz.
They connect through inverters and, in grid-following mode, have no rotating mass synchronized to the grid. They can respond quickly through controls, but they do not inherently release stored rotational energy.
A grid-forming inverter behaves as a controlled voltage source, setting its own voltage and frequency reference rather than following the grid. It can respond inherently to frequency and voltage changes, provide synthetic inertia and support weak or islanded systems, within its current and energy limits.
Fast frequency response is very fast active power injection or load reduction, typically within 0.5 seconds of a frequency trigger. Batteries and load resources are common providers.
Synthetic inertia provides power proportional to RoCoF, which is often modest for a single plant. Fast frequency response can deliver full rated power within a fraction of a second, which can have a larger effect on the nadir.
A synchronous condenser is a synchronous machine running without a prime mover. It provides inertia, short-circuit strength and reactive power. Retired generators can sometimes be converted to synchronous condensers.
BAL-003 sets frequency response obligations for balancing authorities, expressed in MW per 0.1 Hz, so that each interconnection can arrest and stabilize frequency after its design-basis resource loss.
It requires newly interconnecting generators, including inverter-based resources, to have primary frequency response capability with specified droop and deadband settings as part of their interconnection agreements.
IEEE 2800-2022 requires transmission-connected inverter-based resources to ride through RoCoF up to 5 Hz/s. IEEE 1547-2018 specifies RoCoF ride-through values for distributed resources by performance category.
ERCOT is a relatively small interconnection with limited DC ties and high wind and solar penetration. Its inertia can fall to low levels during high-renewable, low-load hours, so it monitors inertia in real time and procures fast frequency response.
Operators estimate online stored energy from the commitment status and inertia constants of synchronous units, and some systems use measurement-based estimation from PMU data. The result is compared with critical inertia thresholds.
Yes. Islanded microgrids usually have small generator fleets with limited inertia. Large, fast load changes can cause high RoCoF and frequency deviations, which grid-forming batteries and coordinated controls can mitigate.
Aggregate center-of-inertia models, PSS®E or PSLF dynamic studies, PSCAD EMT studies and event analysis using PMU and DFR data. Together they evaluate RoCoF, nadir, settling frequency and resource ride-through.
References and Further Reading
Links were current at publication (October 2026).
- NERC Reliability Standard BAL-003, Frequency Response and Frequency Bias Setting. North American Electric Reliability Corporation.
- NERC Reliability Standard PRC-006, Automatic Underfrequency Load Shedding; PRC-024 and PRC-029, Frequency and Voltage Ride-through. North American Electric Reliability Corporation.
- NERC Reliability Guideline, Fast Frequency Response Concepts and Bulk Power System Reliability Needs. North American Electric Reliability Corporation.
- FERC Order No. 842, Essential Reliability Services and the Evolving Bulk-Power System — Primary Frequency Response. Federal Energy Regulatory Commission.
- IEEE Std 2800-2022 and IEEE Std 1547-2018. IEEE.
- P. Kundur, Power System Stability and Control. McGraw-Hill.
Disclaimer
This article is general technical information for educational purposes. It is not engineering advice for any specific project and does not create a professional relationship. The frequency results are from Keentel Engineering's simplified center-of-inertia model with illustrative parameters, not field data; actual system performance depends on detailed generator, governor, inverter, load and protection models. UFLS settings, reserve products and requirements differ by region and change over time. Project designs must follow current standards, ISO/RTO and transmission provider requirements and project-specific engineering analysis, sealed by a licensed professional engineer where required.
Case studies are illustrative scenarios based on typical project conditions, not records of specific client projects. Figures are rounded and indicative.
NERC, FERC, ERCOT, IEEE, PSS®E, PSLF, PSCAD™ and other names are the property of their respective owners. Keentel Engineering is not affiliated with or endorsed by these organisations or any software or equipment vendor.
| Office | Address | Phone |
|---|---|---|
| Head Office — Tampa | 400 N Ashley Dr STE #2600, Tampa FL 33602 | (813) 389-7871 |
| Austin | 5900 Balcones Drive STE 100, Austin TX 78731 | (512) 591-0752 |
| Sacramento | 1401 21st St Ste R, Sacramento CA 95811 | (916) 913-4524 |
| Baltimore | 306 W Redwood St STE 200, Baltimore MD 21201 | (410) 225-2181 |
contact@keentelengineering.com · keentelengineering.com · calendly.com/keentel-engineering/15min
State of Florida — Registry No. 36853, KEENTEL LLC, DBA: KEENTEL ENGINEERING
Copyright 1995–2026 Keentel Engineering. All Rights Reserved.

About the Author:
Sandip "Sonny" R. Patel, P.E.
IEEE Senior Member · Founder & CEO, Keentel Engineering
In 1995, Sonny Patel earned his Electrical Engineering degree from the University of Illinois. But degrees don't build legacies — action does.
For three decades, he has worked the power industry from every side of the table: 16 years as a utility engineer at Exelon/Commonwealth Edison; generation leadership across hydroelectric, industrial steam turbine, and a 9 GW renewable fleet; NERC Regional Entity Senior Compliance Engineer and Audit Team Lead, auditing some of the nation's largest utilities; and testing and commissioning lead on equipment up to 765 kV — the very top of the North American grid.Utility. Generator. Regulator. Consultant. Few engineers have seen all four seats. Fewer still have sat in them.
His experience spans nuclear, hydro, conventional generation, renewables, oil and gas, mining — and today's data centers, where he is authoring a three-book series on data center design. He is a Licensed Professional Engineer in six states and a Licensed Electrical Contractor in Florida (Unlimited EC) — he doesn't just design the work; he's qualified to stand behind its execution.Today, as Founder and CEO of Keentel Engineering, Sonny leads a nationwide team of engineers delivering substation design, power system studies, NERC compliance, and commissioning — done right, coast to coast.Three decades. Every side of the table. One standard: accountable engineering.
Services

Let's Discuss Your Project
Let's book a call to discuss your electrical engineering project that we can help you with.
About the Author:
Sandip "Sonny" R. Patel, P.E.
IEEE Senior Member · Founder & CEO, Keentel Engineering
In 1995, Sonny Patel earned his Electrical Engineering degree from the University of Illinois. But degrees don't build legacies — action does.
For three decades, he has worked the power industry from every side of the table: 16 years as a utility engineer at Exelon/Commonwealth Edison; generation leadership across hydroelectric, industrial steam turbine, and a 9 GW renewable fleet; NERC Regional Entity Senior Compliance Engineer and Audit Team Lead, auditing some of the nation's largest utilities; and testing and commissioning lead on equipment up to 765 kV — the very top of the North American grid.
Utility. Generator. Regulator. Consultant. Few engineers have seen all four seats. Fewer still have sat in them.
His experience spans nuclear, hydro, conventional generation, renewables, oil and gas, mining — and today's data centers, where he is authoring a three-book series on data center design. He is a Licensed Professional Engineer in six states and a Licensed Electrical Contractor in Florida (Unlimited EC) — he doesn't just design the work; he's qualified to stand behind its execution.
Today, as Founder and CEO of Keentel Engineering, Sonny leads a nationwide team of engineers delivering substation design, power system studies, NERC compliance, and commissioning — done right, coast to coast.Three decades. Every side of the table. One standard: accountable engineering.
Leave a Comment
Thank you for contacting us.
We will get back to you as soon as possible.
We will get back to you as soon as possible.
Oops, there was an error sending your message.
Please try again later.
Please try again later.
Related Posts
By SANDIP R PATEL
•
October 11, 2026
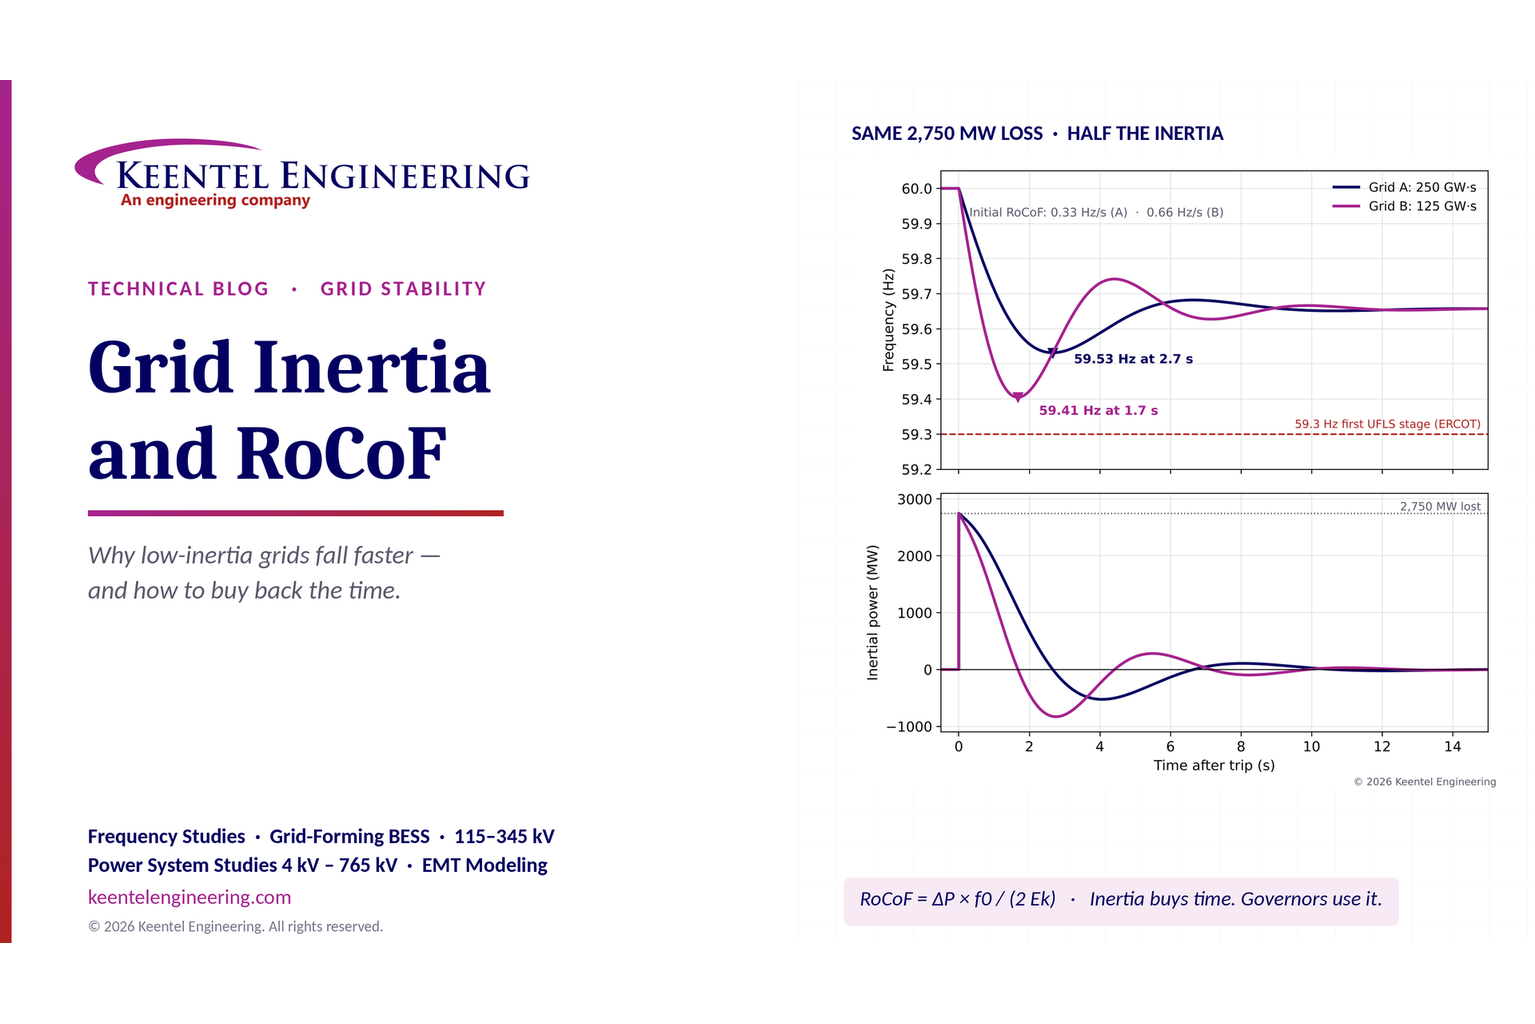
Explore grid inertia, RoCoF and frequency response, with swing equation calculations, frequency nadir analysis and US power system simulation examples.
By SANDIP R PATEL
•
October 10, 2026
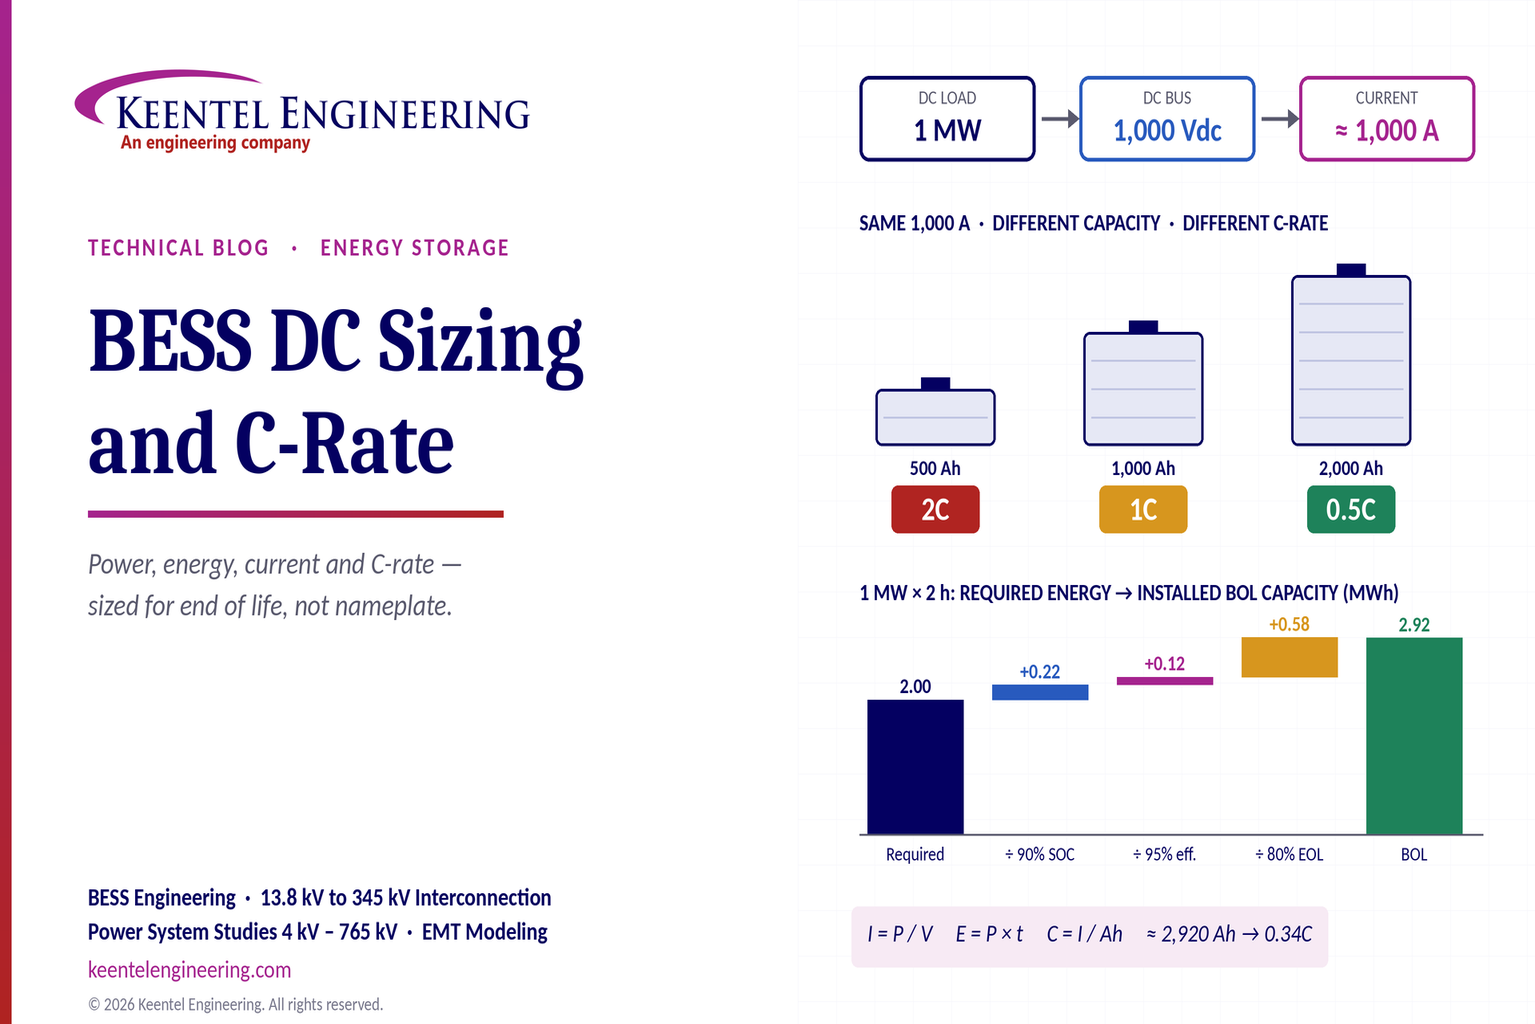
Learn BESS DC sizing with power, energy, current and C-rate calculations, battery losses, degradation and a 100 MW/400 MWh utility-scale example.
By SANDIP R PATEL
•
October 10, 2026
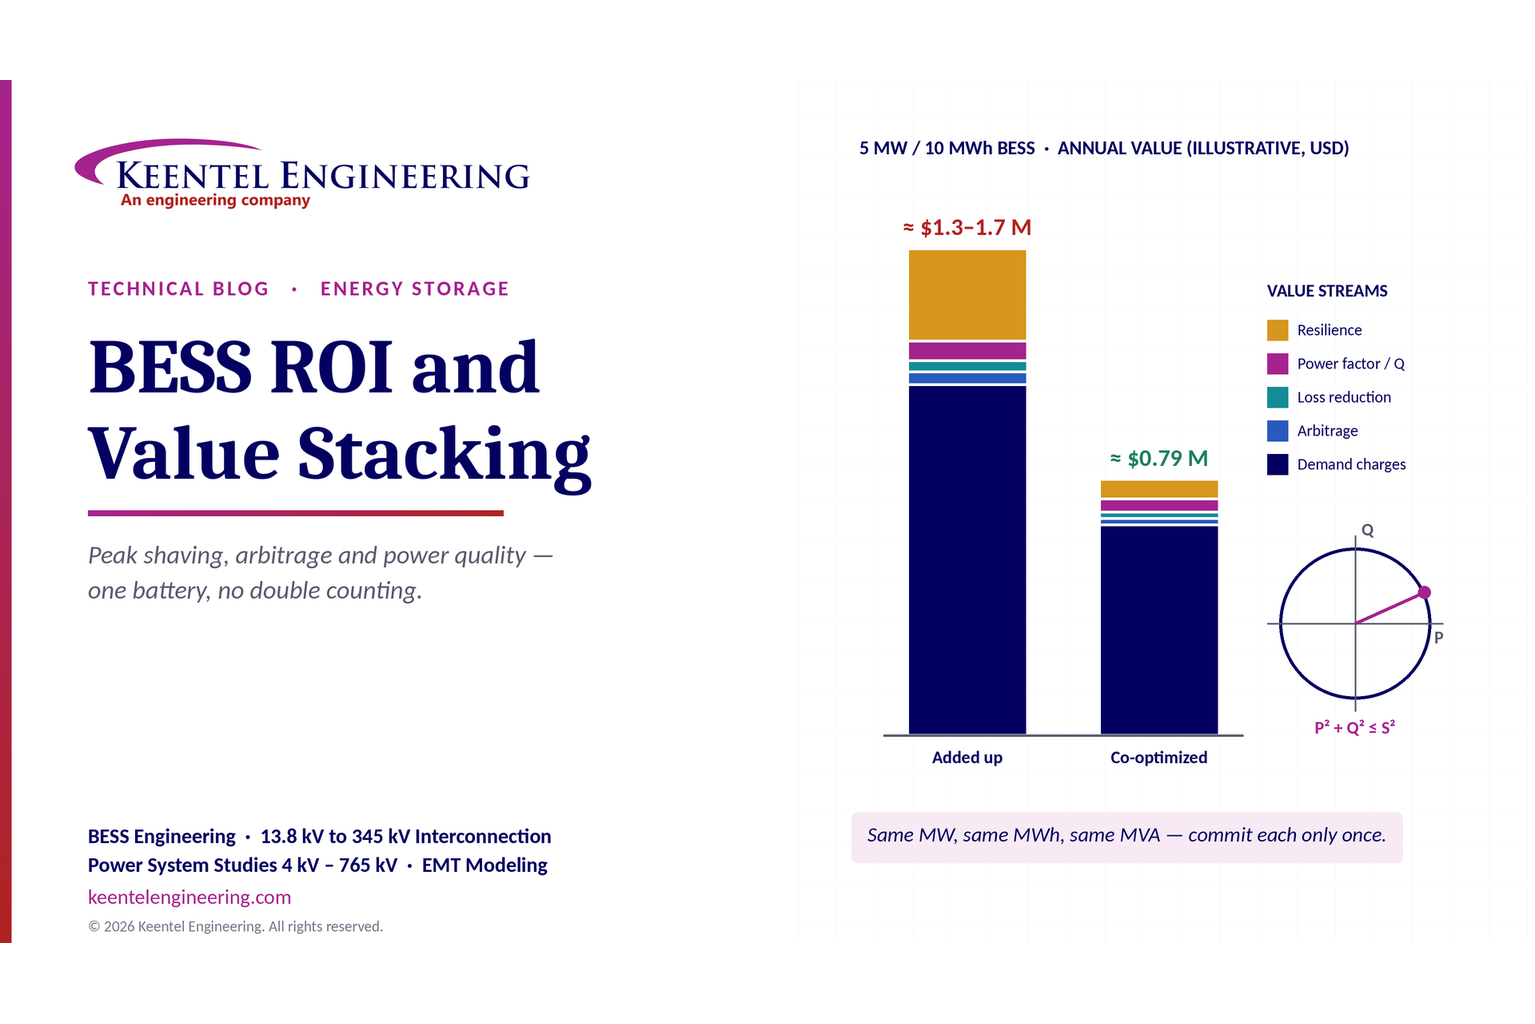
Learn how BESS ROI is calculated using peak shaving, energy arbitrage, power quality and battery storage economics, with a practical 5 MW/10 MWh example.
By SANDIP R PATEL
•
October 10, 2026
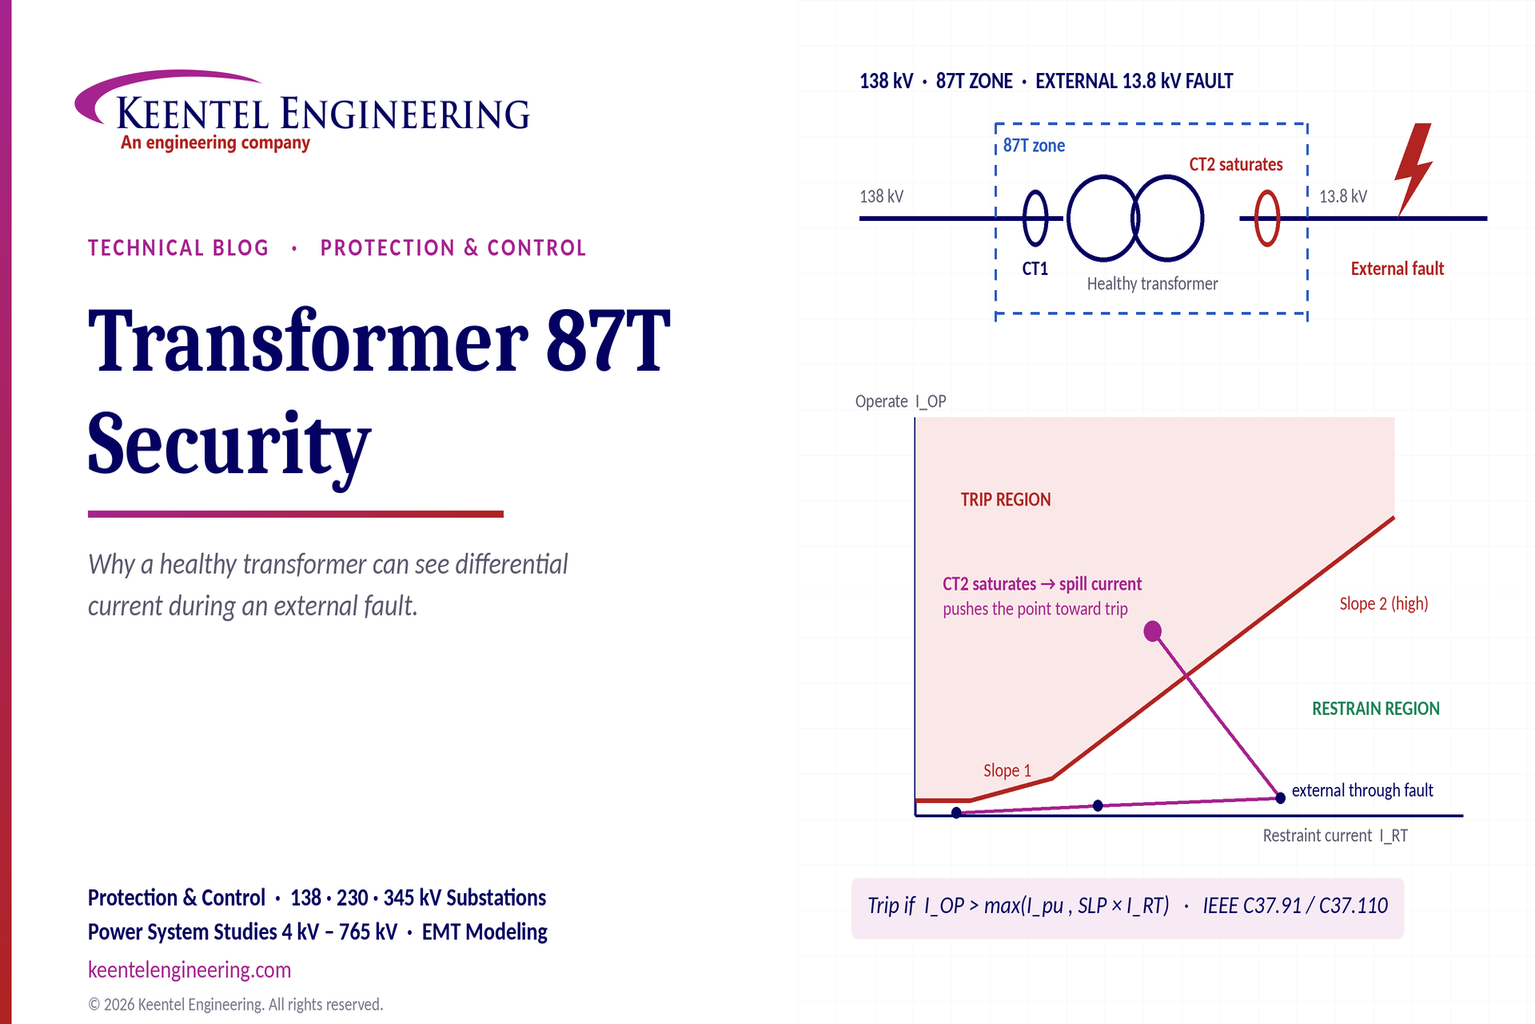
Learn why transformer differential relays detect current during external faults, how CT saturation causes spill current, and how secure 87T protection prevents trips.
By SANDIP R PATEL
•
October 10, 2026
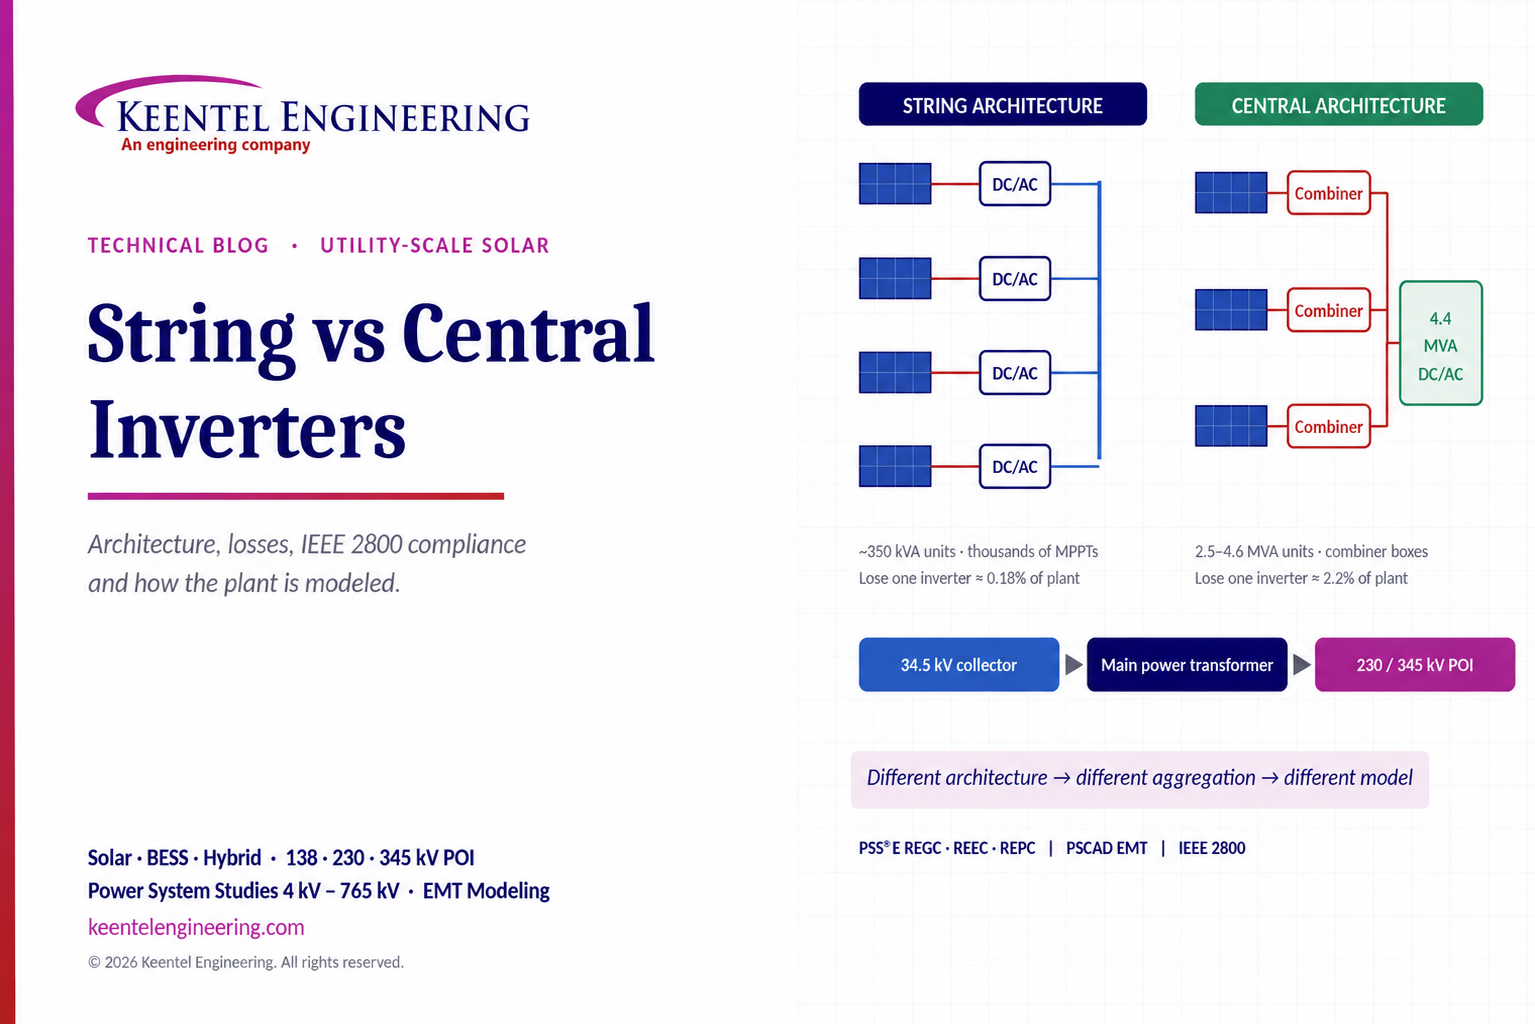
Compare string vs central inverters for utility-scale solar, including efficiency, maintenance, grid compliance, reactive power and interconnection studies.
By SANDIP R PATEL
•
October 9, 2026
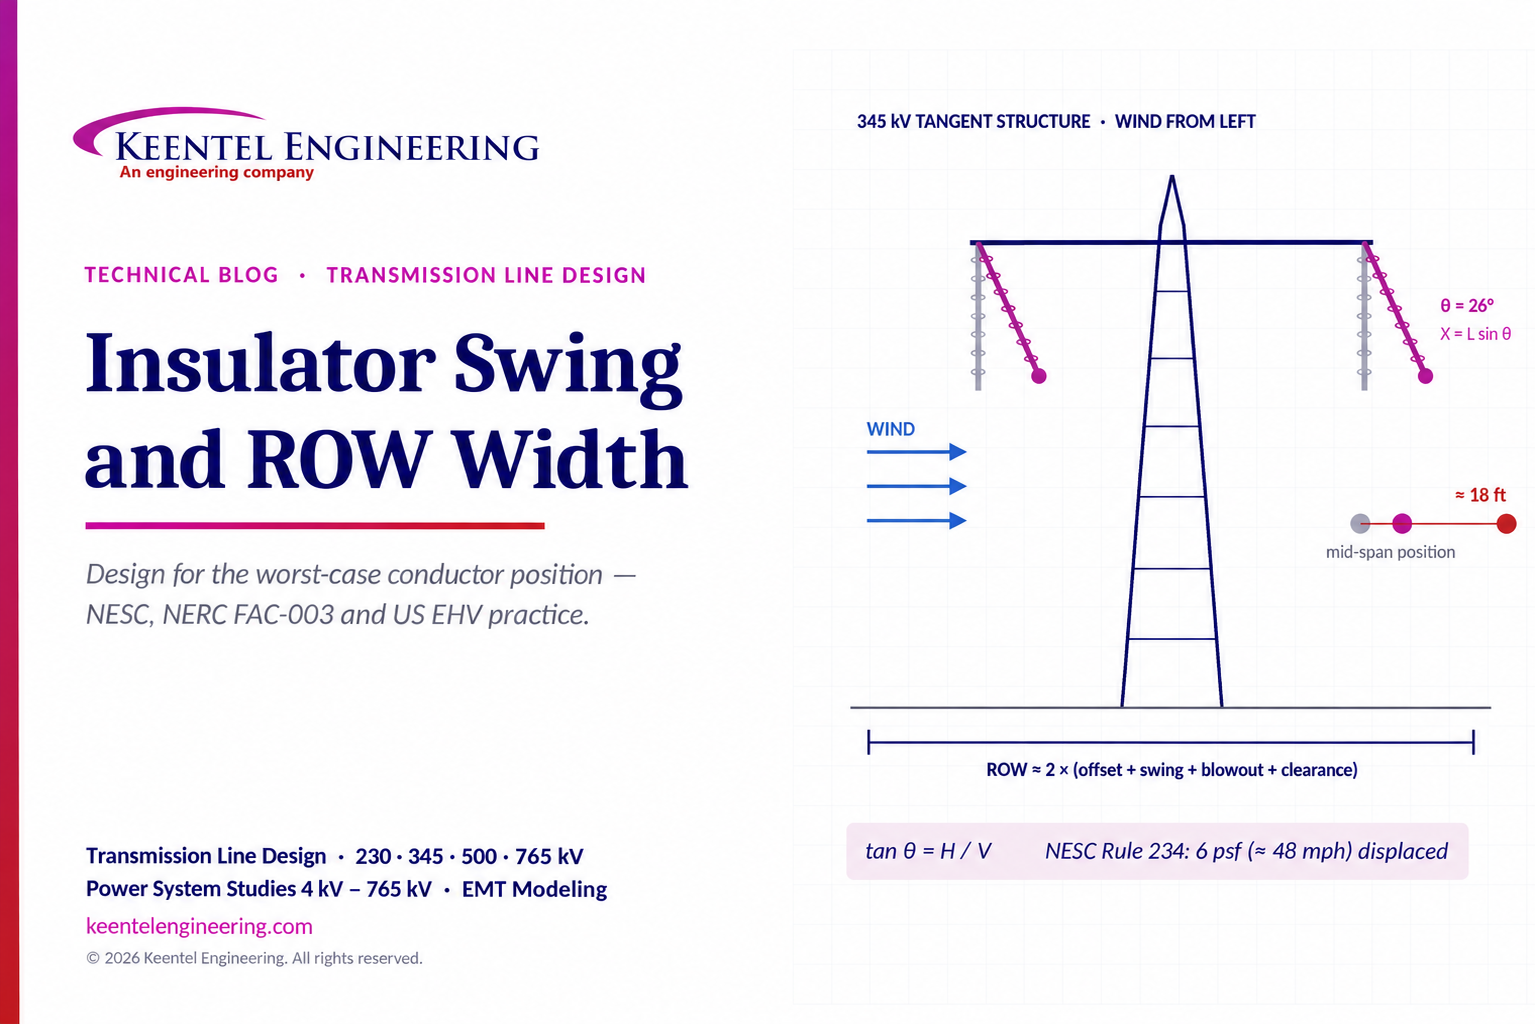
Learn how insulator swing angle and conductor blowout affect transmission line ROW width, with NESC clearances, NERC FAC-003 guidance, and a 345 kV example.
Copy
By SANDIP R PATEL
•
October 3, 2026
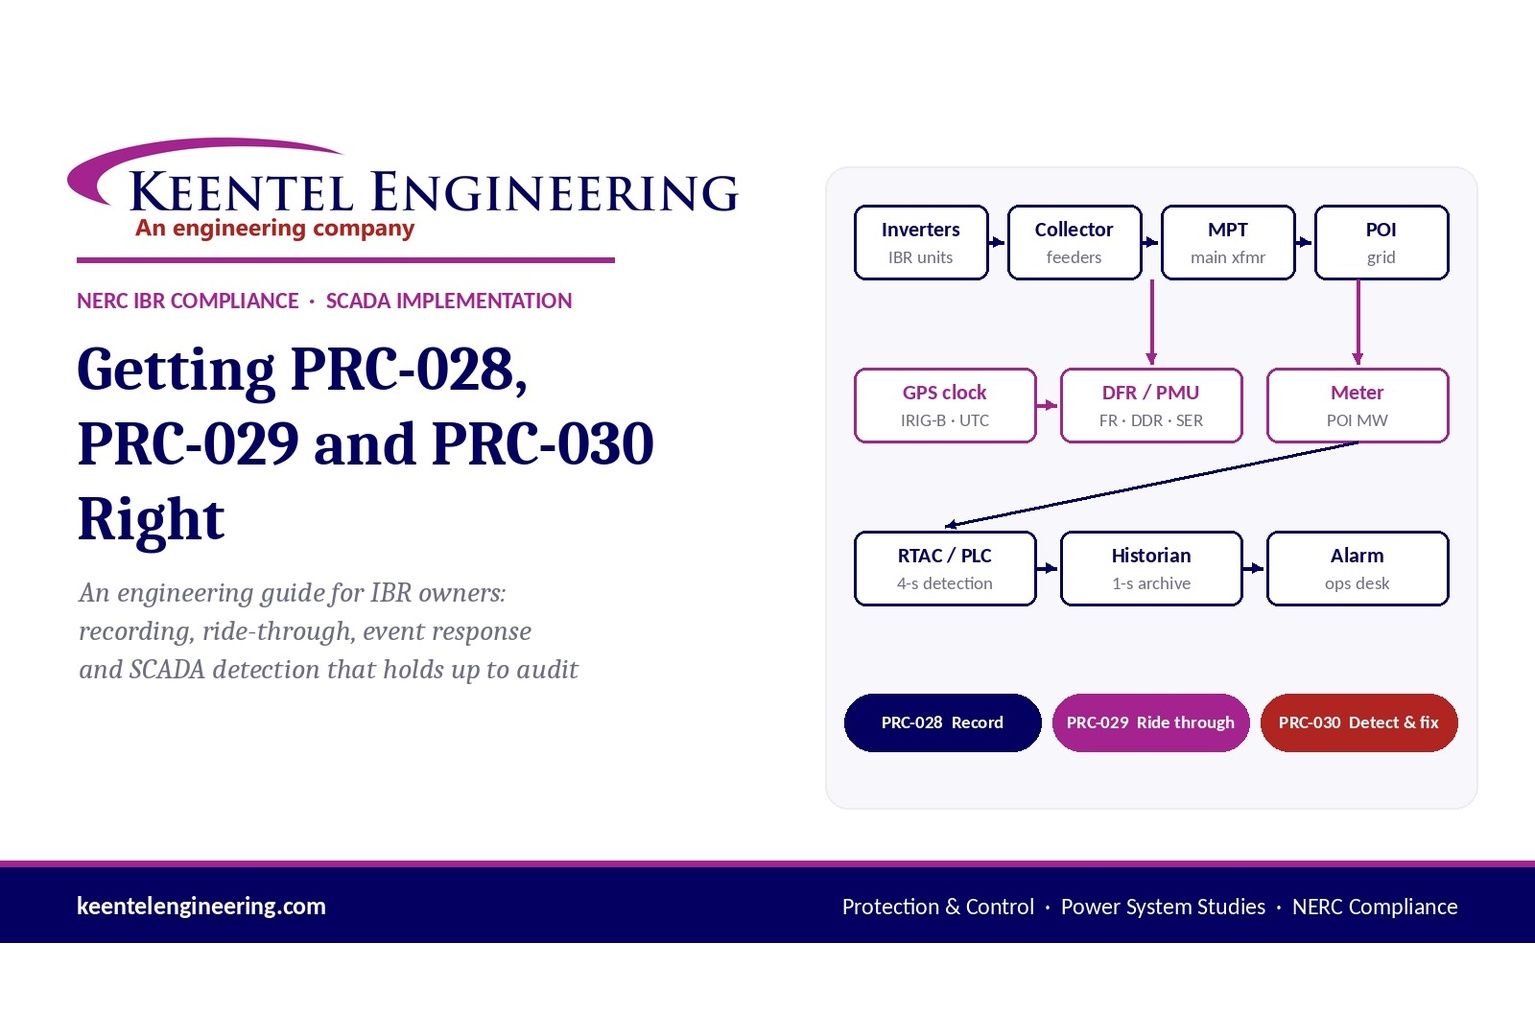
Engineering guide to PRC-028 disturbance recording, PRC-029 ride-through and PRC-030 event detection for inverter-based resources.
By SANDIP R PATEL
•
October 3, 2026
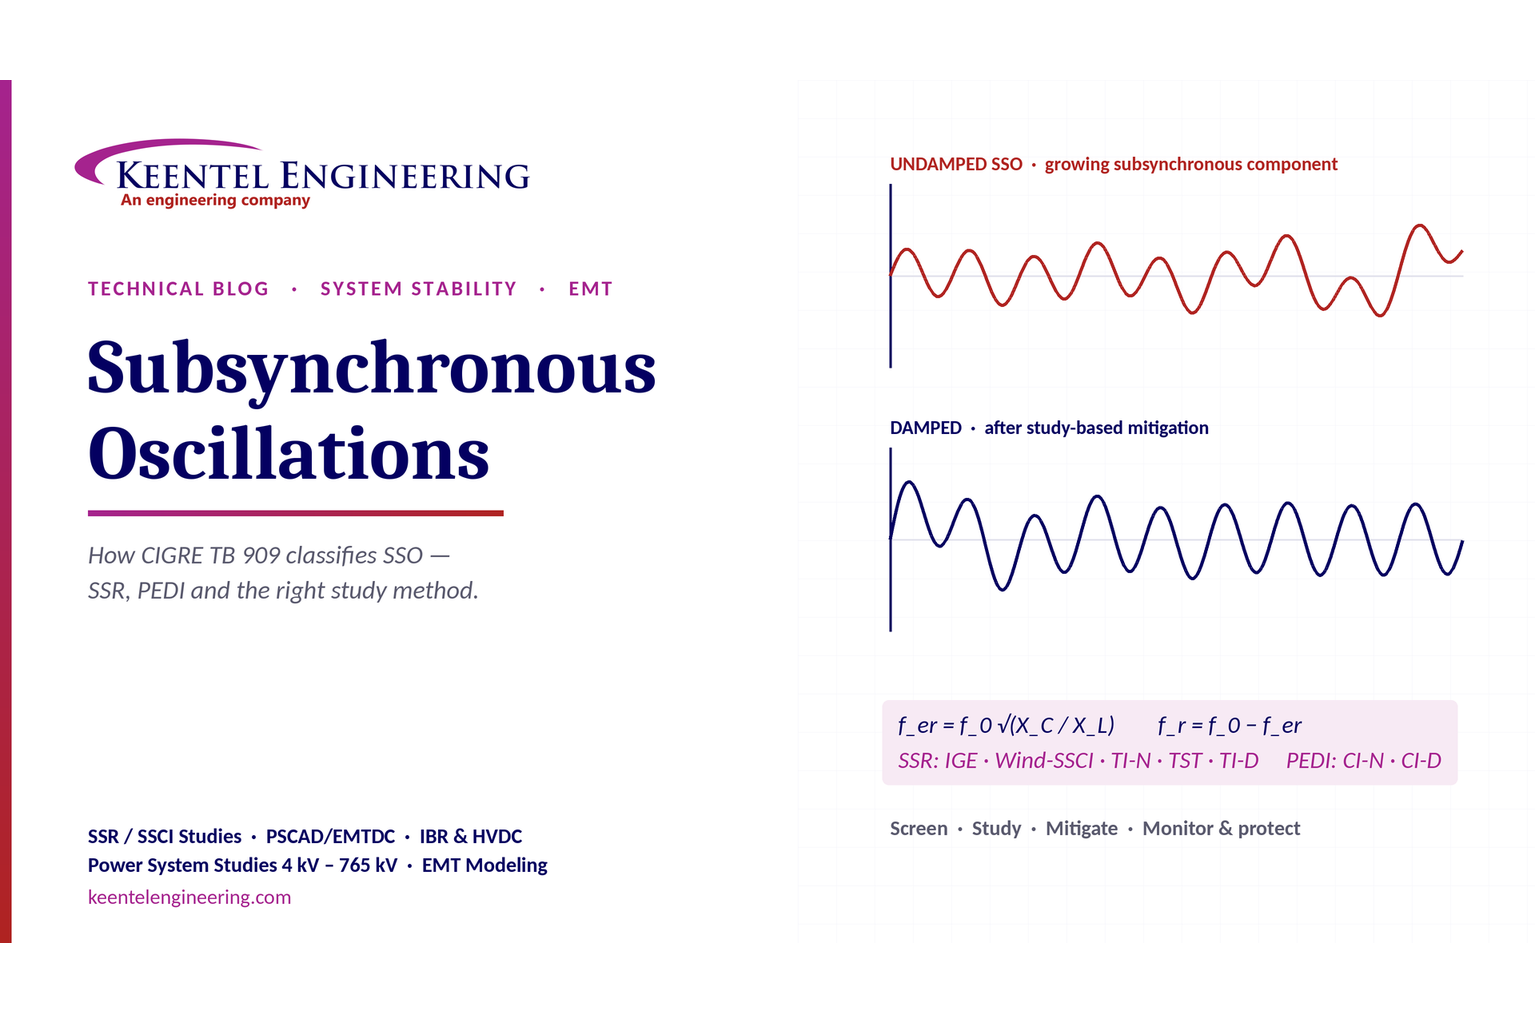
A practical guide to SSO classification, SSR, PEDI, Wind-SSCI, EMT analysis, mitigation and protection based on CIGRE TB 909.
By SANDIP R PATEL
•
October 3, 2026
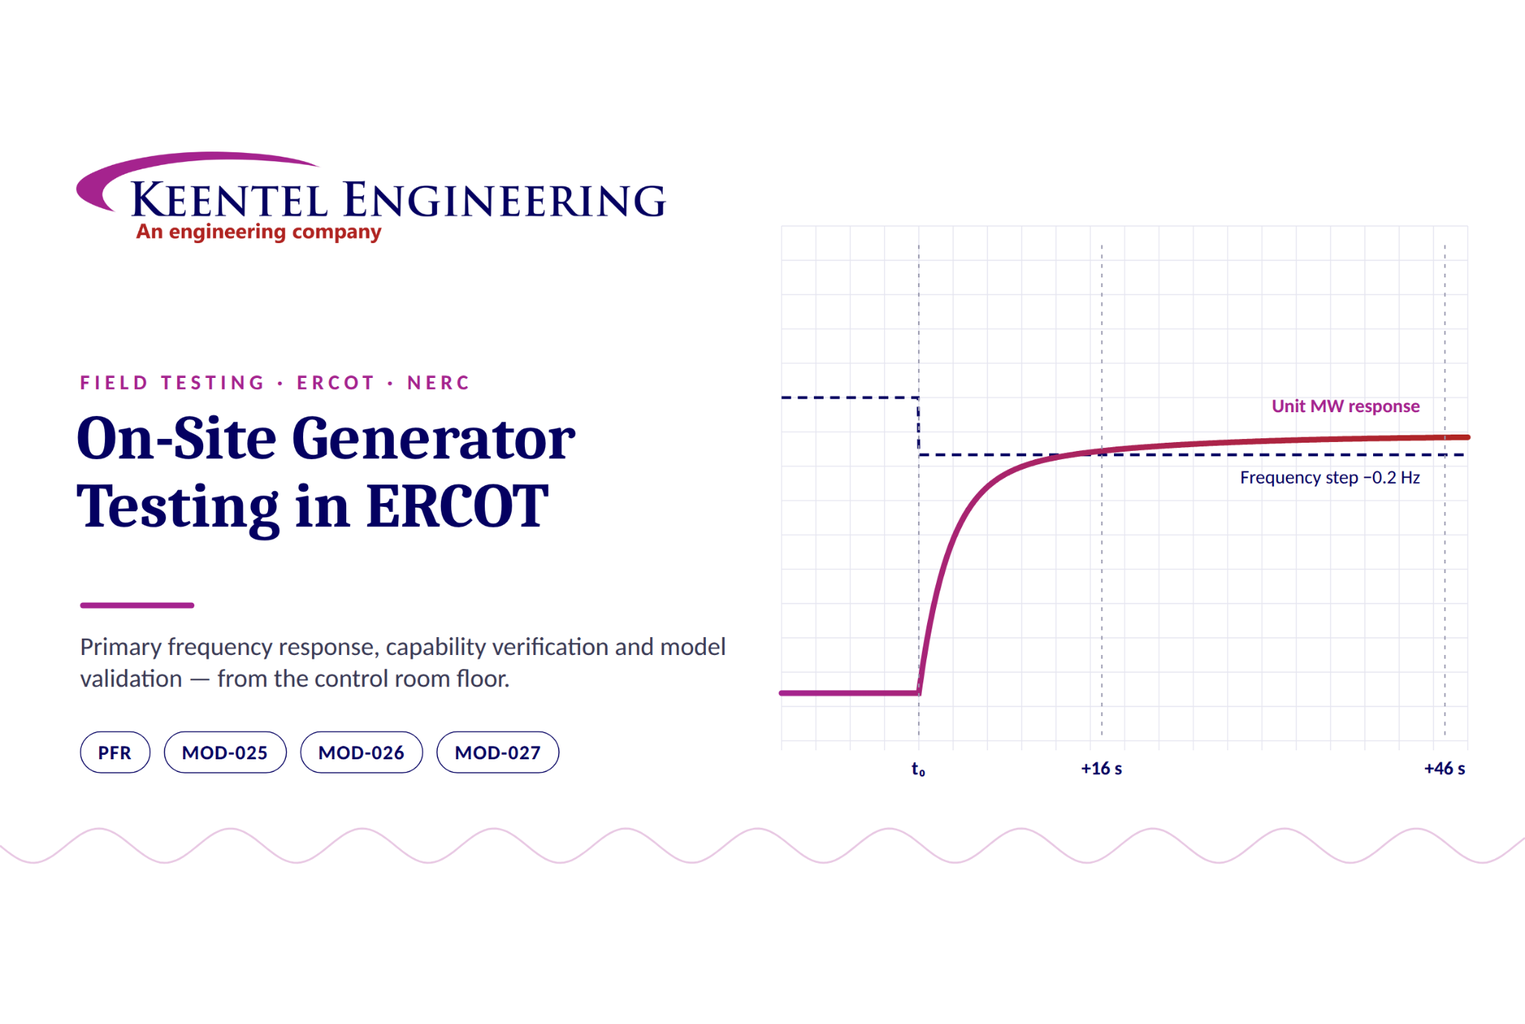
Learn ERCOT generator testing for PFR, MOD-025 and MOD-026/027, including staged tests, capability verification, dynamic models and field testing.





