
A Coordinated Electric System Interconnection Review—the utility’s deep-dive on technical and cost impacts of your project.
Challenge: Frequent false tripping using conventional electromechanical relays
Solution: SEL-487E integration with multi-terminal differential protection and dynamic inrush restraint
Result: 90% reduction in false trips, saving over $250,000 in downtime
The three operating regions you have to design to
| Device | Output vs voltage | Response | Best suited to | Main limitations |
|---|---|---|---|---|
| Mechanically switched capacitor or reactor | Proportional to voltage squared | Seconds; discrete steps; limited switching operations per day | Steady-state reactive supply, voltage profile, loss reduction | No dynamic capability; step voltage change on switching; capability collapses when most needed |
| Static var compensator | Capacitive branches proportional to voltage squared | A few cycles; continuously controllable | Continuous control where cost matters and deep voltage support is not the driver | Square-law capability loss; harmonic filters are part of the plant and interact with the network |
| STATCOM | Approximately proportional to voltage — constant current capability | One to two cycles closed loop; converter response faster still | Voltage stability margin, weak interconnections, fast disturbance recovery, flicker and unbalance compensation | Higher capital cost; converter losses; adds a converter and its control dynamics to the network |
| Synchronous condenser | Governed by machine capability and excitation | Excitation response in the hundreds of milliseconds; inherent inertial response instantaneous | System strength and inertia, short-circuit contribution, black start support | Rotating plant with maintenance and losses; slower controlled response than a converter |
| STATCOM with energy storage | Reactive as a STATCOM, plus real power within the storage rating | As STATCOM for reactive; real power limited by storage | Where a real power deficiency is part of the problem | Cost and complexity of the storage; different failure and maintenance profile |
| Stage | Keentel scope | Outcome |
|---|---|---|
| Screening | Series-compensation proximity, radial contingency review, UIF and short-circuit ratio screening, frequency scans | Early identification of which SSO types apply |
| Detailed studies | PSCAD/EMTDC EMT studies with vendor real-code models, impedance-based and frequency-scan analysis | Clear evidence of stability margins or risk |
| Model quality | EMT model review, benchmarking against positive-sequence models, model acceptance support | Models that system operators accept |
| Mitigation | Control retuning recommendations with vendors, SSDC and bypass logic requirements, protection and monitoring specifications | Practical, coordinated solutions |
| Interconnection support | SSR and SSO study reports for ISO and utility requirements, response to reviewer comments | Fewer delays in the interconnection process |
Resilience: designing CDUs to the facility Tier objective
Liquid cooling makes heat removal more critical, not less. Cold plates hold only seconds of thermal buffer. If TCS flow stops, processors throttle or shut down very quickly. Resilience design must therefore cover:
- Pump redundancy: N+1 pumps at minimum, with automatic changeover.
- CDU redundancy: N+1 CDUs on a common TCS header, or 2N CDUs serving A and B manifolds for fault-tolerant designs.
- Power to CDUs: dual-corded CDUs fed from A and B sources, with pumps and controls on UPS power so coolant keeps flowing through a utility failure and generator start. This is the liquid-cooling equivalent of continuous cooling.
- Facility water continuity: chilled water or condenser water must also continue, through thermal storage, UPS-backed pumps or a high enough FWS temperature that the TCS can coast on stored thermal mass for the transfer period.
- Concurrent maintainability: isolation valves so any CDU, pump, filter or manifold section can be serviced without stopping the others.
- Leak management: leak detection, drip trays, automatic isolation valves and procedures for fluid spills.
Electrical engineering considerations
CDUs and liquid-cooling plants are electrical loads with their own design requirements:
- Pump motors and VFDs. Large CDUs use variable-frequency drives on their pump motors. These introduce harmonic current that must be included in the facility's harmonic study and IEEE 519 evaluation.
- Critical mechanical load on UPS. Putting CDU pumps on UPS increases UPS and battery sizing. The mechanical UPS load must be included in redundancy and ride-through calculations.
- Feeder and protection design. Dual feeds, automatic transfer, selective coordination and arc-flash labelling apply to CDU power distribution just as they do to IT power.
- Generator transient response. CDU pumps restarting together after a transfer create motor inrush on the generators. Staged restarts and soft acceleration reduce the step load.
- Load dynamics. AI training loads can swing rapidly between high and low power. Cooling controls must track those swings without temperature overshoot, and electrical systems must handle both the IT and the cooling load changes.
Commissioning a liquid-cooled data hall
- Flush and clean the TCS piping and manifolds to the specified cleanliness, using high-purity flush water.
- Fill and vent with the specified coolant, verifying glycol concentration and chemistry.
- Pressure test for leaks at design and test pressures, including quick-disconnect fittings.
- Verify sensors and controls: flow meters, temperature sensors, pressure transmitters, leak detection and BMS points.
- Load test with heat load banks connected through the cold-plate interfaces or rack manifolds, across the operating range.
- Prove the heat balance on both loops at several load steps, and the approach temperature against the design.
- Test failure scenarios: pump failure, CDU failure, power transfer to generator, valve failure and loss of facility water, confirming temperatures stay within the IT vendor's limits.
How Keentel Engineering helps
Keentel Engineering supports data center owners, developers and EPCs with the electrical engineering that liquid-cooled facilities depend on, and coordinates with the mechanical engineer of record and cooling vendors on the integrated design.
Why Can a Grid-Connected Inverter Become Unstable Even When Grid Voltage Looks Normal? An Engineering Guide for US Inverter-Based Resources
October 11, 2026 | Blog
Part A — Inverter Control Stability at a Glance
A grid-connected inverter can sit at exactly 1.00 pu voltage, inside every steady-state limit, and still be one small disturbance away from sustained oscillation. The reason is that an inverter is not a passive device. It is a set of fast control loops a phase-locked loop (PLL), current controllers, voltage and reactive power controls and a plant controller that continuously measure the grid and respond to it. In a weak grid, every change in inverter current changes the voltage the inverter is measuring, so the controls interact with the network and with each other.
Voltage compliance and control stability are two different questionss
| Question | What answers it | What it cannot tell you |
|---|---|---|
| Are steady-state voltages acceptable? | Load flow (power flow) study | Whether the operating point is dynamically stable |
| Does the plant ride through faults and recover? | Positive-sequence (RMS) dynamic simulation with generic or user-defined models | Fast control interactions above a few hertz |
| Are the inverter controls stable with the network and nearby converters? | EMT simulation with vendor-specific models; impedance-based (frequency scan) analysis | Very large system-wide behavior, unless the EMT model is large |
What Keentel's model shows
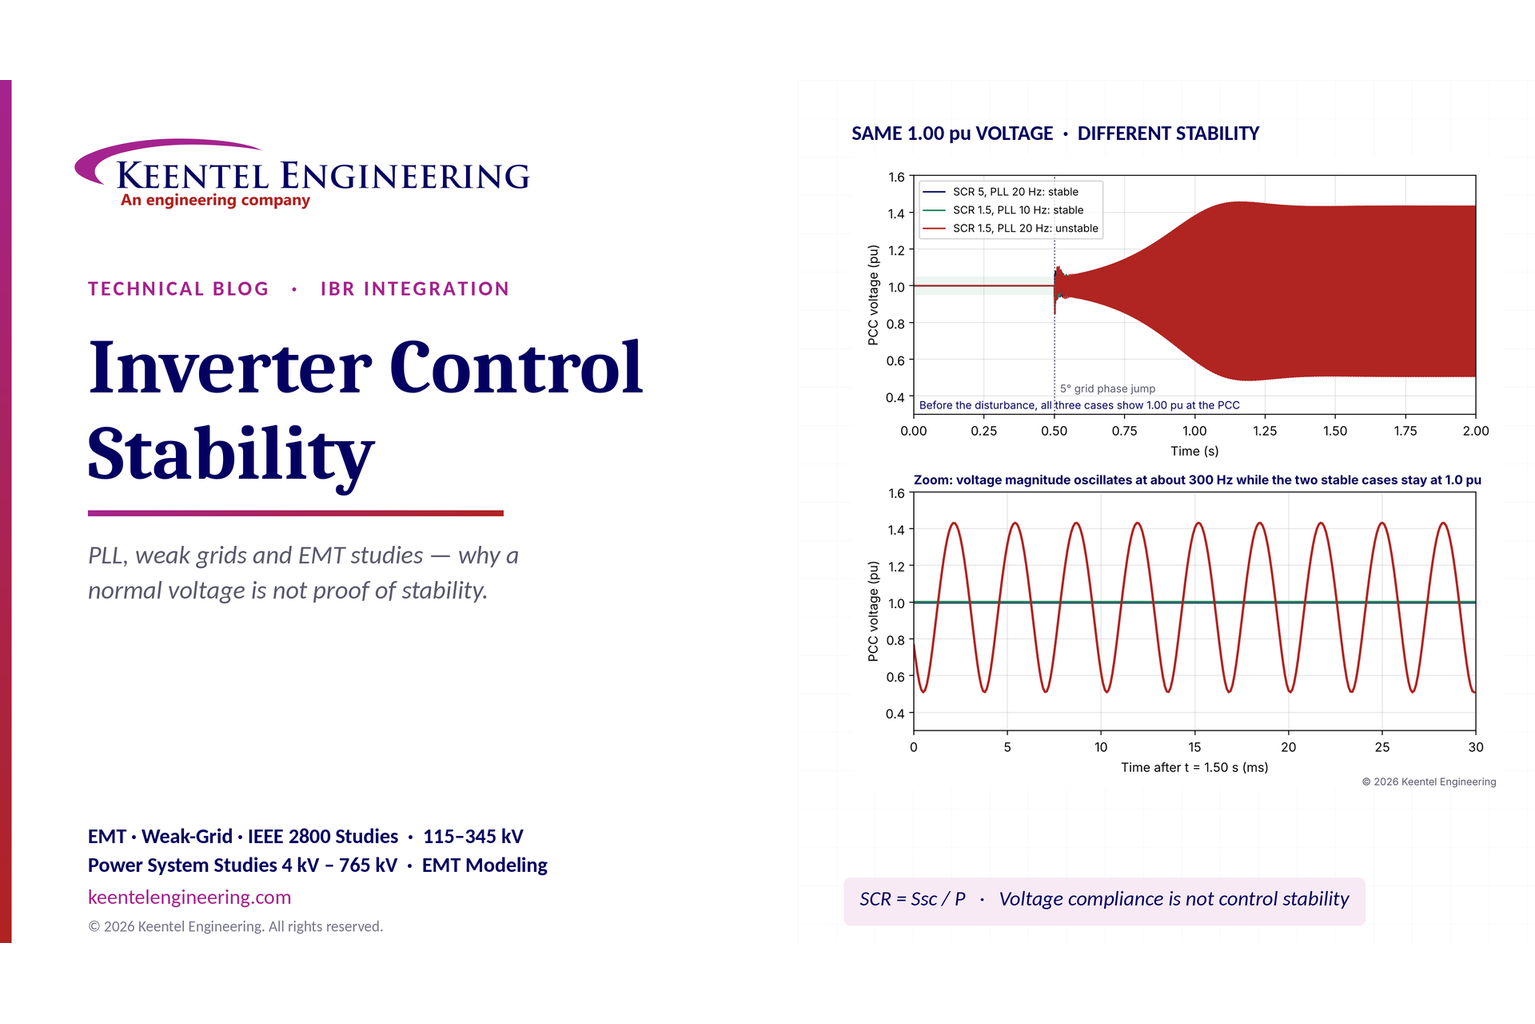
Keentel Engineering modeled a 100 MW grid-following inverter plant with a PLL, current control, voltage control and an output filter, connected to a Thevenin grid at different short-circuit ratios (SCR). Before the disturbance, every case showed 1.00 pu at the point of common coupling (PCC). After a 5-degree grid phase jump:
| SCR | PLL bandwidth 5 Hz | 10 Hz | 20 Hz | 30 Hz | 45 Hz |
|---|---|---|---|---|---|
| 10 | Stable | Stable | Stable | Stable | Marginal |
| 5 | Stable | Stable | Stable | Stable | Unstable |
| 3 | Stable | Stable | Stable | Stable | Unstable |
| 2 | Stable | Stable | Stable | Sustained oscillation | Unstable |
| 1.5 | Stable | Stable | Sustained oscillation | Sustained oscillation | Unstable |
| 1.2 | Stable | Sustained oscillation | Sustained oscillation | Unstable | Unstable |
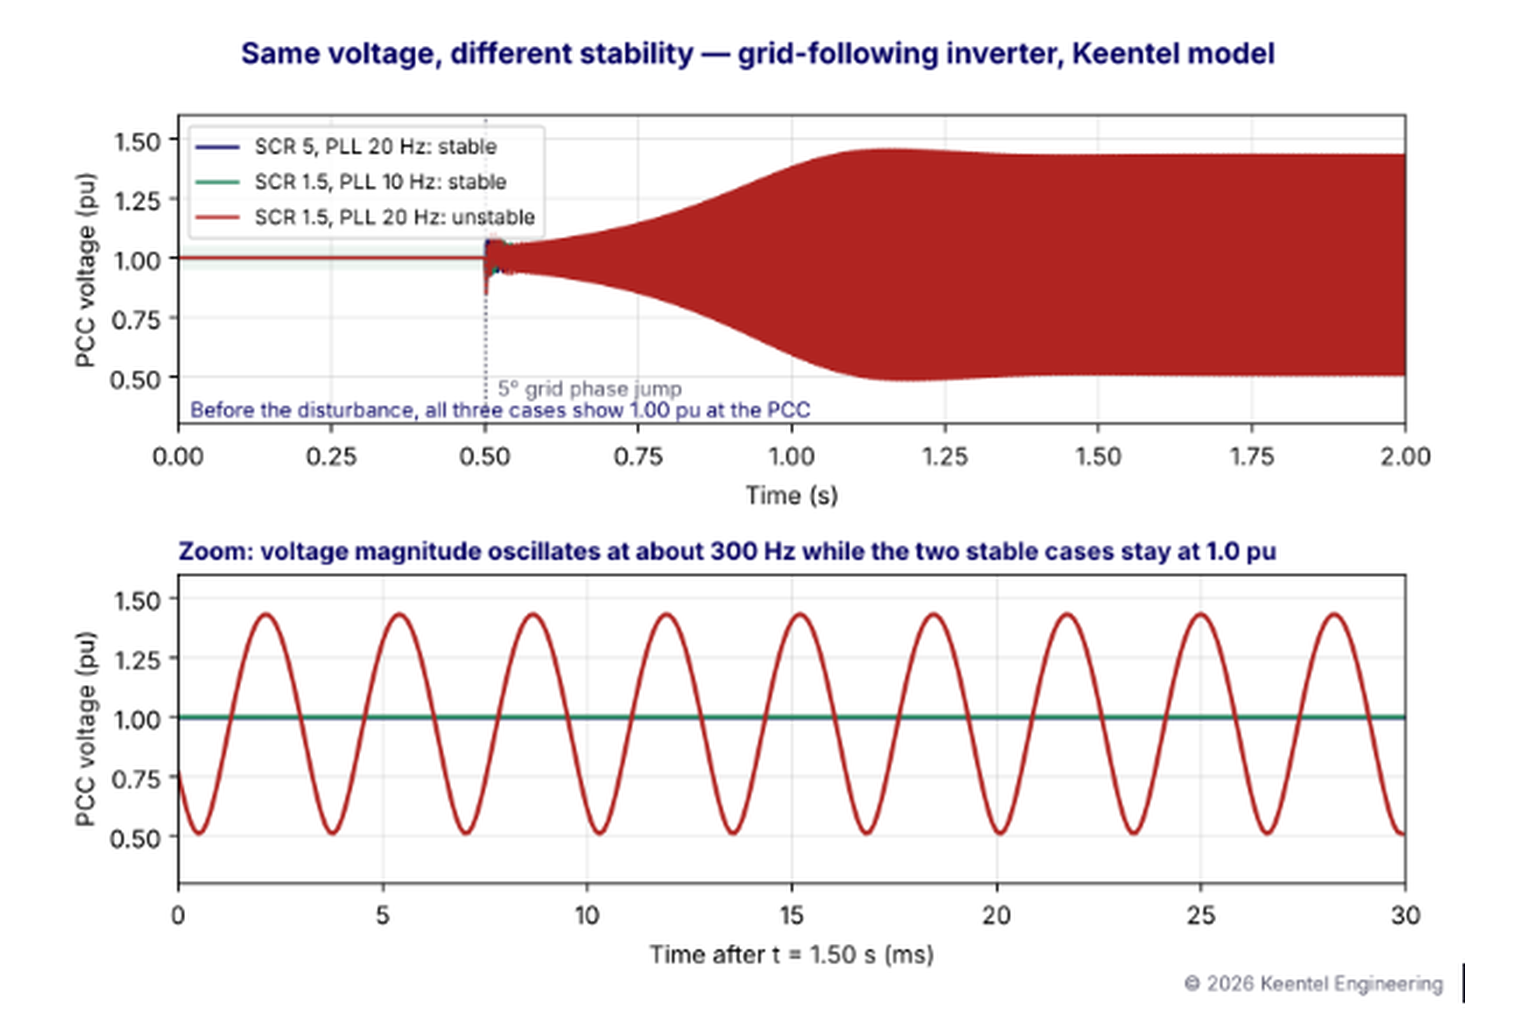
Figure 1. PCC voltage for three cases with identical pre-disturbance voltage. The fast PLL at SCR 1.5 develops a growing oscillation that settles into a sustained limit cycle of about ±0.45 pu; the same plant with a slower PLL, or on a stronger grid, recovers within a few cycles.
Key lessons
- Identical steady-state voltage, different dynamic outcome. All three cases in Figure 1 pass a load-flow voltage check.
- Weak grids shrink the stable range of control settings. A PLL tuning that is perfectly stable at SCR 5 oscillates at SCR 1.5.
- Slower is not automatically better. A very slow PLL improves small-signal stability but can degrade fault ride-through, phase-jump response and fast frequency response. Tuning is a trade-off.
- The answer comes from the right study, not from the voltage profile.
The question is not only whether the inverter can connect to the grid, but whether the combined system remains stable when its controls and the network interact.
Part B — Why Can a Grid-Connected Inverter Become Unstable Even When Grid Voltage Looks Normal? An Engineering Guide for US Inverter-Based Resources
Inverter-based resources (IBRs) — solar, wind, battery storage and HVDC/FACTS converters — are now the majority of new generation interconnecting to the US transmission system. Many of the best wind and solar sites are far from load and far from large synchronous generators, connected at 115 kV, 138 kV, 230 kV or 345 kV through long lines. Those locations are electrically weak. Since 2016, NERC disturbance reports, ERCOT oscillation events and operating experience across the Western, Eastern and ERCOT interconnections have shown that IBR plants can oscillate, trip or fail to recover even when steady-state voltages look normal. This guide explains why, how to quantify grid strength, how PLL and current controls interact with network impedance, and how US planners and developers study and solve the problem.
How a grid-following inverter works
Most installed solar, wind and battery inverters are grid-following. They behave as controlled current sources that synchronize to the measured grid voltage.
| Control loop | Function | Typical speed |
|---|---|---|
| Current control (inner loop) | Regulates d- and q-axis currents through the output filter | Bandwidth of a few hundred hertz to over 1 kHz |
| Phase-locked loop (PLL) | Tracks the angle and frequency of the PCC voltage to define the dq reference frame | Bandwidth commonly 5 to 50 Hz |
| Voltage / reactive power control | Adjusts reactive current to regulate terminal voltage or reactive output | 1 to 10 Hz |
| Active power and DC-link control | Sets active current from available DC power and DC voltage | 1 to 20 Hz |
| Plant controller (PPC) | Regulates POI voltage, reactive power, power factor and frequency response for the whole plant | 0.1 to 2 Hz, with communication delays |
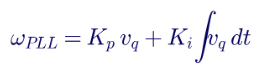
The PLL is the heart of a grid-following inverter. A synchronous reference frame PLL rotates the measured voltage into dq coordinates and drives the q-axis voltage to zero with a PI controller:
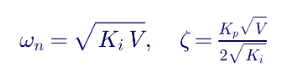
Linearized, the PLL behaves like a second-order system with natural frequency and damping:
Why grid strength matters
Short-circuit ratio
US planners use the
short-circuit ratio to describe grid strength at the point of interconnection:

A 200 MW plant at a 230 kV POI with 1,000 MVA of short-circuit capacity has SCR = 5. The same plant at a POI with 300 MVA has SCR = 1.5.
| SCR at POI | General characterization | Typical study implication |
|---|---|---|
| Above 5 | Strong | Positive-sequence models generally adequate for control stability screening |
| 3 to 5 | Moderate | Screening needed; EMT studies often requested |
| Below 3 | Weak | EMT studies with vendor-specific models expected |
| Below about 1.5 to 2 | Very weak | Special controls, grid-forming capability or network reinforcement may be required |
Weighted SCR and composite SCR
When several IBR plants share the same electrical area, single-plant SCR overstates grid strength because the plants interact. ERCOT and other planners use the weighted short-circuit ratio:
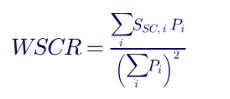
Composite SCR (CSCR) instead calculates short-circuit capacity with all nearby IBRs' contributions removed, divided by the total IBR rating in the area. Both metrics account for multiple plants pushing on the same weak network. ERCOT, for example, uses a WSCR screening threshold (commonly cited as 1.5) to identify where IBR control stability must be studied in detail.
What "weak" means physically
The voltage at the PCC is:

In a strong grid, Zgrid is small, so changes in inverter current barely move VPCC. The PLL sees a stable reference, and the current controller's actions do not feed back into its own measurements. In a weak grid, Zgrid is large: a change in inverter current shifts the PCC voltage magnitude and angle, the PLL responds to a disturbance the inverter itself created, the current reference shifts again, and a feedback loop forms through the network. If the loop gain is high enough and the phase lag large enough, the system oscillates.
Worked example: angle sensitivity
For a 100 MW plant at unity power factor with SCR = 1.5 and X/R = 10, the network reactance is about 0.66 pu on the plant base. The angle across the network at full output is roughly:
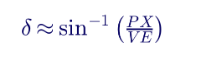
which is about 41 degrees at SCR 1.5, compared with about 11 degrees at SCR 5. A 1% change in active current moves the PCC angle about four times as much in the weak case — exactly the quantity the PLL is trying to track.
Mechanisms of control instability
| Mechanism | Frequency range | Typical cause |
|---|---|---|
| PLL-network interaction | Roughly 5 to 50 Hz in the dq frame | Fast PLL in a weak grid |
| Voltage control and plant controller interaction | 0.5 to 5 Hz | High voltage control gains, communication delay, multiple plants regulating the same bus |
| Current control and filter resonance | Hundreds of hertz to kilohertz | Current control bandwidth, PWM delay and LCL filter resonance |
| Converter-driven subsynchronous oscillation | 5 to 55 Hz in phase quantities | Interaction with series-compensated lines or weak AC systems |
| Harmonic instability | Above about 300 Hz | Converter impedance negative damping near network resonances, such as collector cable capacitance |
| Converter-to-converter interaction | Wide range | Several plants, STATCOMs or HVDC links with overlapping control bandwidths |
The oscillation in Keentel's model appears at about 300 Hz in the voltage envelope, showing that the interaction involves the PLL, current control and output filter together. Real plants show a range of frequencies depending on design; field events in the US have included oscillations from below 1 Hz to several hundred hertz.
Why a load flow cannot see it
A load flow solves the algebraic power-balance equations at one operating point. It has no representation of control dynamics, measurement filters, PLL bandwidth, time delays or current limits. It can confirm that a steady-state solution exists, but not that the solution is stable. The operating point in Figure 1 is a valid load-flow solution in all three cases.
Impedance-based stability analysis
An increasingly common method treats the inverter as a frequency-dependent impedance Zinv(s) and the grid as Zgrid(s). The inverter current source and its impedance, connected to the grid, form a closed loop. The system is stable if the ratio:
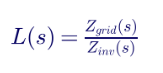
satisfies the Nyquist criterion. In practice, engineers look for frequencies where the inverter impedance has a negative real part (negative damping) and the magnitudes of the inverter and grid impedances cross. Frequency scans of vendor EMT models, combined with network frequency scans, identify risk without running hundreds of time-domain cases.
US requirements and guidance
| Requirement | Relevance to inverter control stability |
|---|---|
| IEEE Std 2800-2022 | Performance requirements for transmission-connected IBRs, including ride-through, voltage and frequency response; requires stable operation with the specified system strength |
| IEEE 2800.2 (recommended practice) | Test and verification procedures for IEEE 2800 conformity, including model validation |
| NERC Reliability Guideline: Integrating Inverter-Based Resources into Low Short Circuit Strength Systems | Grid strength metrics, study methods and mitigation |
| NERC Reliability Guideline: Electromagnetic Transient Modeling for BPS-Connected IBRs | When EMT studies are needed and EMT model quality expectations |
| NERC MOD-026 and MOD-027 (and their successors) | Verification of models for generator excitation, voltage control, active power and frequency response |
| NERC PRC-029 | Frequency and voltage ride-through for IBRs |
| FERC Order No. 2023 and related orders | Interconnection process reforms, including requirements for accurate IBR models |
| ERCOT, MISO, SPP, PJM, CAISO and utility interconnection requirements | Many require vendor-specific EMT models (often PSCAD) for weak-grid and IBR studies |
The right study for the right question
| Study | Model type | Best for | Limitation |
|---|---|---|---|
| Load flow | Algebraic | Voltage, thermal, reactive capability | No dynamics |
| Short-circuit / SCR screening | Algebraic | Identifying weak areas | Indicator only |
| RMS dynamic simulation (PSS®E, PSLF) | Positive-sequence, generic models such as REGC_C, REEC_D, REPC_C | System-wide fault response, frequency response, voltage recovery | Cannot reliably capture fast PLL and current control interactions, especially at low SCR |
| Small-signal (eigenvalue) analysis | Linearized | Identifying poorly damped modes and participation factors | Requires detailed linearized models |
| Impedance / frequency scan | Frequency domain | Control interaction and resonance risk screening | Small-signal only |
| EMT simulation (PSCAD) | Detailed, vendor-specific, three-phase instantaneous | Weak-grid control stability, ride-through, converter interactions, harmonics | Computationally intensive; requires validated vendor models |
Mitigation options
| Option | How it helps | Considerations |
|---|---|---|
| Retune PLL and control gains | Reduces loop gain at the interaction frequency | Must preserve ride-through, phase-jump and frequency response performance |
| Weak-grid control modes | Many vendors offer firmware tuned for low SCR | Requires vendor support, model update and testing |
| Plant controller tuning and coordination | Avoids slow voltage control oscillations and multi-plant hunting | Coordinate gains, droop and communication delays across plants |
| Synchronous condensers | Increase short-circuit strength and add inertia | Capital cost, losses and footprint |
| Grid-forming inverters | Behave as voltage sources, inherently stable at low SCR | Current limits, fault behavior and emerging requirements |
| STATCOM | Fast voltage support | Its own controls must be coordinated with nearby IBRs |
| Network reinforcement | Raises SCR permanently | Highest cost and longest schedule |
| Operating limits | Curtail output under weak network conditions | Lost energy and revenue |
A practical study workflow
- Screen grid strength using SCR, WSCR or CSCR for normal and N-1 conditions, including planned outages.
- Collect models early: vendor PSCAD model with the exact firmware and parameters, plant controller model, collector system and transformer data.
- Verify model quality: benchmark tests, initialization at the specified operating point, and consistency between RMS and EMT models.
- Build the EMT network: a sufficient portion of the transmission system, nearby IBRs, STATCOMs, HVDC, and series compensation.
- Run the scenarios: small disturbances, faults, phase jumps, voltage steps and frequency events across SCR, dispatch and voltage conditions.
- Perform frequency scans where multiple converters or resonances are suspected.
- Identify and test mitigation: tuning, equipment or operating limits.
- Document and validate: confirm performance at commissioning and update models under NERC model verification requirements.
How Keentel Engineering helps
Keentel Engineering performs IBR interconnection and stability studies for developers, independent power producers, utilities and transmission owners, from 4 kV to 765 kV.
| Stage | Keentel scope | Outcome |
|---|---|---|
| Grid strength screening | SCR, WSCR and CSCR analysis for normal and contingency conditions | Early identification of weak-grid risk |
| EMT studies | PSCAD studies with vendor models: control interaction, ride-through, phase jump and multi-plant interaction | Evidence of stable operation for interconnection approval |
| Impedance and frequency scans | Inverter and network frequency scans, resonance and negative damping assessment | Targeted mitigation without excessive time-domain runs |
| Model review and validation | Vendor model quality checks, RMS-EMT benchmarking, IEEE 2800.2 and NERC model verification support | Accurate models accepted by planners and ISOs |
| Mitigation design | Control retuning with vendors, grid-forming and synchronous condenser evaluation, STATCOM coordination | Practical, cost-effective solutions |
| Interconnection support | Study documentation, responses to transmission provider comments and commissioning support | Faster, smoother interconnection |
Why clients choose Keentel Engineering
- EMT expertise: detailed PSCAD modeling of inverter plants, collector systems and transmission networks.
- Beyond the checklist: studies designed to answer whether the plant is stable, not only whether voltages are within limits.
- Vendor-neutral: experience across inverter manufacturers and control architectures.
- Interconnection experience: practical knowledge of ERCOT, MISO, SPP, PJM, CAISO and utility study requirements.
- Licensed professional engineering: a Florida-registered firm with offices in Tampa, Austin, Sacramento and Baltimore, supporting projects nationwide.
Interconnecting a solar, wind or battery project in a weak area? Talk to Keentel Engineering at (813) 389-7871, contact@keentelengineering.com, or book a 15-minute scoping call at calendly.com/keentel-engineering/15min.
Part C — Case Studies
The following are illustrative scenarios based on conditions typical of US IBR interconnections. They show how Keentel Engineering approaches control stability problems; site details are generalised and figures are rounded.
Case Study 1 — 250 MW solar plant at a weak 138 kV POI
Situation
A 250 MW solar plant connects to a 138 kV substation at the end of a long radial path. Load-flow and RMS dynamic studies show acceptable voltages and fault recovery, but the transmission provider requires EMT studies because N-1 SCR falls to about 1.6.
Analysis
Keentel's PSCAD study with the vendor model reveals a sustained oscillation of about 15 Hz in the dq frame after a nearby fault under the critical N-1 outage. Frequency scans show the inverter impedance has negative damping where it crosses the weak-grid impedance. The RMS model, with generic parameters, could not reproduce it.
Engineered solution
Working with the inverter manufacturer, Keentel evaluates a weak-grid firmware setting with reduced PLL bandwidth and revised voltage control gains, then verifies ride-through and phase-jump performance against IEEE 2800 requirements.
Outcome
The plant is stable for all studied contingencies with the revised settings, and the updated model and parameter set become part of the interconnection agreement.
Case Study 2 — 345 kV wind and battery cluster: multi-plant voltage control hunting
Situation
Three IBR plants two wind farms and a battery connect within a few miles on a 345 kV system with a WSCR of about 1.8. After the battery is commissioned, operators observe a slow voltage oscillation of about 1 Hz when all three plants are at high output.
Analysis
Keentel's EMT and RMS analysis shows that all three plant controllers regulate nearby buses with high gains and different communication delays, causing them to fight each other. Each plant is stable on its own; the instability exists only when all three interact.
Engineered solution
Keentel recommends coordinated voltage droop settings, reduced plant controller gains and a common regulation strategy, verified by EMT simulation of the full cluster.
Outcome
The oscillation disappears in simulation and field monitoring, and the planning coordinator updates its models to represent the coordinated settings.
Case Study 3 — 230 kV retiring generator: synchronous condenser versus grid-forming battery
Situation
A coal plant at a 230 kV substation is scheduled to retire. Several nearby solar plants rely on its short-circuit contribution, and studies show WSCR would fall from about 2.8 to 1.4.
Analysis
Keentel's EMT studies show that two solar plants would oscillate after the retirement. Keentel compares converting the retiring generator to a synchronous condenser with installing a 150 MW grid-forming battery.
Engineered solution
The selected solution converts one generator to a synchronous condenser for short-circuit strength and inertia, combined with modest PLL retuning on the most sensitive solar plant.
Outcome
All plants remain stable after retirement, and the utility reuses its existing 230 kV interconnection facilities.
Part D — Technical FAQ: Inverter Control Stability and Weak Grids
1. Can an inverter be unstable when voltage is within limits?
Yes. Voltage limits describe the steady-state operating point; stability describes how the inverter's controls and the network respond to disturbances around that point. An operating point can satisfy voltage limits and still be dynamically unstable.
2. What is a phase-locked loop?
A PLL is the control loop that tracks the angle and frequency of the grid voltage. A grid-following inverter uses the PLL output to align its current with the grid, so the PLL's behavior strongly affects stability.
3. Why does PLL bandwidth matter?
A fast PLL tracks the grid closely but also reacts strongly to voltage changes caused by the inverter itself in a weak grid. This self-interaction can create oscillations. A slower PLL is more stable in weak grids but can reduce ride-through and dynamic performance.
4. What is short-circuit ratio?
SCR is the short-circuit capacity at the point of interconnection divided by the plant's rated power. It is the most common indicator of grid strength.
5. What SCR is considered weak?
In general, SCR below 3 is considered weak and below about 1.5 to 2 very weak. The exact threshold depends on the inverter design and the transmission provider's criteria.
6. What is weighted short-circuit ratio?
WSCR accounts for several IBR plants in the same area by weighting short-circuit capacity by plant rating. It gives a more realistic measure of grid strength when plants interact.
7. Why can't a load flow detect control instability?
A load flow solves algebraic power-balance equations and contains no control dynamics. It shows whether a steady-state solution exists, not whether it is stable.
8. When are EMT studies needed?
When the grid is weak, when several converters are electrically close, near series-compensated lines or HVDC, and when fast control interactions, ride-through or harmonic behavior must be verified. Many US transmission providers require them for IBRs in low-SCR areas.
9. Why aren't RMS models enough?
Positive-sequence RMS models simplify fast controls such as the PLL and current control and assume a fundamental-frequency network. They are suitable for system-wide studies but can miss fast control interactions in weak grids.
10. What is a vendor-specific EMT model?
It is a detailed model supplied by the inverter manufacturer, often compiled from the actual control code, that represents the real firmware, protection and control behavior.
11. What is impedance-based stability analysis?
It represents the inverter and grid as frequency-dependent impedances and applies a Nyquist-type criterion to their ratio. It identifies frequencies where the inverter introduces negative damping.
12. Can multiple inverters interact with each other?
Yes. Plants or converters with overlapping control bandwidths in the same weak area can interact, and an area can be unstable even when each plant is stable alone.
13. What is a grid-forming inverter?
A grid-forming inverter behaves as a controlled voltage source rather than a current source. It does not rely on a conventional PLL to synchronize and can remain stable at very low SCR, within its current limits.
14. Do synchronous condensers help inverter stability?
Yes. They increase short-circuit strength, raising SCR, and provide inertia and dynamic reactive power, which helps nearby grid-following inverters operate stably.
15. What does IEEE 2800 require for weak-grid performance?
IEEE 2800-2022 specifies performance requirements, including ride-through and dynamic response, that transmission-connected IBRs must meet, and it expects stable operation for the specified system conditions. Its companion recommended practice addresses verification.
16. What NERC guidance applies?
NERC Reliability Guidelines on integrating IBRs into low short-circuit strength systems and on EMT modeling describe metrics, study methods and model expectations. NERC model verification standards and PRC-029 also apply.
17. Can retuning controls solve weak-grid instability?
Often, yes. Reducing PLL bandwidth, adjusting voltage control gains or enabling a vendor's weak-grid mode can restore stability. Tuning must be verified against all performance requirements.
18. Why must contingencies be studied?
SCR falls when transmission elements are out of service. A plant stable with all lines in service may oscillate during an N-1 or planned outage condition.
19. How is control stability verified after commissioning?
By comparing measured responses during staged tests and real disturbances with model results, using high-resolution plant and PMU data, and updating models as required by NERC verification standards.
20. What is the most important takeaway?
Voltage compliance and control stability are separate questions. A complete interconnection study confirms both, using models that represent how the inverter controls and the network actually interact.
References and Further Reading
Links were current at publication (October 2026).
- IEEE Std 2800-2022, Standard for Interconnection and Interoperability of Inverter-Based Resources Interconnecting with Associated Transmission Electric Power Systems. IEEE.
- IEEE P2800.2, Recommended Practice for Test and Verification Procedures for Inverter-Based Resources Interconnecting with Bulk Power Systems. IEEE.
- NERC Reliability Guideline, Integrating Inverter-Based Resources into Low Short Circuit Strength Systems. North American Electric Reliability Corporation.
- NERC Reliability Guideline, Electromagnetic Transient Modeling for BPS-Connected Inverter-Based Resources. North American Electric Reliability Corporation.
- NERC Reliability Standards PRC-029, MOD-026 and MOD-027. North American Electric Reliability Corporation.
- IEEE/CIGRE, Definition and Classification of Power System Stability — Revisited and Extended (including converter-driven stability). IEEE Transactions on Power Systems.
- J. Sun, Impedance-Based Stability Criterion for Grid-Connected Inverters. IEEE Transactions on Power Electronics.
Disclaimer
This article is general technical information for educational purposes. It is not engineering advice for any specific project and does not create a professional relationship. The simulation results come from Keentel Engineering's simplified single-inverter model with illustrative parameters, not field data; actual stability limits depend on the specific inverter firmware, plant design, network and operating conditions and must be verified with validated vendor models. Project designs must follow current standards, transmission provider and ISO/RTO requirements and project-specific engineering analysis, sealed by a licensed professional engineer where required.
Case studies are illustrative scenarios based on typical project conditions, not records of specific client projects. Figures are rounded and indicative.
IEEE, NERC, FERC, ERCOT, PSS®E, PSLF, PSCAD™ and other names are the property of their respective owners. Keentel Engineering is not affiliated with or endorsed by these organisations or any software or equipment vendor.
| Office | Address | Phone |
|---|---|---|
| Head Office — Tampa | 400 N Ashley Dr STE #2600, Tampa FL 33602 | (813) 389-7871 |
| Austin | 5900 Balcones Drive STE 100, Austin TX 78731 | (512) 591-0752 |
| Sacramento | 1401 21st St Ste R, Sacramento CA 95811 | (916) 913-4524 |
| Baltimore | 306 W Redwood St STE 200, Baltimore MD 21201 | (410) 225-2181 |
contact@keentelengineering.com · keentelengineering.com · calendly.com/keentel-engineering/15min
State of Florida — Registry No. 36853, KEENTEL LLC, DBA: KEENTEL ENGINEERING
Copyright 1995–2026 Keentel Engineering. All Rights Reserved.

About the Author:
Sandip "Sonny" R. Patel, P.E.
IEEE Senior Member · Founder & CEO, Keentel Engineering
In 1995, Sonny Patel earned his Electrical Engineering degree from the University of Illinois. But degrees don't build legacies — action does.
For three decades, he has worked the power industry from every side of the table: 16 years as a utility engineer at Exelon/Commonwealth Edison; generation leadership across hydroelectric, industrial steam turbine, and a 9 GW renewable fleet; NERC Regional Entity Senior Compliance Engineer and Audit Team Lead, auditing some of the nation's largest utilities; and testing and commissioning lead on equipment up to 765 kV — the very top of the North American grid.Utility. Generator. Regulator. Consultant. Few engineers have seen all four seats. Fewer still have sat in them.
His experience spans nuclear, hydro, conventional generation, renewables, oil and gas, mining — and today's data centers, where he is authoring a three-book series on data center design. He is a Licensed Professional Engineer in six states and a Licensed Electrical Contractor in Florida (Unlimited EC) — he doesn't just design the work; he's qualified to stand behind its execution.Today, as Founder and CEO of Keentel Engineering, Sonny leads a nationwide team of engineers delivering substation design, power system studies, NERC compliance, and commissioning — done right, coast to coast.Three decades. Every side of the table. One standard: accountable engineering.
Services

Let's Discuss Your Project
Let's book a call to discuss your electrical engineering project that we can help you with.
About the Author:
Sandip "Sonny" R. Patel, P.E.
IEEE Senior Member · Founder & CEO, Keentel Engineering
In 1995, Sonny Patel earned his Electrical Engineering degree from the University of Illinois. But degrees don't build legacies — action does.
For three decades, he has worked the power industry from every side of the table: 16 years as a utility engineer at Exelon/Commonwealth Edison; generation leadership across hydroelectric, industrial steam turbine, and a 9 GW renewable fleet; NERC Regional Entity Senior Compliance Engineer and Audit Team Lead, auditing some of the nation's largest utilities; and testing and commissioning lead on equipment up to 765 kV — the very top of the North American grid.
Utility. Generator. Regulator. Consultant. Few engineers have seen all four seats. Fewer still have sat in them.
His experience spans nuclear, hydro, conventional generation, renewables, oil and gas, mining — and today's data centers, where he is authoring a three-book series on data center design. He is a Licensed Professional Engineer in six states and a Licensed Electrical Contractor in Florida (Unlimited EC) — he doesn't just design the work; he's qualified to stand behind its execution.
Today, as Founder and CEO of Keentel Engineering, Sonny leads a nationwide team of engineers delivering substation design, power system studies, NERC compliance, and commissioning — done right, coast to coast.Three decades. Every side of the table. One standard: accountable engineering.
Leave a Comment
Thank you for contacting us.
We will get back to you as soon as possible.
We will get back to you as soon as possible.
Oops, there was an error sending your message.
Please try again later.
Please try again later.
Related Posts
By SANDIP R PATEL
•
October 11, 2026
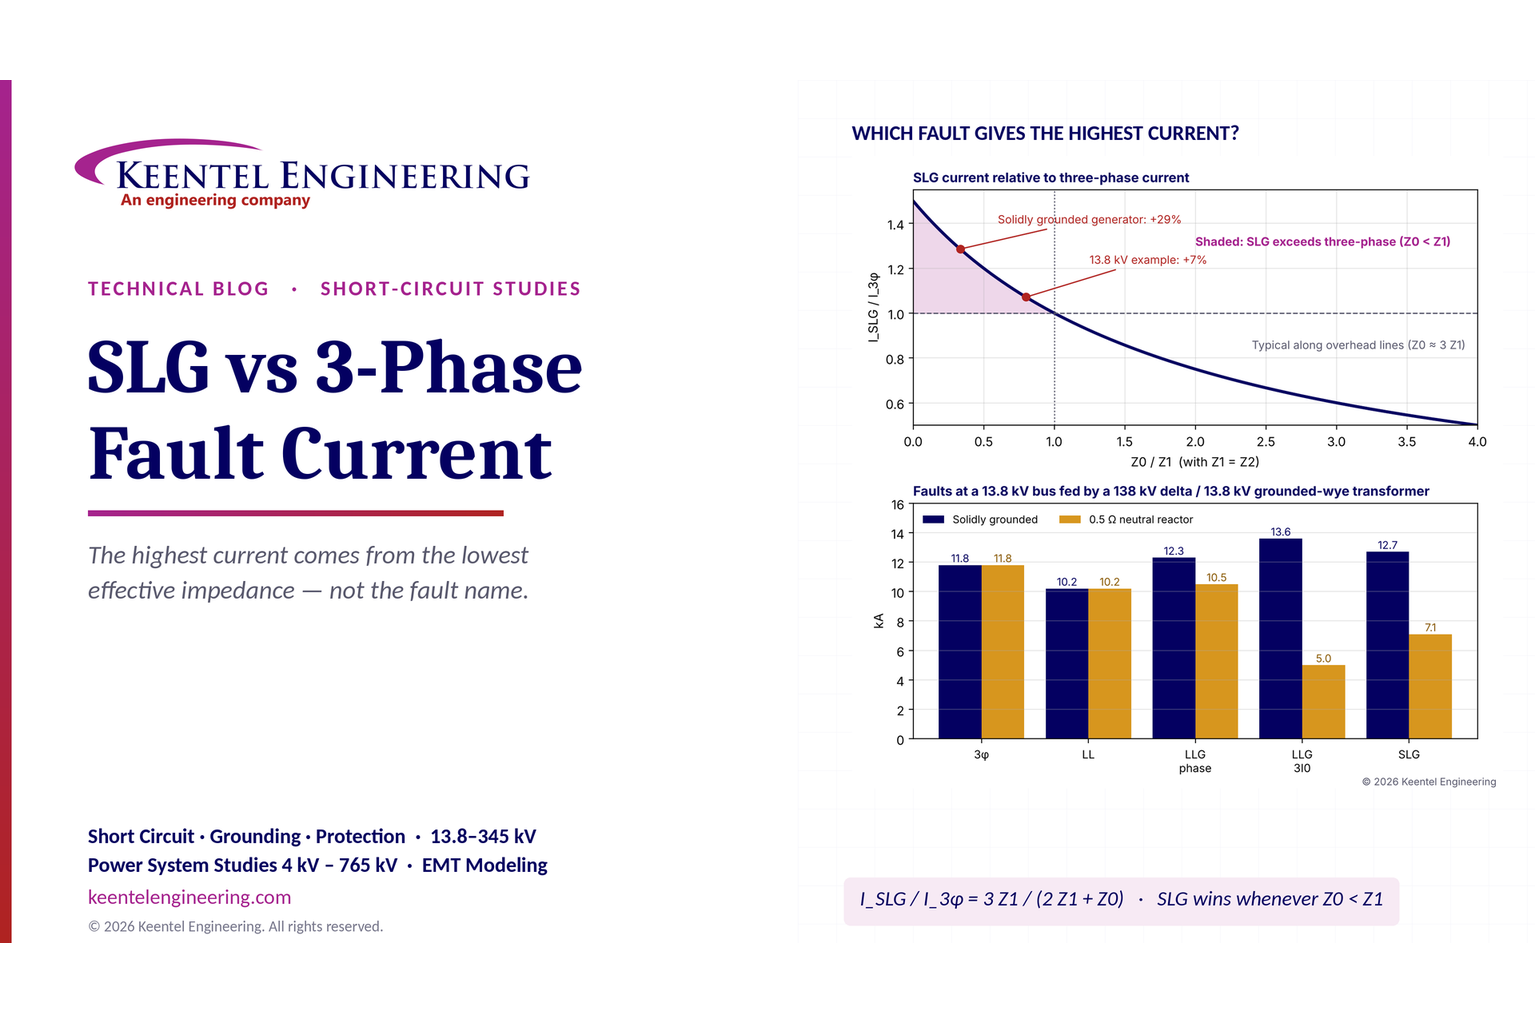
Learn which fault produces the highest current at a bus, why SLG faults can exceed three-phase faults, and how symmetrical components determine fault duty.
By SANDIP R PATEL
•
October 11, 2026
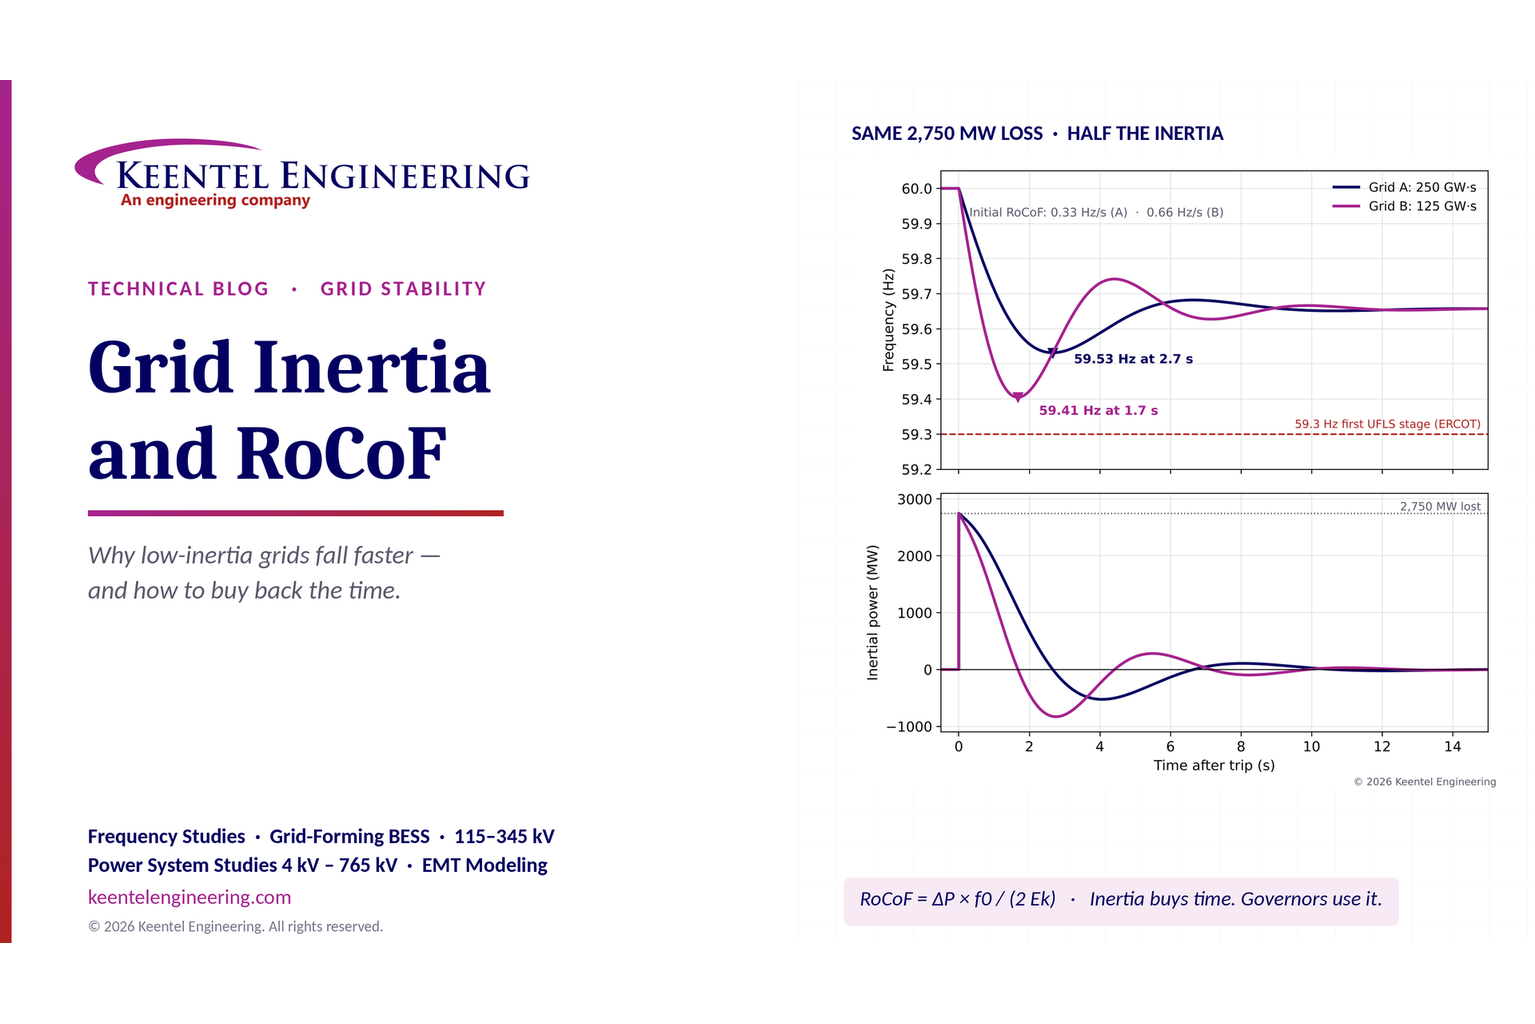
Explore grid inertia, RoCoF and frequency response, with swing equation calculations, frequency nadir analysis and US power system simulation examples.
By SANDIP R PATEL
•
October 11, 2026
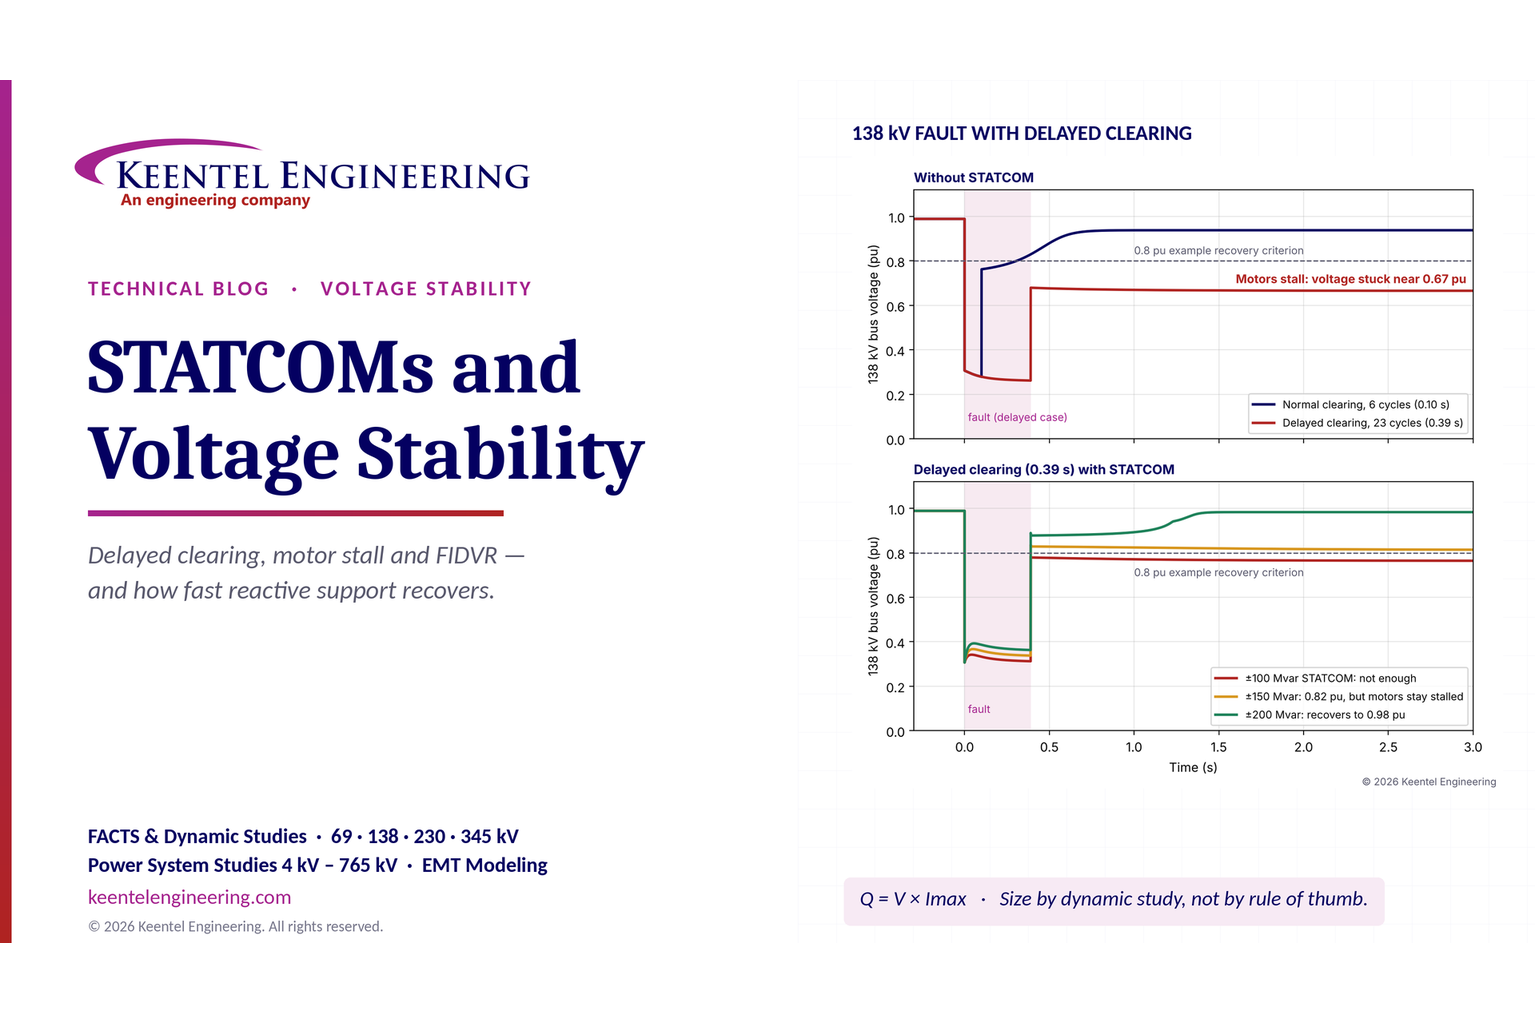
Learn how STATCOMs improve voltage stability and prevent FIDVR. Explore reactive power sizing, delayed fault clearing, NERC criteria and 138 kV simulation results.
By SANDIP R PATEL
•
October 10, 2026
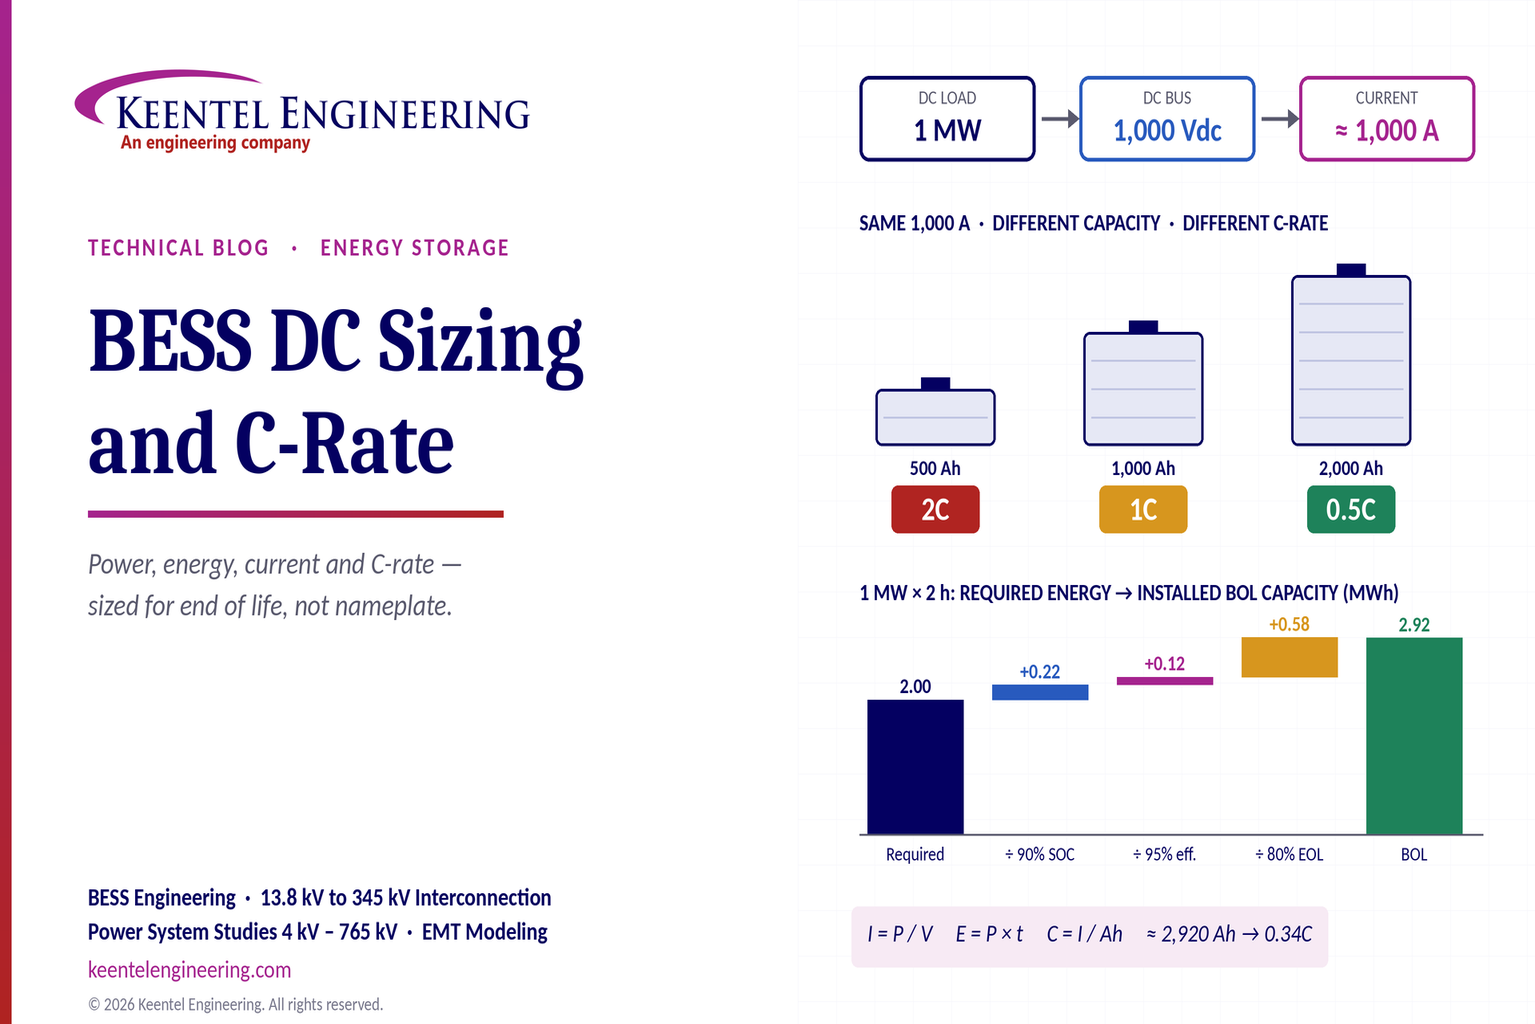
Learn BESS DC sizing with power, energy, current and C-rate calculations, battery losses, degradation and a 100 MW/400 MWh utility-scale example.
By SANDIP R PATEL
•
October 10, 2026
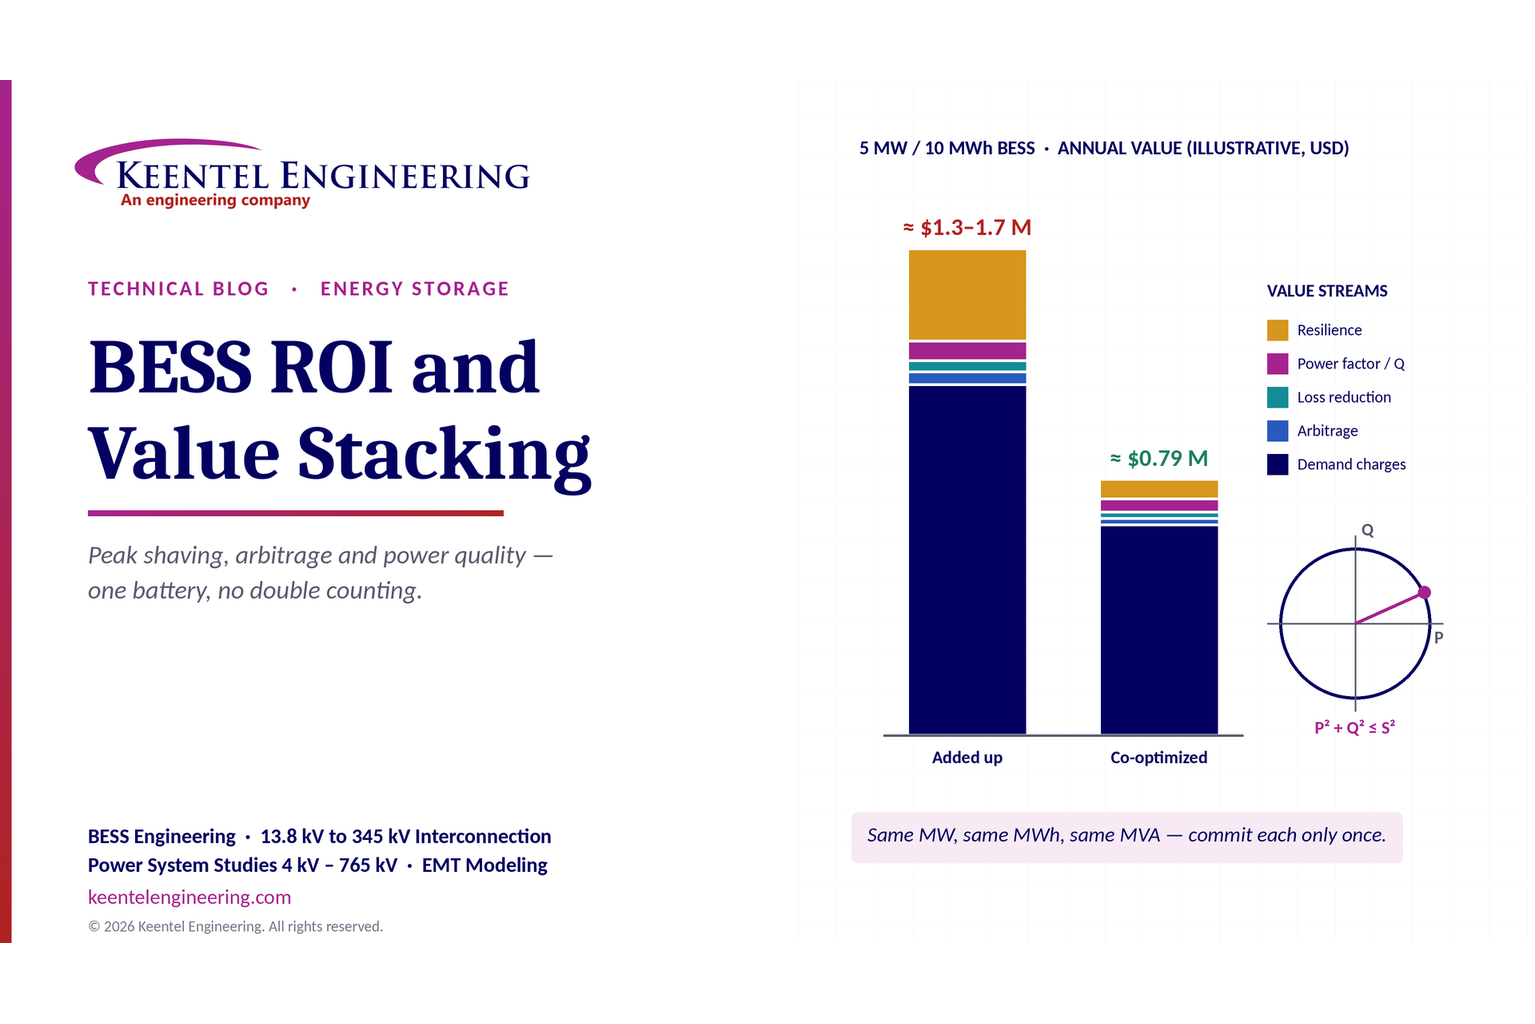
Learn how BESS ROI is calculated using peak shaving, energy arbitrage, power quality and battery storage economics, with a practical 5 MW/10 MWh example.
By SANDIP R PATEL
•
October 10, 2026
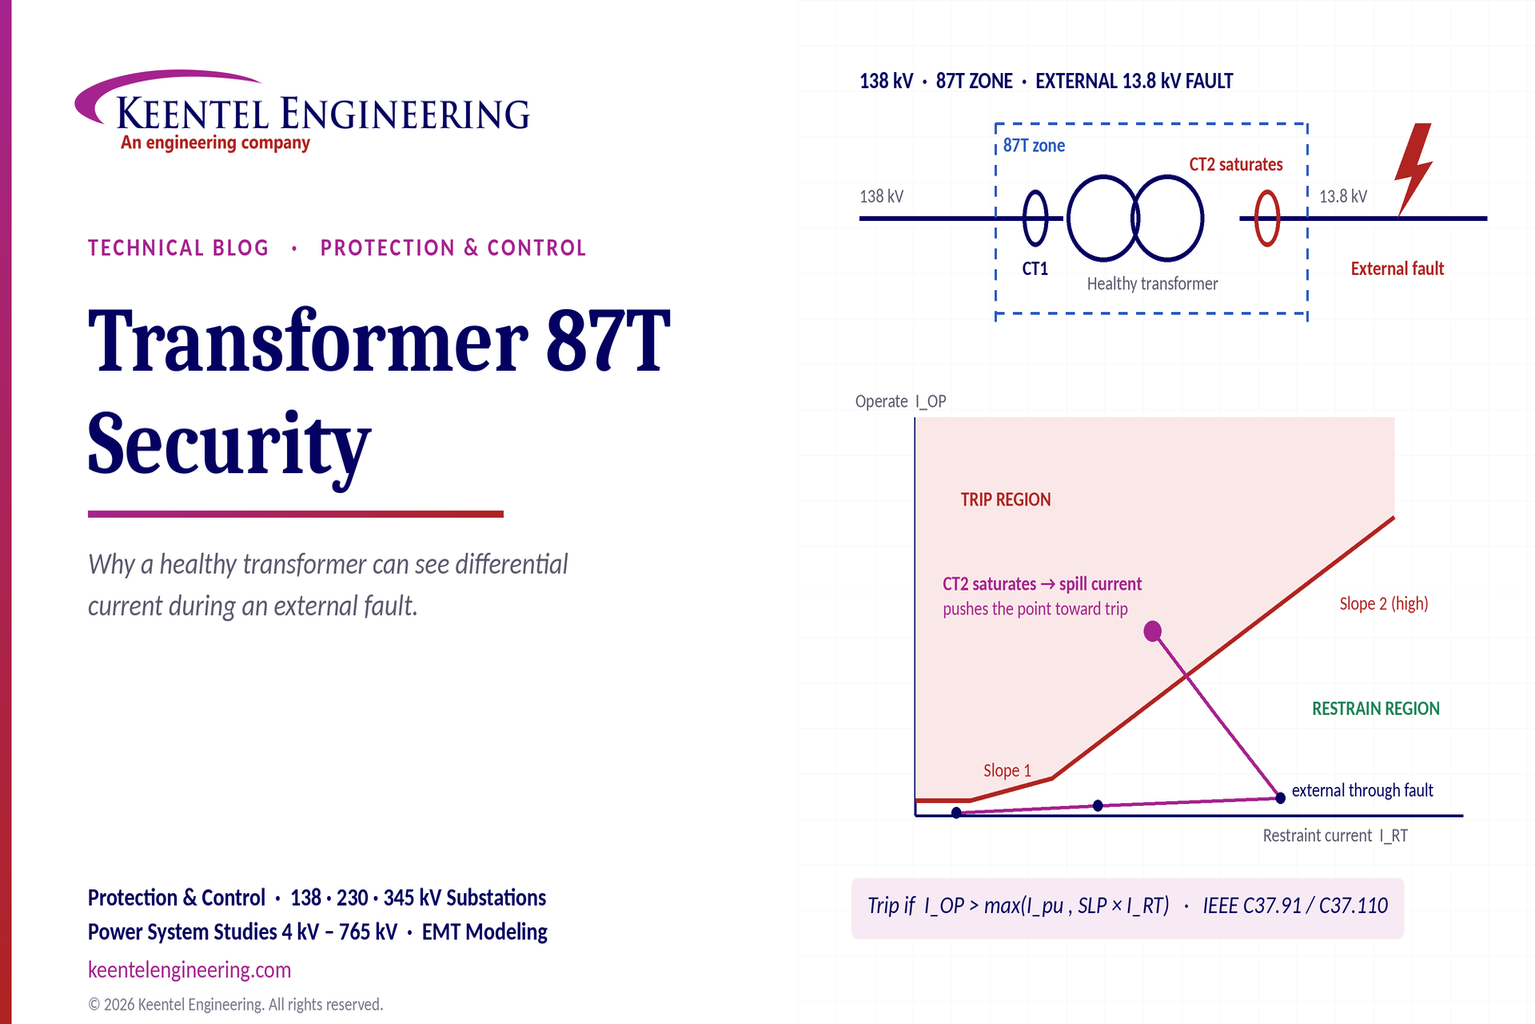
Learn why transformer differential relays detect current during external faults, how CT saturation causes spill current, and how secure 87T protection prevents trips.
By SANDIP R PATEL
•
October 10, 2026
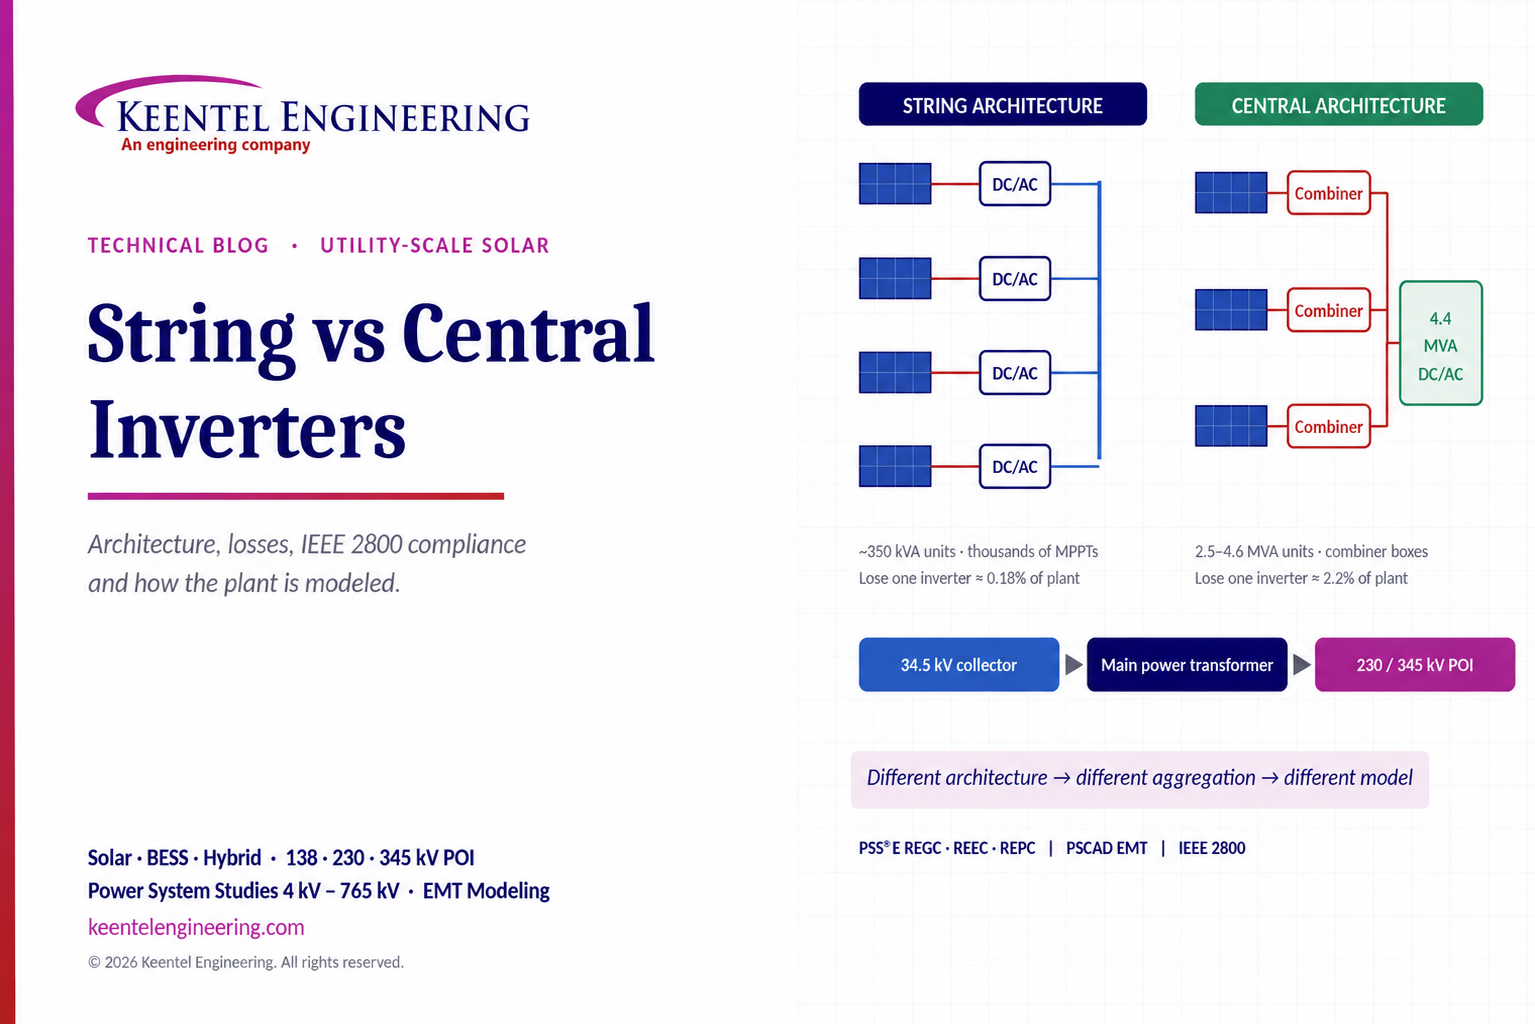
Compare string vs central inverters for utility-scale solar, including efficiency, maintenance, grid compliance, reactive power and interconnection studies.
By SANDIP R PATEL
•
October 9, 2026
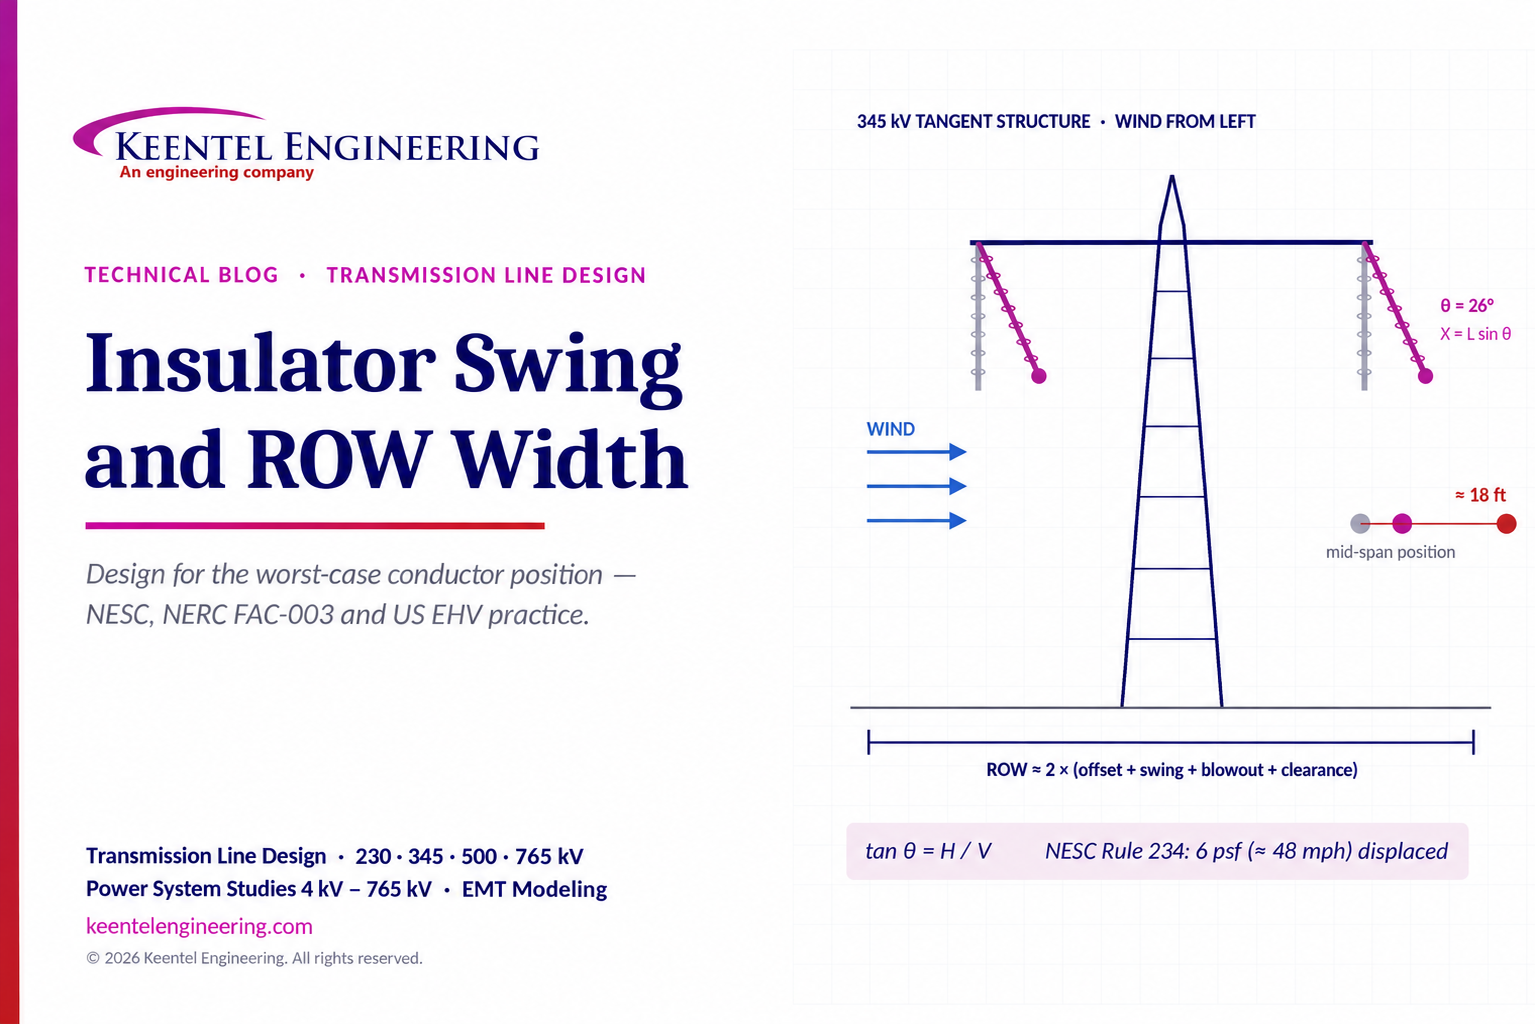
Learn how insulator swing angle and conductor blowout affect transmission line ROW width, with NESC clearances, NERC FAC-003 guidance, and a 345 kV example.
Copy
By SANDIP R PATEL
•
October 3, 2026
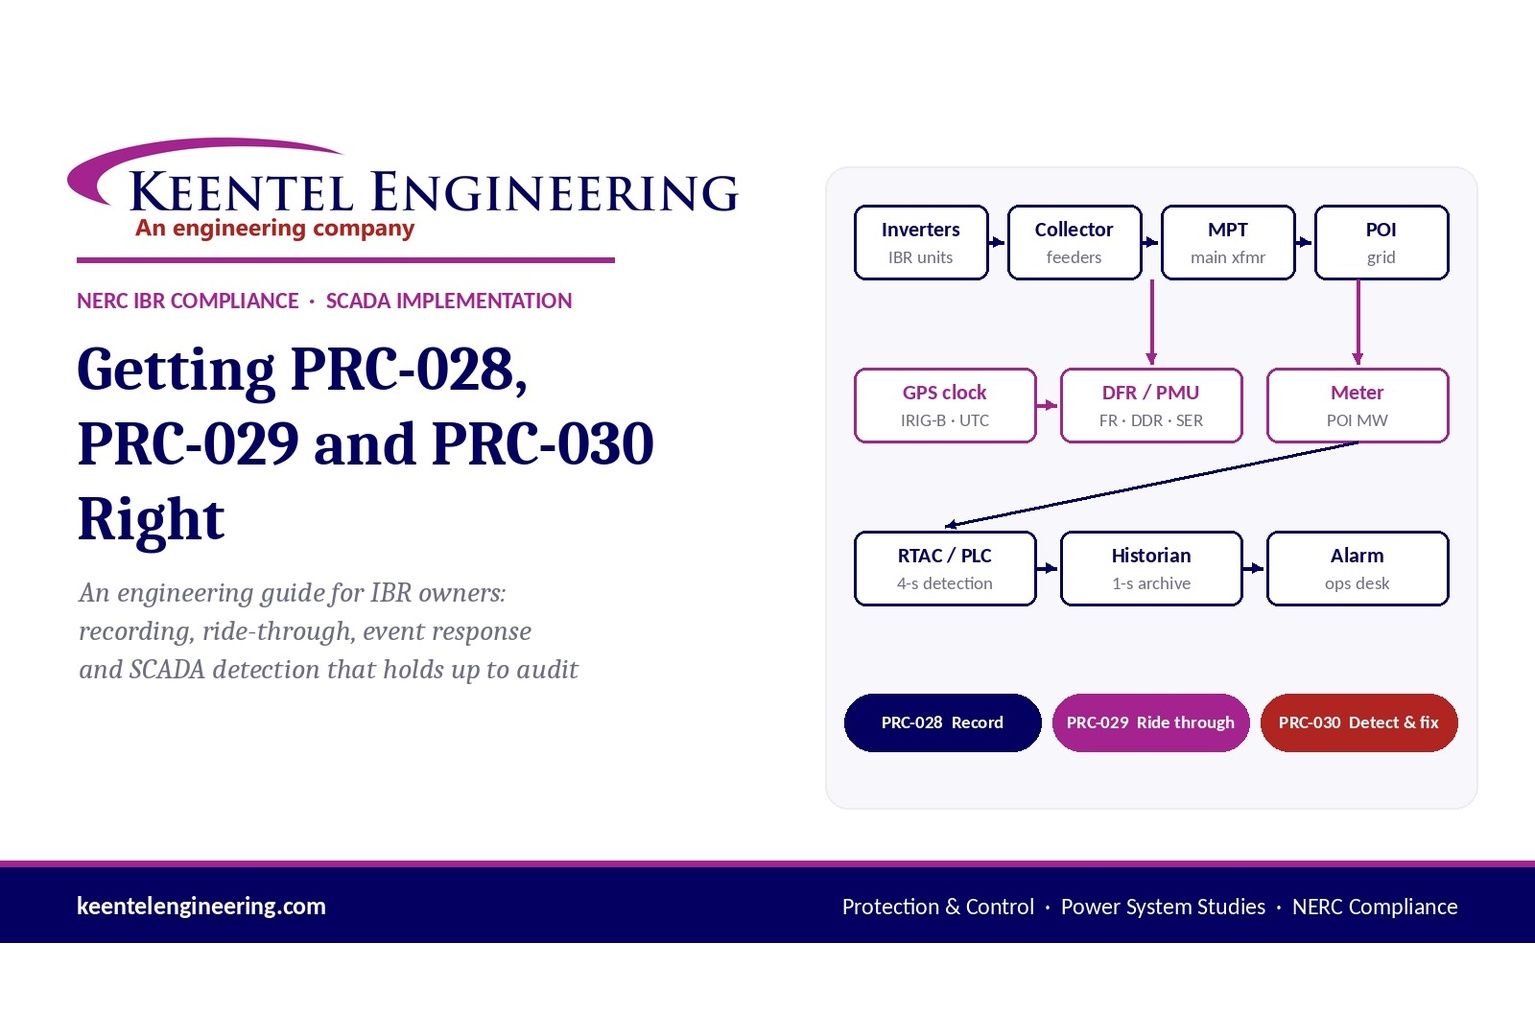
Engineering guide to PRC-028 disturbance recording, PRC-029 ride-through and PRC-030 event detection for inverter-based resources.





