A Coordinated Electric System Interconnection Review—the utility’s deep-dive on technical and cost impacts of your project.
Challenge: Frequent false tripping using conventional electromechanical relays
Solution: SEL-487E integration with multi-terminal differential protection and dynamic inrush restraint
Result: 90% reduction in false trips, saving over $250,000 in downtime
The three operating regions you have to design to
| Device | Output vs voltage | Response | Best suited to | Main limitations |
|---|---|---|---|---|
| Mechanically switched capacitor or reactor | Proportional to voltage squared | Seconds; discrete steps; limited switching operations per day | Steady-state reactive supply, voltage profile, loss reduction | No dynamic capability; step voltage change on switching; capability collapses when most needed |
| Static var compensator | Capacitive branches proportional to voltage squared | A few cycles; continuously controllable | Continuous control where cost matters and deep voltage support is not the driver | Square-law capability loss; harmonic filters are part of the plant and interact with the network |
| STATCOM | Approximately proportional to voltage — constant current capability | One to two cycles closed loop; converter response faster still | Voltage stability margin, weak interconnections, fast disturbance recovery, flicker and unbalance compensation | Higher capital cost; converter losses; adds a converter and its control dynamics to the network |
| Synchronous condenser | Governed by machine capability and excitation | Excitation response in the hundreds of milliseconds; inherent inertial response instantaneous | System strength and inertia, short-circuit contribution, black start support | Rotating plant with maintenance and losses; slower controlled response than a converter |
| STATCOM with energy storage | Reactive as a STATCOM, plus real power within the storage rating | As STATCOM for reactive; real power limited by storage | Where a real power deficiency is part of the problem | Cost and complexity of the storage; different failure and maintenance profile |
| Stage | Keentel scope | Outcome |
|---|---|---|
| Screening | Series-compensation proximity, radial contingency review, UIF and short-circuit ratio screening, frequency scans | Early identification of which SSO types apply |
| Detailed studies | PSCAD/EMTDC EMT studies with vendor real-code models, impedance-based and frequency-scan analysis | Clear evidence of stability margins or risk |
| Model quality | EMT model review, benchmarking against positive-sequence models, model acceptance support | Models that system operators accept |
| Mitigation | Control retuning recommendations with vendors, SSDC and bypass logic requirements, protection and monitoring specifications | Practical, coordinated solutions |
| Interconnection support | SSR and SSO study reports for ISO and utility requirements, response to reviewer comments | Fewer delays in the interconnection process |
Resilience: designing CDUs to the facility Tier objective
Liquid cooling makes heat removal more critical, not less. Cold plates hold only seconds of thermal buffer. If TCS flow stops, processors throttle or shut down very quickly. Resilience design must therefore cover:
- Pump redundancy: N+1 pumps at minimum, with automatic changeover.
- CDU redundancy: N+1 CDUs on a common TCS header, or 2N CDUs serving A and B manifolds for fault-tolerant designs.
- Power to CDUs: dual-corded CDUs fed from A and B sources, with pumps and controls on UPS power so coolant keeps flowing through a utility failure and generator start. This is the liquid-cooling equivalent of continuous cooling.
- Facility water continuity: chilled water or condenser water must also continue, through thermal storage, UPS-backed pumps or a high enough FWS temperature that the TCS can coast on stored thermal mass for the transfer period.
- Concurrent maintainability: isolation valves so any CDU, pump, filter or manifold section can be serviced without stopping the others.
- Leak management: leak detection, drip trays, automatic isolation valves and procedures for fluid spills.
Electrical engineering considerations
CDUs and liquid-cooling plants are electrical loads with their own design requirements:
- Pump motors and VFDs. Large CDUs use variable-frequency drives on their pump motors. These introduce harmonic current that must be included in the facility's harmonic study and IEEE 519 evaluation.
- Critical mechanical load on UPS. Putting CDU pumps on UPS increases UPS and battery sizing. The mechanical UPS load must be included in redundancy and ride-through calculations.
- Feeder and protection design. Dual feeds, automatic transfer, selective coordination and arc-flash labelling apply to CDU power distribution just as they do to IT power.
- Generator transient response. CDU pumps restarting together after a transfer create motor inrush on the generators. Staged restarts and soft acceleration reduce the step load.
- Load dynamics. AI training loads can swing rapidly between high and low power. Cooling controls must track those swings without temperature overshoot, and electrical systems must handle both the IT and the cooling load changes.
Commissioning a liquid-cooled data hall
- Flush and clean the TCS piping and manifolds to the specified cleanliness, using high-purity flush water.
- Fill and vent with the specified coolant, verifying glycol concentration and chemistry.
- Pressure test for leaks at design and test pressures, including quick-disconnect fittings.
- Verify sensors and controls: flow meters, temperature sensors, pressure transmitters, leak detection and BMS points.
- Load test with heat load banks connected through the cold-plate interfaces or rack manifolds, across the operating range.
- Prove the heat balance on both loops at several load steps, and the approach temperature against the design.
- Test failure scenarios: pump failure, CDU failure, power transfer to generator, valve failure and loss of facility water, confirming temperatures stay within the IT vendor's limits.
How Keentel Engineering helps
Keentel Engineering supports data center owners, developers and EPCs with the electrical engineering that liquid-cooled facilities depend on, and coordinates with the mechanical engineer of record and cooling vendors on the integrated design.
MOD-033-3 Model Validation: NERC Requirements, IBRs & Dynamic Studies
October 26, 2026 | Blog
Part A — MOD-033-3 Model Validation at a Glance
Every transmission plan, interconnection study and operating limit in North America rests on one assumption: that the planning model behaves like the real power system. NERC Reliability Standard MOD-033 is the requirement that forces that assumption to be tested. It requires each Planning Coordinator (PC) to compare its steady-state and dynamic planning models against what the system actually did, to decide in advance what counts as an unacceptable difference, and to fix the differences it finds.
MOD-033-3 is the third version of the standard. It was developed under NERC Project 2021-01 in response to FERC Order No. 901 on inverter-based resources (IBRs). The NERC Board of Trustees adopted it on October 31, 2025, and NERC petitioned FERC for approval on November 4, 2025. Industry reports indicate that FERC approved the Order 901 modeling package — including the MOD-032 and MOD-033 revisions and MOD-026-2 — on February 19, 2026. If the standard and both glossary definitions it depends on were approved in that action, MOD-033-3 took effect on April 1, 2026; Planning Coordinators should confirm the order and effective date for their jurisdiction. Its central message is that the planning model being validated now explicitly includes registered IBRs, IBRs that are not registered, and aggregated distributed energy resources (DERs). On a system where solar, wind and battery storage set much of the dynamic response, a model validation program that ignores them is not a model validation program.
MOD-033-3 in one table
| Element | What MOD-033-3 requires | Who |
|---|---|---|
| R1 (VRF Medium, Long-term Planning) | Implement a documented Model Validation Process for planning System models built under MOD-032, covering four attributes | Planning Coordinator |
| Part 1.1 | Compare steady-state power flow simulation with actual System behavior (state estimator cases or other Real-time data) at least once every 24 calendar months | PC |
| Part 1.2 | Compare dynamic local event simulation with actual System behavior (Real-time data such as disturbance recordings) at least once every 24 calendar months, using an event within 24 months of the last one used and completing each comparison within 24 months of the event | PC |
| Part 1.3 | Guidelines to determine unacceptable differences in performance, including those for generating facilities | PC |
| Part 1.4 | Guidelines to resolve the unacceptable differences identified | PC |
| R2 (VRF Lower) | Within 30 calendar days of a written request, provide actual System behavior data — or a written statement that the data is not held — to any PC performing Model Validation | Reliability Coordinator, Transmission Operator |
| Retention | Evidence for R1 and R2 since the last audit, unless the Compliance Enforcement Authority directs longer | All |
What changes from MOD-033-2
| Topic | MOD-033-2 | MOD-033-3 |
|---|---|---|
| Terminology | "Data validation" process | Uses the new NERC Glossary term Model Validation: comparing measurements with simulation results to assess how closely a model's behavior matches measured behavior |
| Model scope | Planning models of the existing System | Footnote makes explicit that the models include registered IBRs, aggregated DERs and IBRs that are not DERs |
| Generating facilities | Implicit | Part 1.3 guidelines must address unacceptable differences "including those for generating facilities" |
| Dynamic data source | Real-time data | Names disturbance data recordings as an example source, aligning with PRC-028-1 and PRC-002-5 |
| 24-month clocks | Started under v2 | Not reset — clocks running under MOD-033-2 carry over |
| Effective date | — | Latest of three conditions: FERC approval of the standard, of the Model Validation definition, and of the DER definition, each taking effect on the first day of the following calendar quarter |
Keentel's worked validation, in brief
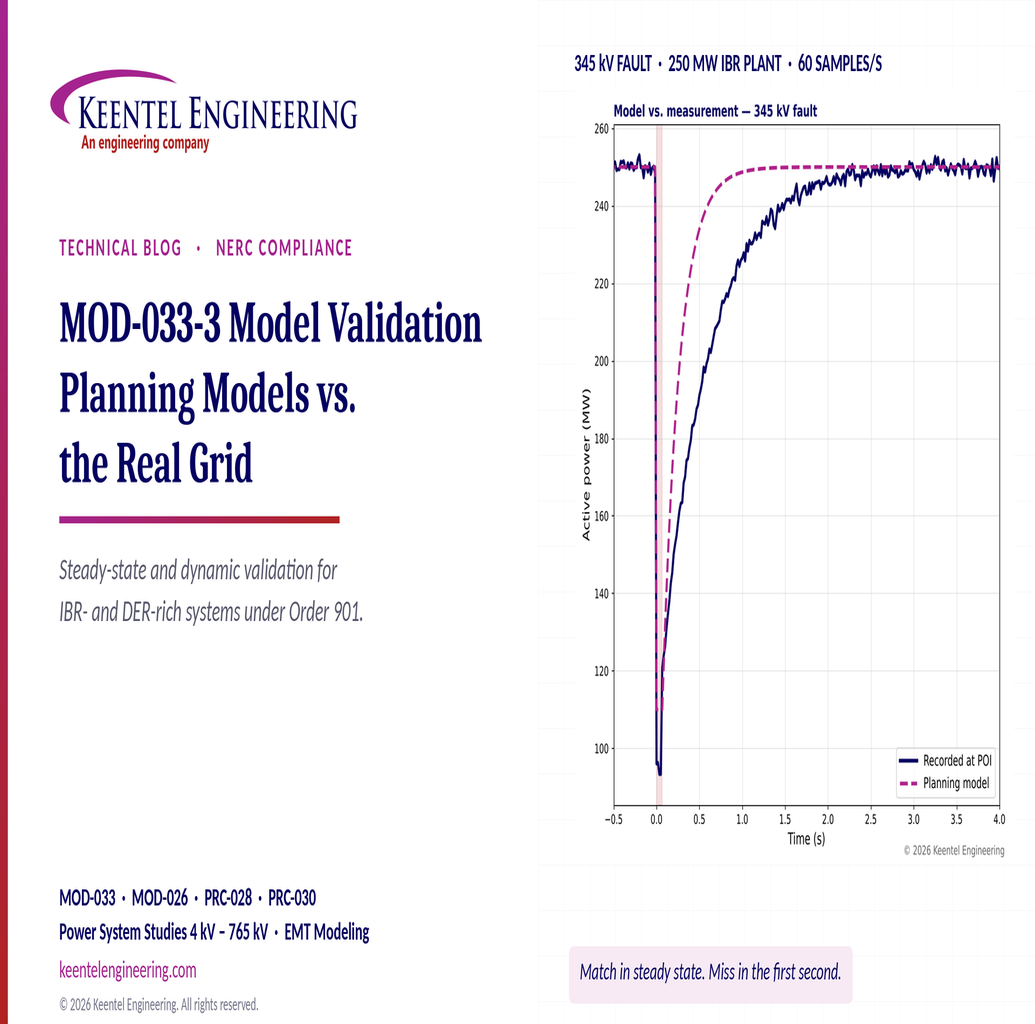
Keentel Engineering built an illustrative validation of a 250 MW IBR plant connected at 345 kV, using a 4-cycle 345 kV line fault recorded at 60 samples per second at the point of interconnection, together with a steady-state comparison of eight buses and eight branches.
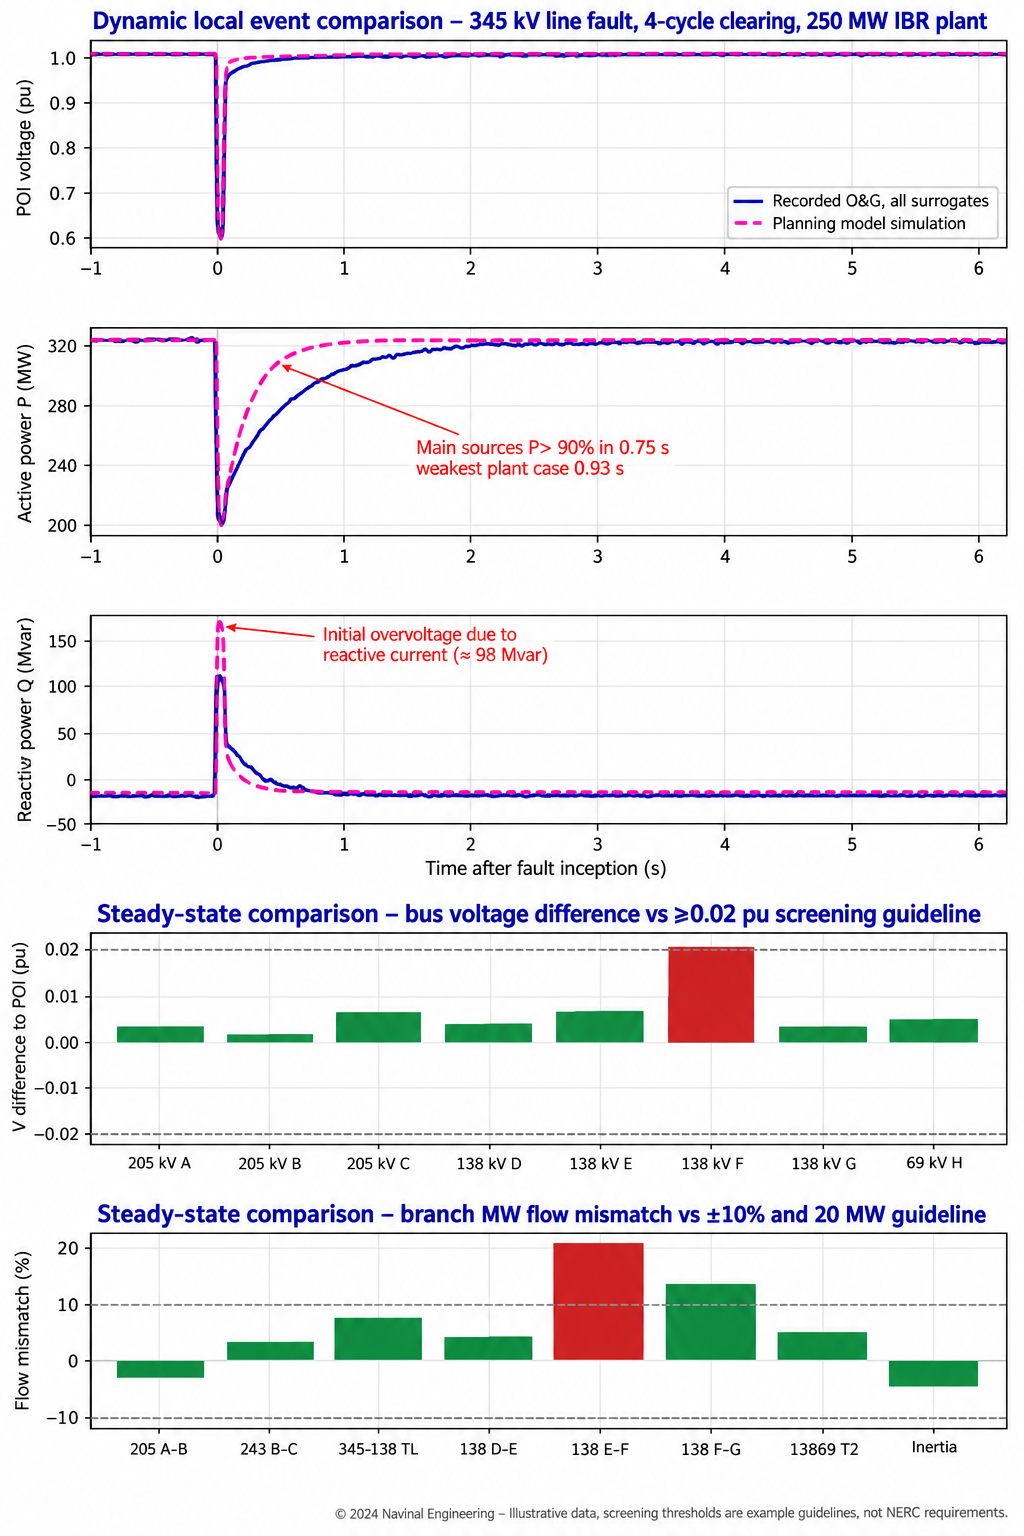
Figure 1. Keentel's illustrative MOD-033 comparisons. Top three panels: recorded versus simulated point-of-interconnection voltage, active power and reactive power after a 345 kV fault. Bottom two panels: steady-state voltage and flow differences between the planning case and a state estimator snapshot, screened against example guidelines.
| Finding | Result | Judgment against example guidelines |
|---|---|---|
| Reactive power during the fault | Model 112 Mvar vs recorded 78 Mvar (+34 Mvar, +43%) | Unacceptable — model overstates fault current support |
| Active power recovery to 90% | Model 0.35 s vs recorded 0.93 s | Unacceptable — model is optimistic on post-fault recovery |
| Settled post-fault P, Q, V | MAE 1.2 MW, 2.0 Mvar, 0.003 pu | Acceptable |
| 138 kV bus F voltage | Planning 1.010 pu vs SE 0.987 pu (+0.023 pu) | Unacceptable — exceeds ±0.02 pu |
| 138 kV branch E–F flow | Planning 118 MW vs SE 97 MW (+21.6%, +21 MW) | Unacceptable — exceeds both 10% and 20 MW |
| 138 kV branch F–G flow | +13.8% but only +8 MW | Acceptable — percentage exceeded but absolute difference is small |
The lesson is that a plant can match perfectly in steady state and still be badly wrong in the first second after a fault — exactly the period that determines whether neighboring IBRs ride through.
Five lessons
- MOD-033 is a process standard, but the process must produce engineering. Auditors check the documented process and evidence that it was implemented. Engineers need comparisons that actually find and fix model errors.
- Write the acceptance criteria before you look at the results. Part 1.3 guidelines are the heart of the standard; criteria set after a comparison look like rationalization.
- IBRs are now in scope, explicitly. Plant controller, inverter current limits, momentary cessation and ride-through logic must be validated, not assumed.
- Data is the bottleneck. R2 gives RCs and TOPs 30 days to respond, and PRC-028-1 disturbance monitoring at IBRs is still being phased in through 2030. Plan requests early.
- Track the 24-month clocks deliberately. They are event-driven for dynamics and do not reset with the version change.
Engineering review of the original article
Keentel reviewed the source draft for this guide and corrected or sharpened the following points.
| Statement in the draft | Keentel's check |
|---|---|
| "MOD-033-3 ... adopted in October 2025" | Correct — adopted October 31, 2025; filed with FERC November 4, 2025. Industry reports indicate FERC approved the MOD-032/MOD-033 package on February 19, 2026; confirm the order and resulting effective date for your jurisdiction. |
| "Effective date is the latest of three conditions" | Correct. The conditions are FERC approval of MOD-033-3, of the Model Validation definition (Project 2020-06) and of the DER definition (Project 2022-02), each effective on the first day of the next calendar quarter. |
| R1 severity depends on missing attributes and lateness | Correct. One missing attribute or up to 4 months late = Lower; 4–8 months = Moderate; 8–12 months = High; no process, not implemented or more than 12 months late = Severe. |
| Applicability of MOD-033 not spelled out | Clarified. MOD-033-3 applies to Planning Coordinators (R1) and to Reliability Coordinators and Transmission Operators (R2). Generator Owners feel its effects through MOD-026-2, MOD-027, MOD-032-2 data requests and PRC-028-1 recordings. |
| Data retention described generically | MOD-033-3 retains evidence "since the last audit" — not the three-year default used by many other standards. |
| "Dynamic comparisons every 24 months" | Incomplete. Part 1.2 uses a chained rule: the event must occur within 24 months of the last event used, and each comparison must be completed within 24 months of its event. If no event occurs, use the next one. |
Part B — MOD-033-3 Steady-State and Dynamic Model Validation: A Technical and Compliance Guide
1. Why model validation became a reliability requirement
1.1 Models are the system, until proven otherwise
Planners cannot fault a 345 kV line or trip a 1,000 MW unit to see what happens. Every study that sets a transfer limit, sizes a reactive device, approves an interconnection or defines an operating guide is done on a model. If the model is wrong, the limit is wrong, and the error is invisible until a real event exposes it.
The industry learned this lesson more than once. Post-event reviews of major disturbances over several decades found that simulations using the planning models of the day did not reproduce what actually happened: oscillations that were damped in the model grew in reality, voltages that held in the model collapsed in the field, and load models that looked conservative were not. Those findings drove FERC's Order No. 693 directives on model validation, and MOD-033-1 was developed in response. FERC approved it in May 2014.
1.2 IBRs changed what "the model" means
The rise of inverter-based resources added a new class of model error. Since 2016, NERC disturbance reports have documented repeated events in which solar PV, wind and battery plants reduced output, entered momentary cessation, or tripped during normal transmission faults — behavior that the positive-sequence planning models of those plants did not predict. Common causes included:
- phase-locked loop (PLL) loss of synchronism and instantaneous AC overvoltage trips;
- DC bus and inverter protection that the generic models did not represent;
- plant controller ramp-rate limits that slowed recovery after a fault;
- frequency measured from distorted waveforms, causing false underfrequency trips;
- momentary cessation that was configured differently in the field than in the submitted model.
In 2025, NERC issued a Level 3 Alert on IBR performance and modeling. It found that many submitted IBR models did not match the as-built equipment or the field performance, and it required owners and planners to take essential actions. FERC Order No. 901 (October 19, 2023) had already directed NERC to develop standards for IBR disturbance monitoring, ride-through, performance analysis and mitigation, data sharing, and model validation. MOD-033-3 is part of that last milestone.
1.3 Model validation versus model verification
Two related activities are often confused.
| Activity | Question it answers | Main standards | Who |
|---|---|---|---|
| Unit model verification | Does this generator's model match tests or recordings of this unit? | MOD-026-2, MOD-027-1, MOD-025-2 |
Generator Owner, with Transmission Planner review |
| System model validation | Does the interconnection-wide planning model reproduce actual system behavior? | MOD-033-3 | Planning Coordinator, supported by RC and TOP data |
| Model data submission | Are the data needed to build the model provided correctly? | MOD-032-2 | GO, TO, LSE, Resource Planner and others to PC and TP |
Unit verification is necessary but not sufficient. A system can be built from individually verified unit models and still fail validation — because of topology errors, load models, DER aggregation, protection actions, or interactions that no single unit test can reveal. MOD-033 closes that loop.
2. The NERC framework behind MOD-033-3
2.1 NERC, FERC and the Regional Entities
NERC is the Electric Reliability Organization certified by FERC in 2006 under Section 215 of the Federal Power Act. It develops Reliability Standards, and once FERC approves them they become mandatory and enforceable for registered entities in the United States. Six Regional Entities — MRO, NPCC, ReliabilityFirst, SERC, Texas RE and WECC — monitor and enforce compliance under delegation agreements. NERC and the Regional Entities together are known as the ERO Enterprise. Canadian provinces adopt standards through their own regulatory processes, which is why effective dates can differ by jurisdiction.
2.2 How a standard is made
A standard begins as a Standard Authorization Request. The Standards Committee accepts the project, a drafting team develops the language, and drafts are posted for comment and balloted by industry segment. Approval requires a two-thirds weighted segment majority with at least 75% quorum. The NERC Board of Trustees then adopts the standard, and NERC files it with FERC. FERC can approve it, remand it, or approve it and direct further changes.
2.3 The anatomy of a standard
| Section | What it tells you | MOD-033-3 example |
|---|---|---|
| Purpose | Why the standard exists | Establish consistent validation requirements so that planning models accurately represent System behavior |
| Applicability | Which functional entities and Facilities | PC; RC; TOP |
| Requirements (R) | The enforceable obligations, often with Parts | R1 with Parts 1.1–1.4; R2 |
| Violation Risk Factor (VRF) | Reliability impact if violated: Lower, Medium, High | R1 Medium; R2 Lower |
| Time Horizon | When the obligation applies | Long-term Planning |
| Measures (M) | Examples of acceptable evidence | Documented process and evidence of implementation; dated communications |
| Evidence retention | How long to keep proof | Since the last audit, unless directed longer |
| Violation Severity Levels (VSL) | How far performance deviated | Graded by missing attributes and lateness |
| Implementation Plan | Effective date and transition | Latest of three FERC approvals; clocks not reset |
| Technical Rationale | Drafting team's intent (not enforceable) | Explains why IBRs and DERs are named |
2.4 Reading the implementation plan
The implementation plan is as binding on dates as the standard is on obligations. For MOD-033-3, the effective date is the later of three dates:
- the first day of the first calendar quarter after the effective date of the order approving MOD-033-3;
- the first day of the first calendar quarter after the effective date of the order approving the Model Validation definition; and
- the first day of the first calendar quarter after the effective date of the order approving the Distributed Energy Resource definition.
MOD-033-2 retires immediately before MOD-033-3 takes effect in each jurisdiction. Because the drafting team judged the revisions not to change the substance of the periodic obligations, the 24-month clocks in Parts 1.1 and 1.2 are not reset: a comparison completed under MOD-033-2 still counts toward the next due date.
Worked example — effective date. Suppose the orders approving MOD-033-3 and the Model Validation definition both become effective in February 2026, but the DER definition is approved in an order effective in August 2026. The candidate dates are April 1, 2026, April 1, 2026 and October 1, 2026. The latest — October 1, 2026 — governs. If all three approvals take effect in February 2026 — as industry reports of FERC's February 19, 2026 action on the modeling package suggest — the effective date is April 1, 2026. Confirm the actual order dates before you finalize a compliance calendar.
3. MOD-033-3, requirement by requirement
3.1 R1 — the documented Model Validation process
R1 requires each PC to implement a documented Model Validation process for the planning System models it develops under MOD-032, representing its portion of the existing System. Two words carry the weight: "documented" and "implement." A procedure that is written but never followed fails R1 at the Severe level; comparisons performed without a documented process fail too.
The process must contain four attributes. Each is an audit test.
3.2 Part 1.1 — steady-state comparison
The PC must compare the power flow simulation performance of the steady-state planning model with actual System behavior, represented by state estimator cases or other Real-time data, at least once every 24 calendar months.
The comparison is not simply "load the planning case and look." A planning case represents a forecast condition — a seasonal peak, an off-peak, a stressed transfer. The state estimator snapshot represents one actual moment. To compare them fairly the PC must make the planning model represent the same moment:
- Select a snapshot — typically a high-load or high-transfer hour with good state estimator convergence and low residuals.
- Match topology: line and transformer outages, breaker status, bus splits and switched shunt status.
- Match injections: generator dispatch, including IBR output at the snapshot time; loads by bus or area; interchange schedules; DER output where it is significant.
- Match control settings: generator voltage schedules, transformer taps, phase shifters and HVDC orders.
- Solve, and compare bus voltages, branch flows, generator reactive output, interface flows and phase angles.
The quality of the comparison depends on the mapping between the node-breaker operations model and the bus-branch planning model. Mapping errors — a bus in the energy management system that does not exist in the planning model, or a generator mapped to the wrong bus — are among the most common causes of apparent mismatch.
3.3 Part 1.2 — dynamic local event comparison
The PC must compare the dynamic local event simulation performance of the dynamic planning model with actual System behavior, represented by Real-time data such as disturbance recordings, at least once every 24 calendar months. The timing rule is chained:
- the event used must occur within 24 calendar months of the last dynamic local event used in a comparison;
- each comparison must be completed within 24 calendar months of the event; and
- if no dynamic local event occurs within the 24-month period, the PC uses the next one that occurs.
A dynamic local event is a disturbance on the power system that produces a measurable transient response — a fault and line trip, a generator trip, a large load loss, or a reactive device switching event. The Technical Rationale for the original standard explained that "local" was chosen deliberately: a PC's comparison does not require a full interconnection-wide event, only one that excites dynamics in its own area.
Worked example — the dynamic clock. The last event used was a 345 kV line fault on March 10, 2024.
| Step | Date | Rule |
|---|---|---|
| Last event used | March 10, 2024 | Starting point |
| Latest date for the next event to be used | March 10, 2026 | Within 24 months of the last event |
| Event selected | November 2, 2025, 230 kV generator trip | Occurs within the window |
| Comparison due | November 2, 2027 | Within 24 months of that event |
| Next event must occur by | November 2, 2027 | Within 24 months of the November 2025 event |
If no suitable event had occurred between March 2024 and March 2026, the PC would use the first one after March 10, 2026 and complete its comparison within 24 months of that event. The register of candidate events — date, location, recordings available, suitability — is therefore an essential compliance record.
3.4 Part 1.3 — guidelines for unacceptable differences
The PC must have guidelines to determine unacceptable differences in performance under Parts 1.1 and 1.2, including those for generating facilities. The standard does not set numerical thresholds; the PC must. That is deliberate — tolerances depend on the purpose of the model, the measurement quality and the system — but it means the PC's own guidelines become the yardstick an auditor will use.
Good guidelines have four properties:
- quantitative — numerical thresholds, not "reasonable agreement";
- dual-criterion where appropriate — percentage and absolute, so that small flows do not trigger false alarms and large flows do not hide large errors;
- windowed for dynamics — separate criteria for pre-disturbance, during-fault, post-fault transient and settled periods;
- specific to generating facilities — including IBR criteria for reactive current during faults, active power recovery and ride-through.
3.5 Part 1.4 — guidelines to resolve differences
The PC must also have guidelines to resolve the unacceptable differences it finds. A good resolution procedure states who investigates, how root causes are classified, how data requests are issued to model owners under MOD-032, how corrections are tracked to closure, and how the corrected model is re-validated. It should distinguish between differences the PC can correct itself (topology, load allocation) and those that require a Generator Owner or Transmission Owner to submit revised data.
3.6 R2 — data from the RC and TOP
Each RC and TOP must, within 30 calendar days of a written request, provide actual System behavior data — or a written response that it does not have the data — to any PC performing Model Validation under R1. The obligation is to respond, not to create data that does not exist; but the Severe VSL applies if the entity fails to provide data it actually had.
Worked example — R2 timing. A PC sends a written request on March 3. The response is due April 2.
| Response date | Days late | R2 VSL |
|---|---|---|
| March 28 | 0 | Compliant |
| April 14 | 12 | Lower (up to 15 days) |
| April 20 | 18 | Moderate (more than 15, up to 30) |
| May 10 | 38 | High (more than 30, up to 45) |
| May 25, or never, with data held | 53+ | Severe |
3.7 Violation severity levels for R1
| VSL | Missing attributes | Comparison lateness (Parts 1.1 or 1.2) |
|---|---|---|
| Lower | One of the four | Up to 4 calendar months late |
| Moderate | Two | More than 4, up to 8 months late |
| High | Three | More than 8, up to 12 months late |
| Severe | No documented process, or not implemented | More than 12 months late |
Worked example. The last steady-state comparison was completed on August 15, 2024, so the next is due by August 15, 2026. A comparison completed on January 20, 2027 is about five months late — Moderate. Combined with a missing Part 1.4 resolution guideline, the most severe applicable level still governs the requirement-level VSL: Moderate, unless other gaps raise it.
4. Quantifying the difference: validation metrics
4.1 The error signal
Every comparison starts with an error signal: the difference between the simulated and measured value of a quantity at matching times.

For steady-state comparisons, k indexes buses or branches. For dynamic comparisons, k indexes time samples, after the simulated and measured signals have been aligned in time and resampled to a common rate.
4.2 Core metrics
Three metrics cover most needs. Mean absolute error measures typical agreement:
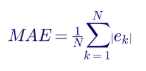
Root mean square error weights large errors more heavily:
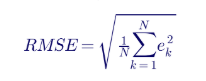
Peak absolute error captures the worst instant:

For branch flows, a percentage mismatch relative to the measured flow is more meaningful than an absolute value:
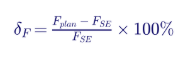
A dual criterion avoids flagging small flows with large percentage errors:

The 10% and 20 MW values are examples Keentel uses for screening; each PC must set and justify its own.
4.3 Worked example — steady-state comparison
A PC compares its summer planning case, adjusted to a state estimator snapshot taken at 17:00 on a peak July day, at eight buses and eight branches. The example guidelines are ±0.02 pu for voltage, and 10% and 20 MW for flows.
| Bus | SE voltage (pu) | Planning voltage (pu) | Difference (pu) | Result |
|---|---|---|---|---|
| 345 kV A | 1.021 | 1.025 | +0.004 | Acceptable |
| 345 kV B | 1.018 | 1.020 | +0.002 | Acceptable |
| 345 kV C | 1.006 | 1.012 | +0.006 | Acceptable |
| 138 kV D | 1.012 | 1.016 | +0.004 | Acceptable |
| 138 kV E | 0.998 | 1.004 | +0.006 | Acceptable |
| 138 kV F | 0.987 | 1.010 | +0.023 | Unacceptable |
| 138 kV G | 1.004 | 1.007 | +0.003 | Acceptable |
| 69 kV H | 0.979 | 0.983 | +0.004 | Acceptable |
Voltage MAE across the eight buses is 0.0065 pu, and RMSE is 0.0091 pu. The average looks excellent; the outlier at bus F does not. This is why guidelines must be applied element by element, not only on averages.
| Branch | SE flow (MW) | Planning flow (MW) | Difference (MW) | Mismatch (%) | Result |
|---|---|---|---|---|---|
| 345 kV A–B | 612 | 598 | −14 | −2.3 | Acceptable |
| 345 kV B–C | 438 | 452 | +14 | +3.2 | Acceptable |
| 345/138 kV T1 | 221 | 236 | +15 | +6.8 | Acceptable |
| 138 kV D–E | 164 | 171 | +7 | +4.3 | Acceptable |
| 138 kV E–F | 97 | 118 | +21 | +21.6 | Unacceptable |
| 138 kV F–G | 58 | 66 | +8 | +13.8 | Acceptable (below 20 MW) |
| 138/69 kV T2 | 41 | 43 | +2 | +4.9 | Acceptable |
| Interface | 880 | 842 | −38 | −4.3 | Acceptable |
Diagnosis. The two failures are adjacent: bus F voltage is high in the model and the E–F flow is high. Keentel's investigation path would check, in order, (1) the status of a 138 kV capacitor bank at F — a bank in service in the model but switched off in the field explains both symptoms; (2) load allocation at F, since an understated load raises voltage and changes flows; and (3) a 34.5 kV-connected solar plant near F whose output in the planning case was set to its seasonal value rather than its actual output at 17:00. In this illustration the cause was the capacitor status: the planning case had carried forward a seasonal switching assumption that operators no longer used.
4.4 Preparing a dynamic comparison
Dynamic comparison of a system event is harder than steady-state comparison because the initial conditions, the disturbance and the protection actions must all be reproduced. Keentel uses a structured sequence:
- Select the event from the event register: a fault with known location, type and clearing time, or a unit trip with known MW.
- Collect data: sequence-of-events records, fault recordings and dynamic disturbance recordings from PRC-002-5 and PRC-028-1 devices, phasor measurement units, and SCADA for the pre-disturbance state.
- Build the initial condition from the state estimator snapshot closest to the event, as for Part 1.1.
- Reproduce the disturbance: apply the fault with the recorded impedance and clearing time; trip the elements that tripped, at the recorded times.
- Simulate with the planning dynamic database, without tuning.
- Compare at the recorded locations, in defined windows, using the agreed metrics.
- Diagnose and resolve under Part 1.4.
Two techniques make the analysis more powerful.
System-level simulation tests the whole model.
Play-in (or playback) simulation drives one plant model with the recorded point-of-interconnection voltage and frequency, isolating that plant's model from errors elsewhere in the system. Play-in is the standard technique for unit verification under MOD-026-2, and it is the fastest way to decide whether a system-level mismatch is caused by a particular generator.
4.5 Comparison windows
IBR responses have distinct phases, and a single error metric over the whole record hides them. Keentel uses four windows, consistent with international practice for wind and solar model validation:
| Branch | SE flow (MW) | Planning flow (MW) | Difference (MW) | Mismatch (%) | Result |
|---|---|---|---|---|---|
| 345 kV A–B | 612 | 598 | −14 | −2.3 | Acceptable |
| 345 kV B–C | 438 | 452 | +14 | +3.2 | Acceptable |
| 345/138 kV T1 | 221 | 236 | +15 | +6.8 | Acceptable |
| 138 kV D–E | 164 | 171 | +7 | +4.3 | Acceptable |
| 138 kV E–F | 97 | 118 | +21 | +21.6 | Unacceptable |
| 138 kV F–G | 58 | 66 | +8 | +13.8 | Acceptable (below 20 MW) |
| 138/69 kV T2 | 41 | 43 | +2 | +4.9 | Acceptable |
| Interface | 880 | 842 | −38 | −4.3 | Acceptable |
4.6 Worked example — dynamic comparison of a 250 MW IBR plant
A 345 kV line fault, cleared in 4 cycles (67 ms), depressed the point-of-interconnection voltage of a 250 MW solar-plus-storage plant to 0.62 pu. A PRC-028-1 dynamic disturbance recorder captured voltage, active power and reactive power at 60 records per second. The planning model is a positive-sequence generic renewable model (REGC/REEC/REPC family) submitted under MOD-032.
| Window | P: MAE / peak / RMSE (MW) | Q: MAE / peak / RMSE (Mvar) | V: MAE / peak / RMSE (pu) |
|---|---|---|---|
| Pre-disturbance | 0.9 / 3.1 / 1.1 | 2.0 / 4.2 / 2.2 | 0.003 / 0.007 / 0.003 |
| During fault | 15.3 / 16.7 / 15.3 | 33.6 / 35.1 / 33.6 | 0.019 / 0.021 / 0.019 |
| Post-fault transient | 21.4 / 44.5 / 25.4 | 3.3 / 13.4 / 4.7 | 0.005 / 0.043 / 0.009 |
| Post-fault settled | 1.2 / 4.8 / 1.6 | 2.0 / 4.2 / 2.2 | 0.003 / 0.008 / 0.004 |
Against example guidelines of ±10% of rated output for P and Q during the fault and transient windows, and ±5% in the settled window, the model passes in the pre-disturbance and settled windows and fails in the two windows that matter most for system stability.
Fault reactive current. Reactive current is a better comparison quantity than reactive power during a fault, because voltage is depressed.
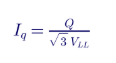
The recorded 78 Mvar at 0.62 × 345 kV = 213.9 kV gives about 211 A. The plant's rated current at 345 kV, for a 275 MVA inverter rating, is:
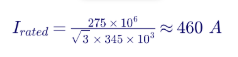
So the recorded reactive current is about 0.46 pu. The model's 112 Mvar at 0.60 pu (207 kV) gives 312 A, or 0.68 pu — about 48% higher. With a voltage dip of about 0.39 pu from the pre-fault value, the effective reactive current gain is
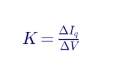
about 1.2 in the field and about 1.6 in the model. The model's gain parameter (Kqv) or current limit does not match the commissioned settings.
Active power recovery. The model recovers to 90% of pre-fault output in 0.35 s; the plant took 0.93 s. Slower field recovery commonly results from a ramp-rate limit on active current recovery after a fault, or from a plant controller that freezes and then reinitializes. Neither the ramp-rate limit nor the freeze logic was set correctly in the submitted model.
Why it matters. A planning model that overstates fault reactive current and active power recovery is optimistic: it predicts better voltage support and faster frequency recovery than the system will see. In a weak area with several IBR plants, optimistic models can hide a voltage stability or ride-through problem until a real event exposes it.
Resolution under Part 1.4. The PC issues a MOD-032 data request to the Generator Owner asking for revised dynamic parameters, cross-referenced to the plant's MOD-026-2 verification and as-commissioned inverter and plant controller settings. After the update, the play-in comparison is repeated; with Kqv reduced and the post-fault ramp-rate limit represented, the errors fall within the guidelines.
4.7 Measurement and alignment issues
Model mismatch is only meaningful if the measurement is trustworthy. Points to check before blaming the model:
- Time alignment. Align on fault inception, using synchronized timestamps. PRC-028-1 requires plant-level clocks within ±1 ms of UTC.
- Sampling and filtering. Dynamic disturbance recorders report RMS or phasor quantities at 30 or 60 records per second; fault recorders capture point-on-wave at 64 samples per cycle or more. Phasor estimates during the first cycle after a fault are distorted; exclude a short guard band or compare on a matching filter.
- Measurement location. A recording on the low side of the main power transformer is not the same as one at the point of interconnection; account for the transformer and any gen-tie.
- Sign conventions. Generator versus load convention for P and Q is a frequent source of apparent "errors."
- Positive-sequence limitations. Positive-sequence RMS models cannot reproduce unbalanced-fault negative-sequence behavior, sub-cycle current limiting or PLL loss of synchronism. When these matter, compare with an electromagnetic transient (EMT) model in a tool such as PSCAD.
5. Inverter-based resources and DERs in MOD-033-3
5.1 What the footnote changes
MOD-033-3's footnote states that the planning System models include registered IBRs and aggregated DERs, as well as IBRs that are not DERs. In practice this means:
- the Part 1.3 guidelines must have criteria that apply to IBR plants, not only to synchronous units;
- dynamic comparisons should be planned to capture IBR response, which means selecting events and recording locations where IBR plants were exposed to measurable voltage or frequency disturbances;
- aggregated DER — modeled in the planning case, typically with the DER_A model — must be part of the validation, even though DER output is rarely measured directly.
5.2 Validating aggregated DER
DER validation is indirect. The PC cannot record every rooftop inverter, but it can compare the net load measured at the transmission-distribution interface during a disturbance with the simulated net load. A key indicator is "load loss" after a fault: if net load drops sharply and recovers over seconds to minutes, DER tripping or momentary cessation is a likely contributor.
Worked example — DER net load. A 138 kV substation serves 180 MW of gross load and has an estimated 45 MW of DER output at the time of a nearby 138 kV fault. The recorded net load before the fault is 135 MW. Ten seconds after the fault, the net load is 153 MW — an increase of 18 MW. If load itself is unchanged, the increase implies that about 18 MW, or 40%, of DER output tripped or did not recover. If the DER_A model in the planning case predicts only 5 MW of DER loss, the model's voltage trip and momentary cessation parameters are too optimistic, and the PC's resolution guideline should direct the DER parameters to be updated — typically in coordination with the distribution provider and with the IEEE 1547 category settings actually applied to DER in that area.
5.3 IBR-specific acceptance criteria
| Quantity | Window | Example guideline |
|---|---|---|
| Reactive current during fault | During fault | Within ±10% of rated current |
| Active current during fault | During fault | Within ±10% of rated current |
| Momentary cessation | During fault | Model and field agree on whether it occurred |
| Active power recovery time to 90% | Post-fault transient | Within ±20% or ±0.2 s, whichever is larger |
| Voltage overshoot after clearing | Post-fault transient | Within ±0.02 pu |
| Settled P and Q | Post-fault settled | Within ±5% of rated |
| Plant trip or output reduction | Whole event | Model and field agree on whether it occurred; any unexplained difference is unacceptable |
These are illustrative. Each PC should set its own values, document the reasoning and apply them consistently.
5.4 When positive-sequence models are not enough
For weak-grid areas — short-circuit ratio below about 3 — and for events involving controller interactions, sub-synchronous oscillations or PLL instability, positive-sequence models may not reproduce field behavior at all. Validation then needs EMT models. Many Transmission Planners now require EMT models with interconnection requests, and MOD-032-2 and the Order 901 modeling standards move in the same direction. A PC's Part 1.4 guidelines can specify when an EMT comparison is required.
6. Data for validation: where it comes from and how to get it
6.1 Data sources
| Source | Standard or practice | Typical resolution | Use in MOD-033 |
|---|---|---|---|
| State estimator snapshots | RC and TOP Real-time operations (TOP-003, IRO-010 data specifications) | One solution every 1–5 minutes | Part 1.1 initial conditions and comparison |
| SCADA | Operations | 2–10 s scan | Pre-event state, slower dynamics, DER net load |
| Sequence-of-events recorders | PRC-002-5 (BES buses), PRC-028-1 (IBRs) | 1 ms timestamp | Breaker timing, protection actions, inverter fault codes |
| Fault recorders | PRC-002-5, PRC-028-1 (≥64 samples per cycle) | Point-on-wave | Fault type, location, clearing time, IBR fault current |
| Dynamic disturbance recorders and PMUs | PRC-002-5, PRC-028-1 (≥960 samples per second input, ≥60 records per second output) | 30–60 records per second | Part 1.2 dynamic comparison |
| Plant data historians and inverter logs | GO practice; PRC-030-1 analysis | Varies | Explaining IBR responses |
6.2 The IBR data gap
PRC-028-1 became effective on April 1, 2025, but existing BES IBRs have until January 1, 2030 to reach 100% compliance, with 50% of them due earlier. PRC-002-5 removed IBRs from its scope. Until PRC-028-1 is fully implemented, many IBR plants will have limited high-resolution recording at the point of interconnection. A PC planning dynamic comparisons that involve IBRs should identify which plants have compliant recorders today and request data from Generator Owners and TOPs early.
6.3 Writing a good R2 request
R2 obliges the RC and TOP to respond within 30 days, but the quality of the response depends on the quality of the request. A good request specifies:
- the event or snapshot, with date and time to the second (UTC);
- the quantities wanted — for example, positive-sequence voltage, active and reactive power, frequency;
- the locations — named buses, lines or plants;
- the time window, such as 10 s before to 60 s after the event;
- the preferred format — IEEE C37.111 COMTRADE or CSV with headers, and file naming per IEEE C37.232;
- the reference to MOD-033-3 R2 and the response date.
Log each request with its date sent, due date, response received and content. That log is the PC's proof that its process obtained data, and the RC or TOP's proof that it responded.
6.4 Data from entities R2 does not cover
R2 applies only to RCs and TOPs. Data held by Generator Owners, Transmission Owners and Distribution Providers is obtained through MOD-032-2 data requirements, PRC-028-1 R7 (data must be provided within 15 calendar days of a request from the PC and others), interconnection agreements and tariff provisions. The PC's documented process should list each source and the mechanism used to obtain it.
7. How MOD-033-3 fits with other standards
7.1 The modeling and validation family
| Standard | Purpose | Link to MOD-033-3 |
|---|---|---|
| MOD-032-2 | Data for power system modeling and analysis; revised for IBRs and DERs under Order 901 | Defines the planning models that MOD-033 validates |
| MOD-026-2 | Verification of dynamic models and data for generators, including IBRs; replaces MOD-026-1 and MOD-027-1 | Supplies verified unit models; corrects unit-level errors found by MOD-033 |
| MOD-025-2/-3 | Verification of real and reactive power capability | Ensures capability limits in planning cases are correct |
| TPL-001 | Transmission system planning performance | Consumes the validated models |
| FAC-002 | Interconnection studies | Uses models before a plant is built; MOD-033 tests them after |
| TOP-003 and IRO-010 | Operational data specifications | Source of state estimator and real-time data |
7.2 The IBR performance family
| Standard | Purpose | Link to MOD-033-3 |
|---|---|---|
| PRC-028-1 | Disturbance monitoring at IBRs | Provides the recordings for dynamic comparison |
| PRC-002-5 | Disturbance monitoring at non-IBR BES elements | Provides system-side recordings |
| PRC-029-1 | IBR frequency and voltage ride-through | Defines expected IBR behavior that the model must represent |
| PRC-024-4 | Protection settings for synchronous generators, Type 1 and 2 wind, synchronous condensers | Defines non-IBR trip boundaries |
| PRC-030-1 | Unexpected IBR event analysis and mitigation | Root-cause analyses often reveal model errors |
| PRC-019-2 | Coordination of voltage controls, limiters and protection | Ensures controller limits in models match field settings |
7.3 The value of one data architecture
The standards interlock. A recorder installed for PRC-028-1 produces data for a PRC-030-1 analysis, a MOD-026-2 verification and a MOD-033-3 comparison. A plant controller setting reviewed under PRC-019-2 must match the model submitted under MOD-032-2. Organizations that build one data and model management architecture for all of these — rather than one per standard — spend less and find more.
8. Building a compliance program around MOD-033-3
8.1 Compliance monitoring under the CMEP
The Compliance Monitoring and Enforcement Program (Appendix 4C to the NERC Rules of Procedure) defines how compliance is monitored. Its methods include compliance audits, spot checks, self-certifications, self-reports, self-logging where allowed, periodic data submittals, complaints and compliance investigations. MOD-033-3 is most often examined in audits of Planning Coordinators and through self-certifications.
8.2 Risk-based oversight
The ERO Enterprise tailors oversight to risk. An Inherent Risk Assessment evaluates the risk from an entity's functions and facilities. A Compliance Oversight Plan sets the monitoring planned for the entity. An evaluation of internal controls examines how the entity identifies, assesses and corrects compliance issues. A PC that can show strong controls — a validation calendar, an event register, a request log, a review of each comparison by a second engineer — is in a better position to have its oversight scoped accordingly.
8.3 Self-reports, mitigation and penalties
An entity that discovers a possible noncompliance can self-report it. Lower-risk issues may be resolved through streamlined dispositions such as compliance exceptions or Find, Fix, Track and Report; more serious matters proceed to a notice of alleged violation and a penalty or settlement. A mitigation plan describes the issue, root cause, corrective and preventive actions, milestones and completion evidence.
Penalties follow the NERC Sanction Guidelines (Appendix 4B). The VRF and VSL set a base penalty range, which is then adjusted for duration, compliance history, self-reporting, self-correction, cooperation and actual or potential risk. For MOD-033-3 R1 (Medium VRF), a comparison more than 12 months late is Severe, and timely self-reporting with credible mitigation is the most effective way to reduce the outcome.
8.4 The MOD-033-3 evidence package
| Evidence | Supports | Keentel practice |
|---|---|---|
| Documented Model Validation process, version-controlled and approved | R1 and all four attributes | Map each section of the procedure to Parts 1.1–1.4 in a cross-reference table |
| Validation calendar with due dates | Parts 1.1 and 1.2 | Set internal targets 6 months ahead of the 24-month limits |
| Event register | Part 1.2 | Record every candidate event and the selection decision |
| Steady-state comparison reports | Part 1.1 | Include snapshot time, mapping log, adjustments and results against guidelines |
| Dynamic comparison reports | Part 1.2 | Include data sources, alignment method, window metrics and conclusions |
| Guidelines for unacceptable differences | Part 1.3 | Quantitative, with IBR and DER criteria |
| Resolution log | Part 1.4 | Each difference, root cause, data request, correction and re-validation |
| R2 request and response log | R2 | Dated requests and responses; follow-ups |
8.5 What "documented" and "implemented" mean to an auditor
An auditor tests two things. First, does the document contain every required attribute? Second, is there evidence the entity did what the document says, within the required time? A procedure that says "the PC will compare models at least every 24 months" but has no dated comparison report fails implementation. A comparison report that does not reference any guidelines fails Part 1.3 in practice even if guidelines exist somewhere. Cross-reference everything.
8.6 Retention
MOD-033-3 requires evidence for R1 and R2 since the last audit, unless the Compliance Enforcement Authority directs longer retention as part of an investigation. Because a 24-month dynamic clock can span an audit cycle, Keentel recommends keeping at least the two most recent comparisons of each type, the event register for the full period and all R2 correspondence, regardless of audit timing.
9. Audit readiness checklist for Planning Coordinators
| # | Check | Status to target |
|---|---|---|
| 1 | Procedure addresses Parts 1.1, 1.2, 1.3 and 1.4 explicitly | Cross-reference table in the procedure |
| 2 | Procedure states that models include registered IBRs, non-DER IBRs and aggregated DERs | Aligned with the MOD-033-3 footnote |
| 3 | Last steady-state comparison date and next due date | At least 6 months of margin |
| 4 | Last dynamic event used, its date and the comparison completion date | Within the chained 24-month rule |
| 5 | Event register current | Updated monthly |
| 6 | Guidelines are quantitative and include generating-facility criteria | Documented values and rationale |
| 7 | Every unacceptable difference has a resolution record | Closed or with a dated plan |
| 8 | R2 requests logged with responses | Complete |
| 9 | Transition from MOD-033-2 documented | Clock carry-over explained |
| 10 | Staff can explain the process in interview | Rehearsed |
10. A practical implementation roadmap
| Phase | Duration | Activities |
|---|---|---|
| 1. Gap assessment | 4–6 weeks | Compare the existing MOD-033-2 process with MOD-033-3; review the last comparisons; inventory data sources |
| 2. Procedure update | 4–8 weeks | Add the Model Validation term, IBR and DER scope, generating-facility criteria and resolution guidelines |
| 3. Data architecture | 2–6 months | Map recorders, PMUs and historians; set up the request log; agree formats with RCs, TOPs and GOs |
| 4. Pilot comparisons | 2–4 months | One steady-state and one dynamic comparison under the new process, including at least one IBR plant |
| 5. Resolution | Ongoing | Issue model correction requests; track to closure; re-validate |
| 6. Internal controls | Ongoing | Calendar alerts, peer review, annual self-assessment |
11. Common misconceptions corrected
| Misconception | Reality |
|---|---|
| "MOD-033 is only for the PC, so generators can ignore it." | Generator Owners provide the models and data. Unacceptable differences at their plants lead to data requests under MOD-032-2 and verification under MOD-026-2. |
| "A good average error means the model is valid." | Averages hide outliers; guidelines must be applied element by element and window by window. |
| "Steady-state agreement proves the dynamic model." | The worked example shows a plant matching within 1% in steady state and failing badly in the first second after a fault. |
| "The 24-month dynamic clock resets with each new standard version." | The MOD-033-3 implementation plan says the clocks are not reset. |
| "If no event happens, there is nothing to do." | The PC uses the next event that occurs; it must keep looking and record its search. |
| "The standard gives the tolerances." | It does not; the PC must set and justify them. |
| "R2 requires RCs and TOPs to create data." | It requires them to provide data they have, or say in writing that they do not. |
| "DER cannot be validated." | Aggregated DER behavior can be checked through net load at transmission-distribution interfaces during events. |
12. Key takeaways
- Validate the system, not just the units. MOD-033 tests whether the assembled planning model reproduces reality.
- Write criteria before comparing. Quantitative, dual-criterion, windowed and IBR-specific guidelines are the heart of Part 1.3.
- Treat IBRs and DER as first-class model elements. MOD-033-3 makes this explicit.
- Manage the clocks. Calendar, event register and request log are the compliance spine.
- Fix what you find. Part 1.4 resolution, through MOD-032-2 and MOD-026-2, is where reliability improves.
- Build one data architecture for PRC-028, PRC-030, MOD-026 and MOD-033.
13. How Keentel Engineering helps
Keentel Engineering supports
Planning Coordinators, Transmission Planners, Transmission Operators and Generator Owners with model validation and NERC compliance across the US, at transmission voltages from 69 kV to 765 kV.
| Service | Keentel scope | Outcome |
|---|---|---|
| MOD-033-3 program development | Gap assessment against MOD-033-3, procedure rewrite, Part 1.3 and 1.4 guidelines with IBR and DER criteria | An auditable process that finds real model errors |
| Steady-state validation | State estimator to planning case mapping, comparison, root-cause diagnosis | Planning cases that match the system |
| Dynamic validation | Event selection, data collection, system and play-in simulation in PSS®E, PowerWorld and PSCAD | Validated dynamic databases |
| IBR model verification | MOD-026-2 verification, parameter tuning, EMT and positive-sequence benchmarking | Plant models that match commissioned settings |
| DER modeling | DER_A aggregation and validation with distribution data | Credible DER representation |
| Disturbance monitoring | PRC-028-1 and PRC-002-5 design, recorder specification and data management | The data validation depends on |
| Event analysis | PRC-030-1 root-cause analysis and corrective action plans | Faster, defensible answers after events |
| Audit readiness | Mock audits, evidence indexing, RSAW preparation, self-report and mitigation support | Confidence before the auditor arrives |
Why clients choose Keentel Engineering
- Engineering first: compliance programs built on real power system analysis, not paperwork alone.
- Multi-platform modeling: PSS®E, PowerWorld, PSCAD and EMT expertise for IBR-heavy systems.
- End-to-end Order 901 coverage: PRC-028, PRC-029, PRC-030, MOD-026, MOD-032 and MOD-033 in one team.
- Clear evidence: reports structured for both engineers and auditors.
- Licensed professional engineering: a Florida-registered firm with offices in Tampa, Austin, Sacramento and Baltimore, supporting projects nationwide.
Preparing for MOD-033-3 or validating your models against real events? Talk to Keentel Engineering at (813) 389-7871, contact@keentelengineering.com, or book a 15-minute scoping call at calendly.com/keentel-engineering/15min.
Part C — Case Studies
The following are illustrative composite scenarios based on conditions typical of US planning and generation projects. They show how Keentel Engineering approaches model validation and compliance; identifying details are generalized and figures are rounded.
Case Study 1 — Rebuilding the validation record at a Planning Coordinator
Situation. A Planning Coordinator in the eastern US, covering a footprint with 345 kV and 138 kV transmission, conventional generation and a growing fleet of solar and storage, had performed steady-state and dynamic comparisons under MOD-033-2. The engineering was sound, but the record was not. Comparisons were done by different engineers at different times; criteria for unacceptable differences were informal; and dynamic events were not tracked. When an internal reviewer asked for the timeline of dynamic comparisons, staff had to reconstruct it from email. MOD-033-3 was approaching its effective date.
Analysis. Keentel performed a gap assessment against MOD-033-3. Findings:
- the procedure addressed Parts 1.1 and 1.2 but stated Part 1.3 guidelines only qualitatively and had no generating-facility criteria;
- Part 1.4 resolution was described in a single sentence;
- the procedure did not mention IBRs or DERs;
- the last dynamic event used was 20 months old, and no candidate event had been selected;
- R2 data requests had been sent by email without a log.
Engineered solution. Keentel rewrote the procedure with a cross-reference table to Parts 1.1–1.4 and to the MOD-033-3 footnote on IBRs and DERs. New quantitative guidelines covered voltages (±0.02 pu), flows (10% and 20 MW), and windowed IBR criteria. An event register was created and populated with the past 30 months of disturbances; a 230 kV fault from four months earlier, with good recordings at two IBR plants, was selected and the comparison was scheduled for completion within six months. An R2 request template and log were introduced, with recipients' acknowledgement recorded.
Outcome. The dynamic comparison was completed well inside the chained 24-month window. It found one unacceptable difference — an IBR plant's reactive current during the fault — which was resolved through a MOD-032-2 data request. The next internal audit took a fraction of the preparation time because the procedure, calendar, register and logs told the story without reconstruction.
Case Study 2 — An optimistic IBR model in a weak 345 kV area
Situation. In a western US area with several large solar and storage plants connected at 345 kV and a short-circuit ratio near 2.5 at some points of interconnection, a 345 kV line fault caused a brief, unexplained reduction of about 180 MW of IBR output. The planning model predicted no output reduction at all.
Analysis. Keentel performed a dynamic comparison using PRC-028-1 recordings at three plants and PMU data at two 345 kV substations. System-level simulation reproduced the voltage dip but not the power reduction. Play-in simulation of each plant, driven by its recorded point-of-interconnection voltage and frequency, isolated the problem:
- one plant's model overstated fault reactive current by about 45% compared with the recording;
- the same plant recovered active power in about 1 s in the field versus 0.3 s in the model, because a post-fault ramp-rate limit had been omitted from the submitted model;
- a second plant entered momentary cessation in the field, which its model did not represent; the inverter firmware had been updated after commissioning.
An EMT comparison in PSCAD, using the manufacturer's vendor-specific model with as-left settings, reproduced the field behavior of both plants within the PC's guidelines.
Engineered solution. The PC issued model correction requests under MOD-032-2. Keentel supported the Generator Owners in updating their positive-sequence models, verified against the recordings under MOD-026-2, and in removing momentary cessation within the inverter's capability, consistent with PRC-029-1 ride-through expectations. The PC's Part 1.4 guidelines were updated to require EMT comparison for plants at points of interconnection with SCR below 3.
Outcome. With corrected models, the system-level simulation reproduced the field reduction within 10%. Planning studies of the area were re-run; a previously unidentified post-contingency voltage issue was found and resolved through a plant controller setting change, before it could cause a larger event.
Case Study 3 — DER, a late comparison and a self-report
Situation. A Planning Coordinator in a region with solar penetration discovered during an internal review that its last steady-state comparison had been completed 27 months after the previous one — three months late. The same review found that its spring off-peak planning cases consistently overstated net load at several 138 kV and 69 kV substations.
Analysis. The lateness was traced to a staffing change and to a calendar kept in an individual's spreadsheet. The net load mismatch was traced to DER. Keentel compared state estimator net load at 24 transmission-distribution interfaces with the planning case on three midday snapshots. The planning case modeled DER at 60% of installed capacity for all hours; actual midday output was closer to 80%, and at several substations the error exceeded the PC's 20 MW guideline. A dynamic review of a 138 kV fault also showed about 25% of local DER tripping, whereas the DER_A parameters assumed almost full ride-through.
Engineered solution. The PC self-reported the late comparison promptly to its Regional Entity with a mitigation plan: a centralized validation calendar with alerts at 18, 21 and 23 months; a second responsible engineer for each comparison; and quarterly management review. Keentel developed a time-of-day DER output profile and updated the DER_A trip and momentary cessation parameters to reflect the mix of older and IEEE 1547-2018 equipment in the area, and added DER criteria to the Part 1.3 guidelines.
Outcome. The self-report, with the root cause identified and controls already in place, was resolved through a streamlined disposition. Subsequent comparisons met the guidelines at all but one interface, which was traced to a mis-mapped feeder and corrected. The improved DER representation changed the results of a spring light-load voltage study, leading to a revised reactive device plan.
Part D — Technical FAQ: MOD-033-3 and Model Validation
1. What does MOD-033-3 require?
A documented Model Validation process by each Planning Coordinator, covering steady-state and dynamic comparisons with actual System behavior and guidelines to identify and resolve unacceptable differences; and timely data provision by RCs and TOPs.
2. Who must comply?
Planning Coordinators under R1; Reliability Coordinators and Transmission Operators under R2.
3. When was MOD-033-3 adopted?
The NERC Board adopted it on October 31, 2025, and NERC filed it with FERC on November 4, 2025.
4. When does it become effective?
On the latest of the first day of the calendar quarter following the effective dates of FERC's approvals of MOD-033-3, the Model Validation definition and the DER definition. If all took effect in February 2026, the date is April 1, 2026; confirm with your Regional Entity.
5. What changed from MOD-033-2?
The defined term Model Validation; explicit inclusion of IBRs and aggregated DERs in the validated models; generating-facility criteria in Part 1.3; and reference to disturbance recordings as data sources.
6. Do the 24-month clocks reset?
No. Activity under MOD-033-2 carries forward.
7. How often is a steady-state comparison required?
At least once every 24 calendar months.
8. How does the dynamic comparison timing work?
Use an event within 24 months of the last event used, and complete the comparison within 24 months of the event. If none occurs, use the next one.
9. What is a dynamic local event?
A disturbance that produces a measurable dynamic response in the PC's area, such as a fault, a unit trip or a large load loss.
10. Does the standard set error tolerances?
No. The PC must set its own guidelines for unacceptable differences.
11. What metrics should be used?
Typically mean absolute error, RMS error and peak error, by element and by time window, with dual percentage-and-absolute criteria for flows.
12. What is play-in simulation?
Driving a single plant model with recorded point-of-interconnection voltage and frequency to test the plant model in isolation.
13. Why use comparison windows?
IBR behavior differs during the fault, during recovery and after settling; a single metric hides errors in the most important periods.
14. How are DERs validated?
Indirectly, by comparing measured and simulated net load at transmission-distribution interfaces before and after disturbances.
15. When is an EMT model needed?
When positive-sequence models cannot reproduce observed behavior, typically in weak-grid areas, during controller interactions, or when PLL or sub-cycle current limiting matters.
16. How long do RCs and TOPs have to provide data?
Thirty calendar days from a written request, or a written response that they do not have it.
17. How long must evidence be kept?
Since the last audit, unless the Compliance Enforcement Authority directs a longer period.
18. What is the VRF of R1?
Medium; R2 is Lower.
19. How does MOD-033-3 relate to MOD-026-2?
MOD-026-2 verifies individual generator models; MOD-033-3 validates the system model. Errors found under MOD-033 are often corrected through MOD-026-2 and MOD-032-2.
20. What should a PC do first?
Perform a gap assessment against MOD-033-3, update the procedure and guidelines, set up the calendar, event register and request log, and run a pilot comparison that includes an IBR plant.
References and Further Reading
Links were current at publication (October 2026).
- NERC, Reliability Standard MOD-033-3, Steady-State and Dynamic System Model Validation, and its Implementation Plan and Technical Rationale (Project 2021-01). nerc.com
- NERC, Reliability Standard MOD-033-2 and FERC order approving MOD-033-2, Docket No. RD20-4-000 (October 30, 2020).
- NERC, Petition for Approval of Proposed Reliability Standard MOD-033-3 (November 4, 2025).
- FERC, Order No. 901, Reliability Standards to Address Inverter-Based Resources (October 19, 2023).
- NERC, Reliability Standards MOD-026-2, MOD-032-2, PRC-028-1, PRC-029-1, PRC-030-1, PRC-002-5 and PRC-019-2.
- NERC, Level 3 Alert: IBR Performance and Modeling (2025).
- NERC, Rules of Procedure, Appendix 4B (Sanction Guidelines) and Appendix 4C (Compliance Monitoring and Enforcement Program).
- NERC, Reliability Guideline: Power Plant Model Verification for Inverter-Based Resources; Reliability Guideline: Parameterization of the DER_A Model.
- IEEE Std 2800-2022, Interconnection and Interoperability of Inverter-Based Resources Interconnecting with Associated Transmission Electric Power Systems.
- IEEE Std 1547-2018, Interconnection and Interoperability of Distributed Energy Resources with Associated Electric Power Systems Interfaces.
- IEEE Std C37.111 (COMTRADE) and IEEE Std C37.232 (COMNAME).
Disclaimer
This article is general technical and compliance information for educational purposes. It is not legal advice or engineering advice for any specific system and does not create a professional relationship. The approved Reliability Standards, implementation plans and the guidance of your Compliance Enforcement Authority govern; regulatory status and effective dates stated here reflect the public record as Keentel understood it at publication and must be confirmed before reliance. Keentel's validation example uses illustrative data and example screening guidelines, which are not NERC requirements; each Planning Coordinator must establish and justify its own criteria.
Case studies are illustrative composite scenarios based on typical project conditions, not records of specific client projects. Figures are rounded and indicative.
NERC, FERC, IEEE, PSS®E, PowerWorld, PSCAD and other names are the property of their respective owners. Keentel Engineering is not affiliated with or endorsed by these organizations or any software vendor.
| Office | Address | Phone |
|---|---|---|
| Head Office — Tampa | 400 N Ashley Dr STE #2600, Tampa FL 33602 | (813) 389-7871 |
| Austin | 5900 Balcones Drive STE 100, Austin TX 78731 | (512) 591-0752 |
| Sacramento | 1401 21st St Ste R, Sacramento CA 95811 | (916) 913-4524 |
| Baltimore | 306 W Redwood St STE 200, Baltimore MD 21201 | (410) 225-2181 |

About the Author:
Sandip "Sonny" R. Patel, P.E.
IEEE Senior Member · Founder & CEO, Keentel Engineering
In 1995, Sonny Patel earned his Electrical Engineering degree from the University of Illinois. But degrees don't build legacies — action does.
For three decades, he has worked the power industry from every side of the table: 16 years as a utility engineer at Exelon/Commonwealth Edison; generation leadership across hydroelectric, industrial steam turbine, and a 9 GW renewable fleet; NERC Regional Entity Senior Compliance Engineer and Audit Team Lead, auditing some of the nation's largest utilities; and testing and commissioning lead on equipment up to 765 kV — the very top of the North American grid.Utility. Generator. Regulator. Consultant. Few engineers have seen all four seats. Fewer still have sat in them.
His experience spans nuclear, hydro, conventional generation, renewables, oil and gas, mining — and today's data centers, where he is authoring a three-book series on data center design. He is a Licensed Professional Engineer in six states and a Licensed Electrical Contractor in Florida (Unlimited EC) — he doesn't just design the work; he's qualified to stand behind its execution.Today, as Founder and CEO of Keentel Engineering, Sonny leads a nationwide team of engineers delivering substation design, power system studies, NERC compliance, and commissioning — done right, coast to coast.Three decades. Every side of the table. One standard: accountable engineering.
Services

Let's Discuss Your Project
Let's book a call to discuss your electrical engineering project that we can help you with.
About the Author:
Sandip "Sonny" R. Patel, P.E.
IEEE Senior Member · Founder & CEO, Keentel Engineering
In 1995, Sonny Patel earned his Electrical Engineering degree from the University of Illinois. But degrees don't build legacies — action does.
For three decades, he has worked the power industry from every side of the table: 16 years as a utility engineer at Exelon/Commonwealth Edison; generation leadership across hydroelectric, industrial steam turbine, and a 9 GW renewable fleet; NERC Regional Entity Senior Compliance Engineer and Audit Team Lead, auditing some of the nation's largest utilities; and testing and commissioning lead on equipment up to 765 kV — the very top of the North American grid.
Utility. Generator. Regulator. Consultant. Few engineers have seen all four seats. Fewer still have sat in them.
His experience spans nuclear, hydro, conventional generation, renewables, oil and gas, mining — and today's data centers, where he is authoring a three-book series on data center design. He is a Licensed Professional Engineer in six states and a Licensed Electrical Contractor in Florida (Unlimited EC) — he doesn't just design the work; he's qualified to stand behind its execution.
Today, as Founder and CEO of Keentel Engineering, Sonny leads a nationwide team of engineers delivering substation design, power system studies, NERC compliance, and commissioning — done right, coast to coast.Three decades. Every side of the table. One standard: accountable engineering.
Leave a Comment
Thank you for contacting us.
We will get back to you as soon as possible.
We will get back to you as soon as possible.
Oops, there was an error sending your message.
Please try again later.
Please try again later.
Related Posts

By SANDIP R PATEL
•
October 26, 2026
Explore cyber-physical resilience for the Energy Internet, including DER attacks, false data injection, BESS readiness, AI detection, and NERC CIP compliance.

By SANDIP R PATEL
•
October 24, 2026
Learn how Buchholz and sudden pressure relays protect transformers, detect internal faults, and meet NERC PRC-005-6 maintenance requirements.
By SANDIP R PATEL
•
October 24, 2026
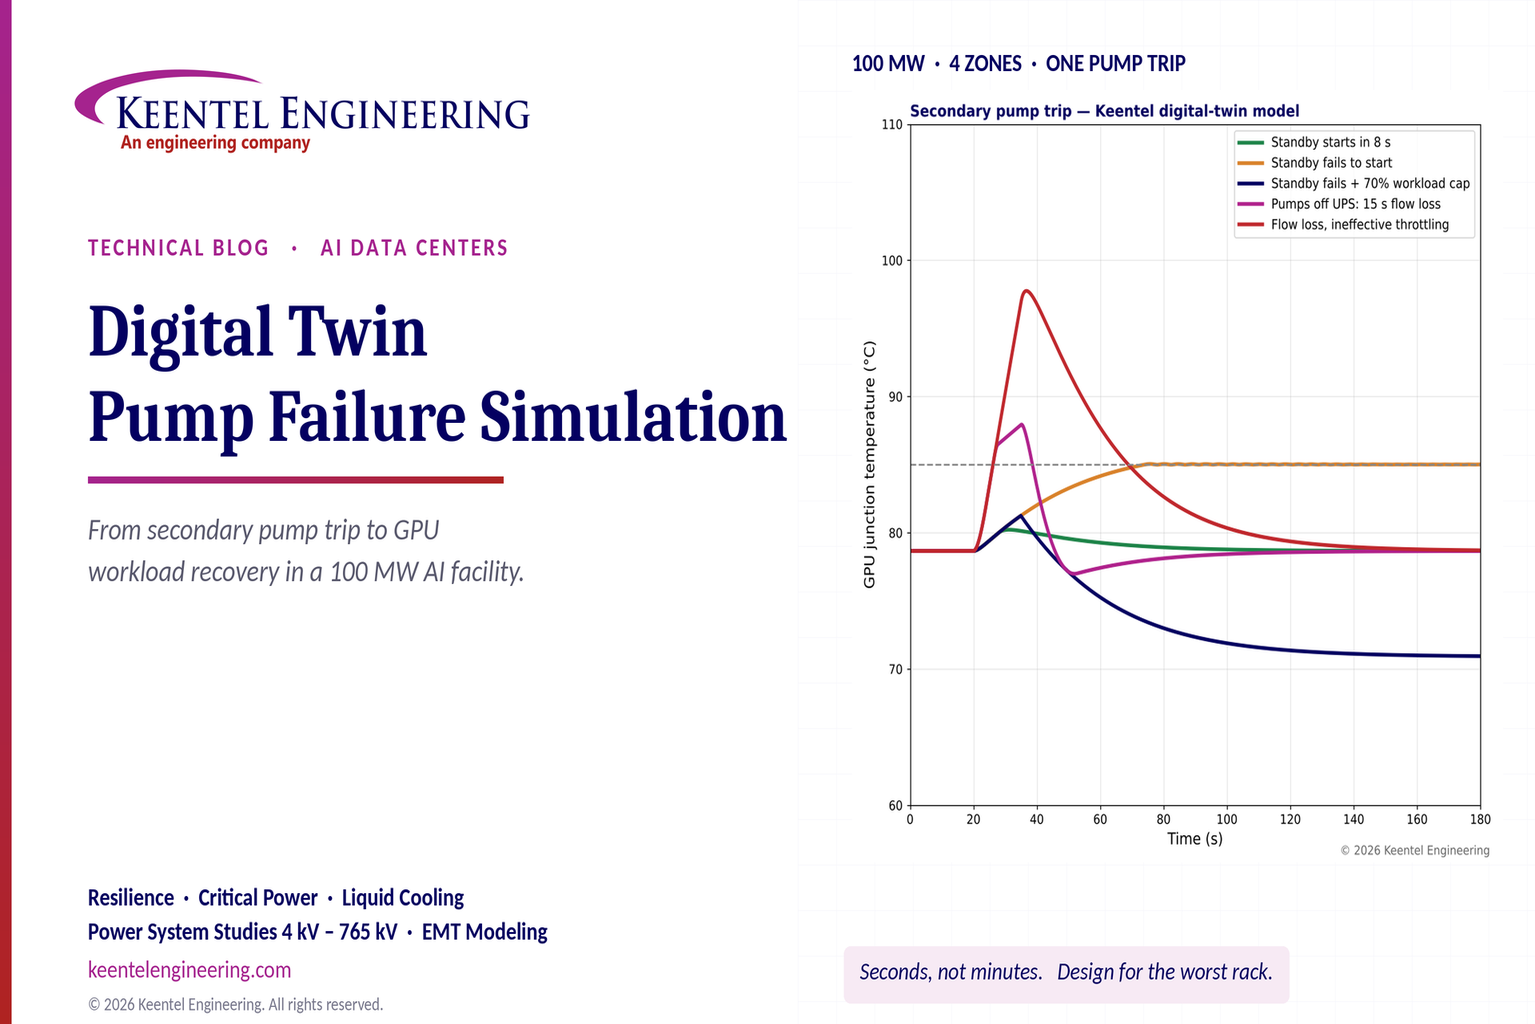
Explore digital twin pump failure simulation for liquid-cooled AI data centers, including GPU temperatures, standby pump failover, UPS and workload recovery.

By SANDIP R PATEL
•
October 24, 2026
Learn PSCAD custom component parameters, field types, Literal, Constant and Variable settings, Fortran coding, and EMT model validation for grid studies.

By Team 2 Dexora
•
October 24, 2026
Explore 800 VDC rack fault protection for AI data centers, including solid-state breakers, DC short circuits, selectivity, arc flash, and NEC/UL standards.
October 24, 2026
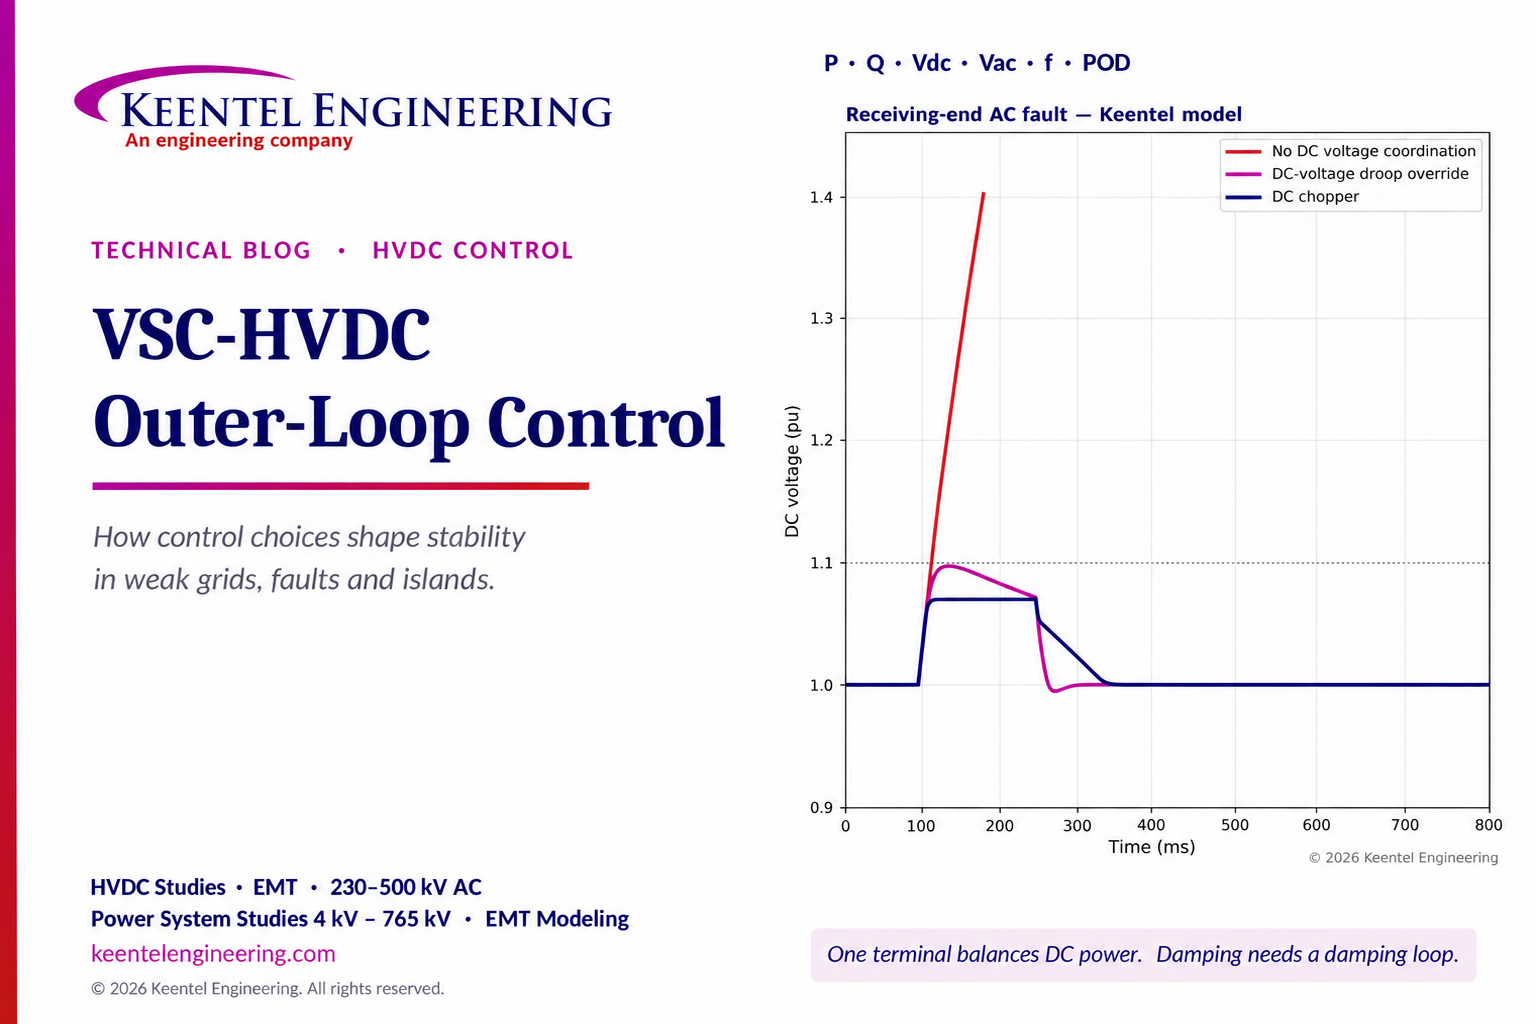
Explore VSC-HVDC outer-loop control for P, Q, DC voltage, weak-grid stability, fault ride-through and power oscillation damping with engineering models.
By SANDIP R PATEL
•
October 23, 2026
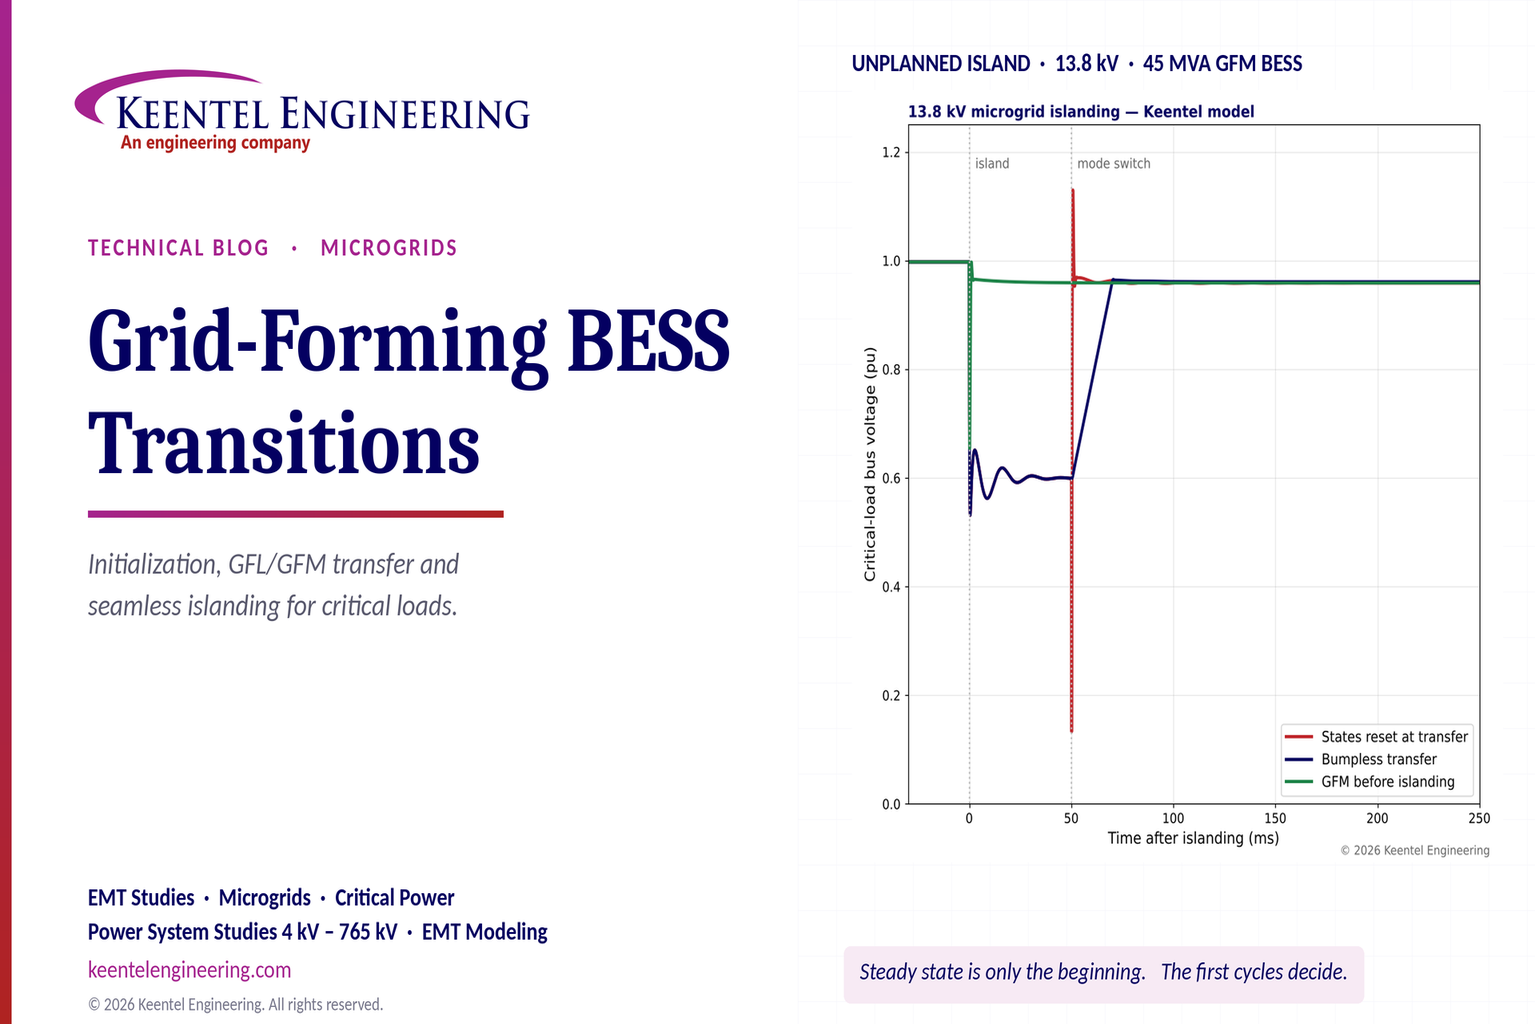
Explore grid-forming BESS initialization, GFL-to-GFM transitions, seamless islanding, EMT simulations, current limiting and microgrid protection.
By SANDIP R PATEL
•
October 23, 2026
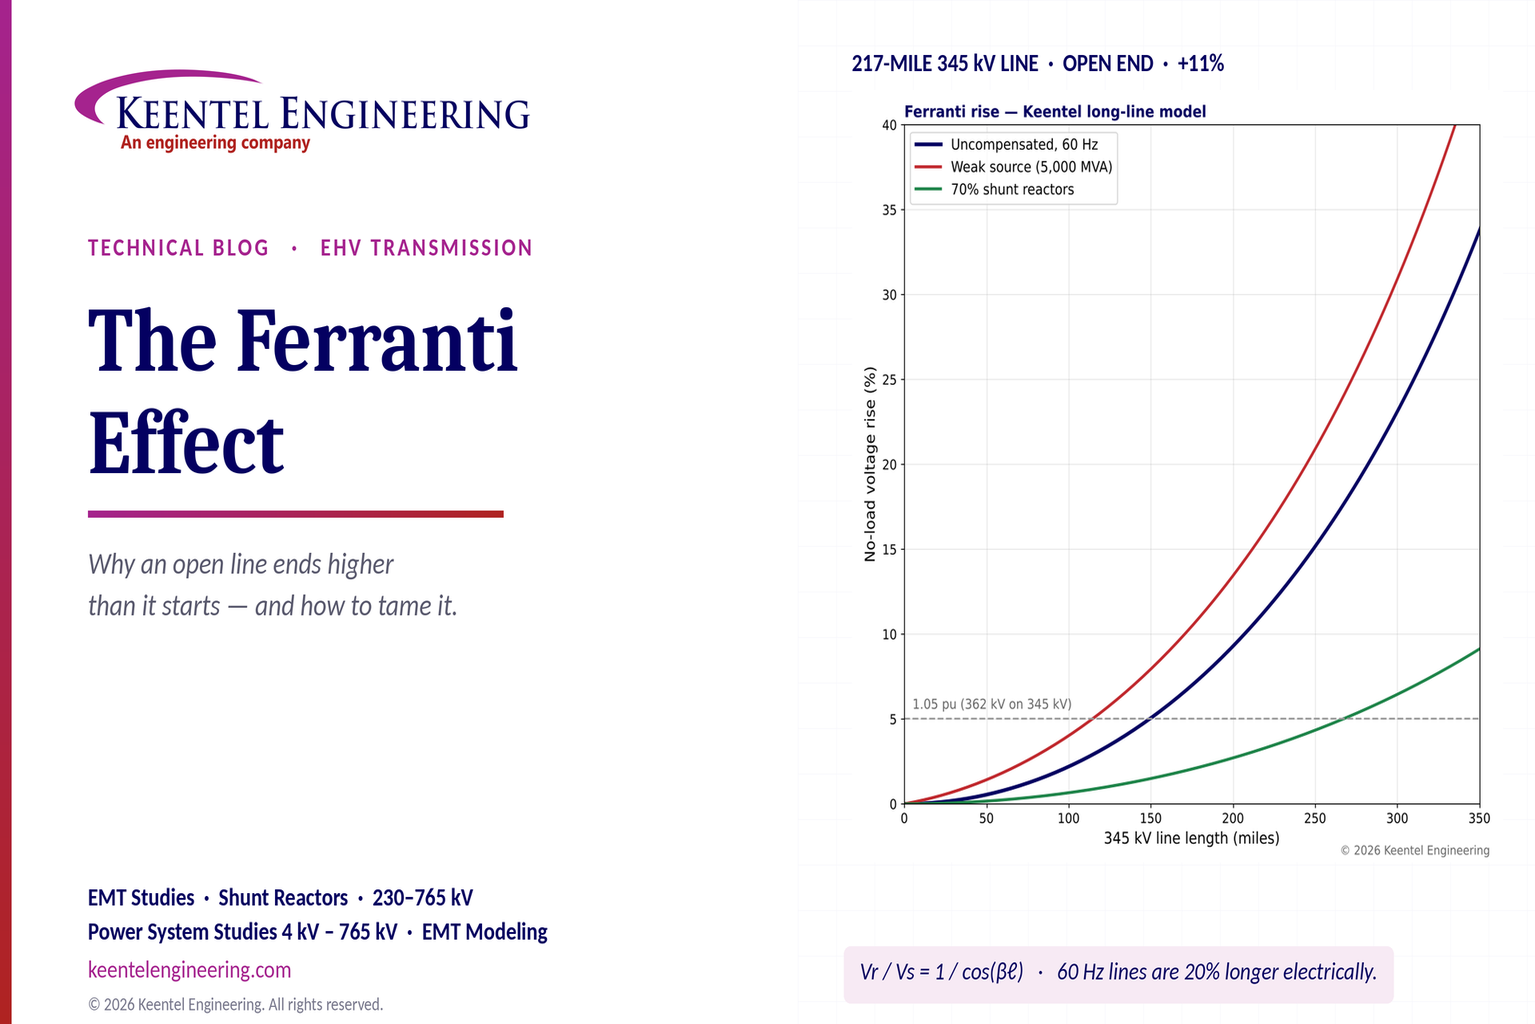
Explore the Ferranti effect in EHV transmission lines: voltage rise, 345 kV examples, switching overvoltages, shunt reactor sizing and mitigation.

By SANDIP R PATEL
•
October 23, 2026
Explore cluster interconnection studies under FERC Order 2023, including network upgrades, cost allocation, withdrawal penalties and developer strategy.