A Coordinated Electric System Interconnection Review—the utility’s deep-dive on technical and cost impacts of your project.
Challenge: Frequent false tripping using conventional electromechanical relays
Solution: SEL-487E integration with multi-terminal differential protection and dynamic inrush restraint
Result: 90% reduction in false trips, saving over $250,000 in downtime
The three operating regions you have to design to
| Device | Output vs voltage | Response | Best suited to | Main limitations |
|---|---|---|---|---|
| Mechanically switched capacitor or reactor | Proportional to voltage squared | Seconds; discrete steps; limited switching operations per day | Steady-state reactive supply, voltage profile, loss reduction | No dynamic capability; step voltage change on switching; capability collapses when most needed |
| Static var compensator | Capacitive branches proportional to voltage squared | A few cycles; continuously controllable | Continuous control where cost matters and deep voltage support is not the driver | Square-law capability loss; harmonic filters are part of the plant and interact with the network |
| STATCOM | Approximately proportional to voltage — constant current capability | One to two cycles closed loop; converter response faster still | Voltage stability margin, weak interconnections, fast disturbance recovery, flicker and unbalance compensation | Higher capital cost; converter losses; adds a converter and its control dynamics to the network |
| Synchronous condenser | Governed by machine capability and excitation | Excitation response in the hundreds of milliseconds; inherent inertial response instantaneous | System strength and inertia, short-circuit contribution, black start support | Rotating plant with maintenance and losses; slower controlled response than a converter |
| STATCOM with energy storage | Reactive as a STATCOM, plus real power within the storage rating | As STATCOM for reactive; real power limited by storage | Where a real power deficiency is part of the problem | Cost and complexity of the storage; different failure and maintenance profile |
| Stage | Keentel scope | Outcome |
|---|---|---|
| Screening | Series-compensation proximity, radial contingency review, UIF and short-circuit ratio screening, frequency scans | Early identification of which SSO types apply |
| Detailed studies | PSCAD/EMTDC EMT studies with vendor real-code models, impedance-based and frequency-scan analysis | Clear evidence of stability margins or risk |
| Model quality | EMT model review, benchmarking against positive-sequence models, model acceptance support | Models that system operators accept |
| Mitigation | Control retuning recommendations with vendors, SSDC and bypass logic requirements, protection and monitoring specifications | Practical, coordinated solutions |
| Interconnection support | SSR and SSO study reports for ISO and utility requirements, response to reviewer comments | Fewer delays in the interconnection process |
Resilience: designing CDUs to the facility Tier objective
Liquid cooling makes heat removal more critical, not less. Cold plates hold only seconds of thermal buffer. If TCS flow stops, processors throttle or shut down very quickly. Resilience design must therefore cover:
- Pump redundancy: N+1 pumps at minimum, with automatic changeover.
- CDU redundancy: N+1 CDUs on a common TCS header, or 2N CDUs serving A and B manifolds for fault-tolerant designs.
- Power to CDUs: dual-corded CDUs fed from A and B sources, with pumps and controls on UPS power so coolant keeps flowing through a utility failure and generator start. This is the liquid-cooling equivalent of continuous cooling.
- Facility water continuity: chilled water or condenser water must also continue, through thermal storage, UPS-backed pumps or a high enough FWS temperature that the TCS can coast on stored thermal mass for the transfer period.
- Concurrent maintainability: isolation valves so any CDU, pump, filter or manifold section can be serviced without stopping the others.
- Leak management: leak detection, drip trays, automatic isolation valves and procedures for fluid spills.
Electrical engineering considerations
CDUs and liquid-cooling plants are electrical loads with their own design requirements:
- Pump motors and VFDs. Large CDUs use variable-frequency drives on their pump motors. These introduce harmonic current that must be included in the facility's harmonic study and IEEE 519 evaluation.
- Critical mechanical load on UPS. Putting CDU pumps on UPS increases UPS and battery sizing. The mechanical UPS load must be included in redundancy and ride-through calculations.
- Feeder and protection design. Dual feeds, automatic transfer, selective coordination and arc-flash labelling apply to CDU power distribution just as they do to IT power.
- Generator transient response. CDU pumps restarting together after a transfer create motor inrush on the generators. Staged restarts and soft acceleration reduce the step load.
- Load dynamics. AI training loads can swing rapidly between high and low power. Cooling controls must track those swings without temperature overshoot, and electrical systems must handle both the IT and the cooling load changes.
Commissioning a liquid-cooled data hall
- Flush and clean the TCS piping and manifolds to the specified cleanliness, using high-purity flush water.
- Fill and vent with the specified coolant, verifying glycol concentration and chemistry.
- Pressure test for leaks at design and test pressures, including quick-disconnect fittings.
- Verify sensors and controls: flow meters, temperature sensors, pressure transmitters, leak detection and BMS points.
- Load test with heat load banks connected through the cold-plate interfaces or rack manifolds, across the operating range.
- Prove the heat balance on both loops at several load steps, and the approach temperature against the design.
- Test failure scenarios: pump failure, CDU failure, power transfer to generator, valve failure and loss of facility water, confirming temperatures stay within the IT vendor's limits.
How Keentel Engineering helps
Keentel Engineering supports data center owners, developers and EPCs with the electrical engineering that liquid-cooled facilities depend on, and coordinates with the mechanical engineer of record and cooling vendors on the integrated design.
Cyber-Physical Resilience for the Energy Internet: DER Security, AI & NERC CIP
October 26, 2026 | Blog
Part A — Cyber-Physical Resilience for the Energy Internet at a Glance
The U.S. grid is becoming an "Energy Internet": millions of distributed energy resources (DER), inverter-based resources (IBR), batteries, electric-vehicle chargers, smart buildings and hyperscale data centers, all coordinated through communication networks, software and markets. Energy and information now flow in both directions. That brings flexibility and lower cost. It also means that an adversary can move megawatts without touching a breaker.
This guide is Keentel Engineering's practical treatment of the security and resilience of that system. It is written for utility planners, protection and control engineers, DER and IBR owners, data-center developers and the compliance teams that support them. It covers:
- The threat landscape, from false data injection to load-altering botnets, firmware tampering and timing spoofing.
- Why IBR- and DER-rich systems are structurally more exposed — and, properly designed, structurally more resilient.
- The mathematics of how corrupted data propagates through state estimation (SE) and optimal power flow (OPF).
- Decision-aware resilience for battery and long-duration storage: why installed megawatts are not the same as usable resilience.
- How to measure resilience across physical, operational, cyber, climatic and regulatory dimensions with a single index.
- Price forecasting as a security function, the adversarial risks of machine learning (ML), and explainable, governed AI.
- Attack-resilient routing of control traffic around compromised network devices.
- How all of this maps to NERC CIP, FERC orders, NIST guidance and U.S. interconnection practice.
The Energy Internet in one table
| Layer | What lives there | Typical U.S. protocols and controls | What an attacker can do |
|---|---|---|---|
| Physical (energy) | Generation, IBR, DER, BESS, 13.8–34.5 kV feeders, 69–500 kV transmission, large loads | Protection, ride-through, interconnection requirements | Trip or curtail resources, cause overloads, voltage and frequency excursions |
| Cyber (information) | RTUs, IEDs, PMUs, inverter controllers, gateways, aggregator clouds, SCADA/EMS/DERMS | DNP3 (with Secure Authentication), IEC 61850, Modbus, the DER communication protocol 2030.5, PTP/GPS time | Inject false data, delay or replay messages, spoof time, alter firmware or settings |
| Decision and market | State estimation, OPF, SCED/SCUC, DER aggregation, price forecasts, AI decision support | NERC CIP, FERC Order 2222 market rules, ISO/RTO market manuals | Mislead estimators and optimizers, manipulate prices, poison or evade ML models |
What Keentel's model shows
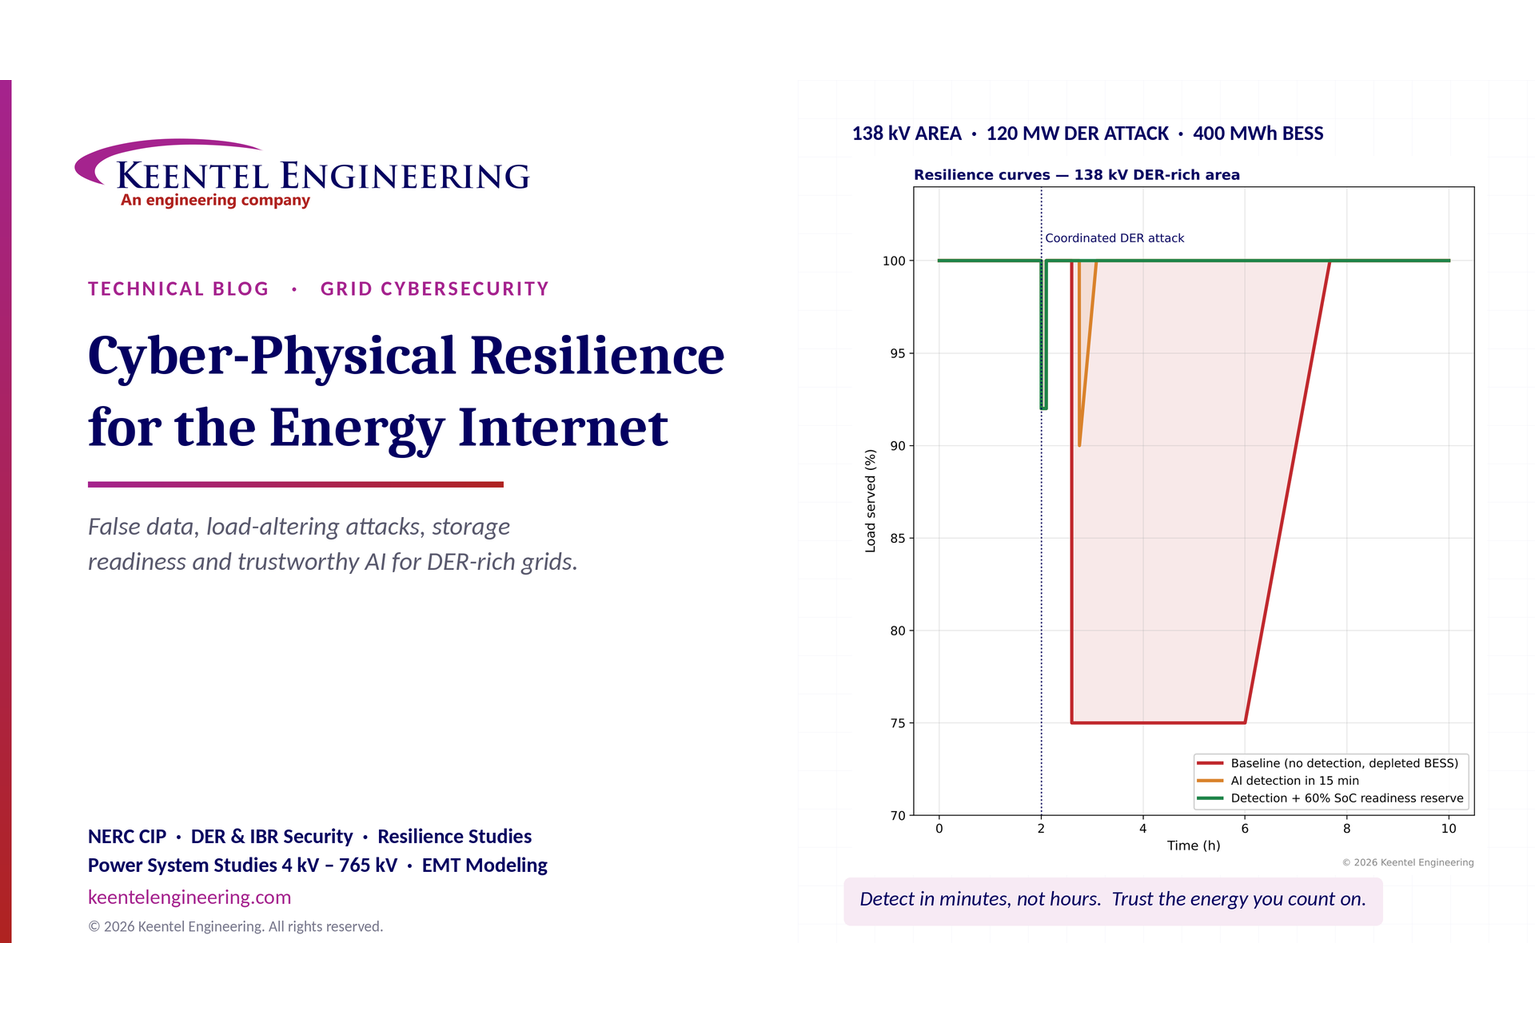
Keentel modeled an illustrative 138 kV subtransmission area serving 400 MW of load. The area has 120 MW of DER on its 13.8 kV feeders, a 300 MW import limit on its 138 kV ties, and a 100 MW / 400 MWh battery energy storage system (BESS). At t = 2 h, a coordinated cyberattack through an aggregator platform disconnects all 120 MW of DER. In the baseline case, the BESS had been cycled down to 20% state of charge (SoC) by energy arbitrage, while a false-data injection made the energy management system (EMS) believe it held 50%.
| Case | What is different | Minimum load served | Resilience loss | Expected unserved energy |
|---|---|---|---|---|
| 1. Baseline | No cyber-physical detection; BESS depleted; DER restored only after a 4-hour investigation | 75% | 1.07 pu-h | ≈ 427 MWh |
| 2. AI anomaly detection | Cross-domain detector flags the attack within 15 minutes; DER returned to local autonomous control over 1 hour; BESS still depleted | 90% | 0.025 pu-h | ≈ 10 MWh |
| 3. Detection plus storage readiness reserve | As case 2, plus a 60% SoC reserve held for resilience and validated against independent metering | 92% (initial transient only) | 0.008 pu-h | ≈ 3 MWh |

Figure 1. Keentel's illustrative resilience model of a 138 kV DER-rich area under a coordinated DER attack. Top: load served and the resilience-loss area for each case. Bottom: BESS true and reported state of charge.
Five lessons
- Detection time is the dominant variable. Cutting time-to-detect from four hours to fifteen minutes reduced unserved energy by about 98% in this example. Fast cross-domain detection is worth more than almost any physical upgrade.
- Installed storage is not resilience. A 400 MWh battery at 20% SoC is a 60 MWh battery when the attack starts. Resilience comes from energy that is actually available, at the moment it is needed, and that the operator can trust.
- The decision layer is an attack surface. In the baseline, nothing was physically damaged. The outage came from decisions made on false information.
- Coupled attacks are worse than the sum of their parts. When physical, operational and cyber dimensions degrade together, the impact multiplies. A multidimensional resilience index captures what single-dimension metrics miss.
- AI helps only if it is trustworthy. Detectors must be explainable, governed under CIP-style change control, and protected from evasion, poisoning and tampering.
Engineering review of common statements about grid cybersecurity
| Statement often heard | Keentel's engineering review |
|---|---|
| "Encryption solves it." | Encryption and authentication protect messages in transit. They do not help when the sending device itself is compromised and emits valid, signed, but false data. Physical-consistency checking is still needed. |
| "Our bad-data detector will catch false data." | Residual-based bad-data detection catches random errors. A coordinated false-data injection that is consistent with the network model (a = Hc) leaves the residual unchanged and passes. |
| "DER are too small to matter." | Individually, yes. Aggregated through a single cloud platform or a common firmware image, thousands of DER become a single multi-hundred-megawatt resource with a single point of compromise. |
| "Low-impact sites are outside CIP." | Low-impact BES Cyber Systems are covered by CIP-003, which now includes controls for vendor electronic remote access. Non-BES DER fall outside CIP but inside state interconnection rules and the DER interconnection standard 1547-2018. |
| "More batteries mean more resilience." | Only if usable energy is held in reserve when needed, the reported SoC is trustworthy, and the inverter and network can actually deliver the power. |
| "An AI detector with 99% accuracy is good enough." | Accuracy on a test set says nothing about adaptive adversaries, distribution shift or poisoned retraining. Governance, uncertainty and explainability matter as much as accuracy. |
| "Large data-center loads are just big loads." | Hundreds of megawatts that can ramp in seconds and respond to price signals are a stability issue and a control channel. A load that can be dispatched can also be manipulated. |
| "Post-quantum cryptography is a future problem." | Relays, RTUs and inverters installed in 2026 will still be in service when cryptographically relevant quantum computers may exist. NIST published its first post-quantum standards (FIPS 203, 204 and 205) in August 2024; inventory and crypto-agility planning should start now. |
Part B — Cyber-Physical Resilience for the Energy Internet: A Technical Guide
1. What the Energy Internet is — and why it changes security
1.1 From a hierarchy to a network
For most of the last century, the U.S. grid was operated as a hierarchy. Large synchronous plants fed 230, 345 and 500 kV transmission, which fed 69–138 kV subtransmission, which fed 13.8–34.5 kV distribution, which fed passive customers. Control centers saw the transmission system well and the distribution system barely at all. Security meant guarding a perimeter around a modest number of control centers and substations.
The Energy Internet replaces that hierarchy with a network. Its defining features are:
- Bidirectional energy flow. Rooftop and community solar, BESS, vehicle-to-grid chargers and behind-the-meter generation push power back up the system.
- Bidirectional information flow. Inverters, meters, chargers, thermostats, building controls and aggregator platforms exchange measurements and commands continuously.
- Power-electronic interfaces. Behavior is defined by software control loops — phase-locked loops (PLL), current limiters, volt-VAR and frequency-watt functions — rather than by the physics of rotating machines.
- Markets reaching the edge. FERC Order 2222 (2020) requires ISOs and RTOs to let DER aggregations participate in wholesale markets. Price signals now reach devices that can act on them in seconds.
- Large, fast, software-defined loads. AI data centers ramp hundreds of megawatts as training and inference jobs start and stop, and increasingly respond to prices.
1.2 A three-layer model
Keentel uses a three-layer model for analysis:
- Physical layer — generation, storage, conversion and delivery assets, including coupled carriers such as natural gas, hydrogen and thermal storage.
- Cyber layer — sensing, communication, timing and control among utility, customer and third-party devices.
- Decision and market layer — state estimation, optimization, market clearing, forecasting, aggregation and the AI tools that increasingly support them.
The layers are tightly coupled vertically, and cells such as microgrids, feeders and balancing areas are coupled horizontally. An attack enters at one layer and expresses itself at another. A falsified measurement (cyber) misleads an optimizer (decision), which dispatches resources into an overload (physical). This coupling is what makes Energy Internet security different from IT security.
1.3 Security versus resilience
Two terms are used throughout this guide:
- Security is the ability to prevent, detect and contain malicious or accidental compromise of confidentiality, integrity and availability — and, for the grid, of physical behavior.
- Resilience is the ability to anticipate, withstand, recover from and adapt to high-impact events, including events that were not prevented or detected.
The core argument of this guide is that security alone cannot be assumed complete. With millions of edge devices owned by many parties, some compromise must be assumed. Resilience — designing the system to degrade gracefully and recover quickly — is what keeps the lights on when prevention fails.
2. The threat landscape and attack taxonomy
2.1 Organizing threats by layer
| Layer | Representative targets | Representative attacks |
|---|---|---|
| Device and edge | Smart inverters, relays, IEDs, EV chargers, thermostats, plant controllers, firmware | Firmware modification, setting changes, default-credential abuse, malicious grid-support settings |
| Communication and timing | DNP3, IEC 61850 GOOSE and sampled values, Modbus, 2030.5, cellular and radio links, GPS and PTP timing | Man-in-the-middle, replay, denial of service, time-delay, GPS spoofing, PTP grandmaster compromise |
| Control and coordination | Plant controllers, microgrid secondary and tertiary control, DERMS, state estimation, AGC | False data injection, control-input manipulation, parameter attacks on control loops |
| Market and data | Price formation, demand response, aggregator bidding, data pipelines, forecasting and ML models | Price manipulation through demand, data poisoning, adversarial inputs to ML models |
2.2 False data injection
False data injection (FDI) corrupts measurements or estimates on which monitoring and control depend. Its most dangerous form is designed to be consistent with the network model, so that conventional bad-data detection in the state estimator does not flag it. Section 4 works through the mathematics. In practice, an FDI attack requires access to a set of meters or their communication paths, and knowledge of the network topology and impedances — which is why topology data and model files are themselves sensitive information under CIP-011.
2.3 Load-altering attacks
A load-altering attack (LAA) compromises a large population of high-wattage, internet-connected loads — EV chargers, heat pumps, water heaters, smart thermostats, building automation — and switches them in a coordinated way. Two forms matter:
- Static LAA: a single synchronized step change in demand, for example switching on 300 MW of EV charging at once.
- Dynamic LAA: demand modulated in response to measured frequency, in phase with the oscillation, so that it reinforces rather than damps the disturbance. Dynamic attacks are most dangerous under low-inertia conditions.
The attack surface grows with every new connected load. Large data centers add a variant: because their demand is increasingly price-responsive, the market layer becomes a control channel into hundreds of megawatts.
2.4 Firmware, hardware and supply-chain attacks
Field devices are embedded systems with 15–25-year service lives and frequent remote updates. Firmware modification, compromised update servers and malicious components in the supply chain are persistent risks. Software bills of materials (SBOMs) help owners know what is inside a device, but SBOM-driven vulnerability management is still immature in practice. NERC CIP-013 requires supply-chain risk management plans for high- and medium-impact BES Cyber Systems; DER outside the BES depend on procurement specifications and state requirements.
2.5 Communication, timing and availability attacks
Wide-area monitoring, protection and control depend on accurate time and timely delivery. GPS spoofing can shift the time reference of a phasor measurement unit (PMU), corrupting phase angles and every control that uses them. Denial-of-service and time-delay attacks degrade the latency guarantees of microgrid and DER coordination. Section 5.6 quantifies the timing problem.
2.6 Market-layer attacks
When flexible loads and DER respond automatically to prices, price formation becomes an attack surface. An adversary can move locational prices by manipulating demand, or exploit price-responsive automation to convert an economic signal into a physical disturbance. Conversely, falsified data feeding the market — line ratings, load forecasts, DER telemetry — can produce artificial congestion and price spikes.
2.7 Incidents that shaped the threat model
The threat is not hypothetical. The coordinated attacks on the Ukrainian distribution grid in December 2015 and on a transmission substation in December 2016 demonstrated that intrusions into OT networks can cause physical outages. Since then, ransomware and intrusion campaigns have repeatedly hit utilities and energy companies, vulnerability disclosures across widely deployed solar inverters have shown a high proportion of high- and critical-severity issues, and reports of attacks on renewable assets have shown that inverter-dominated infrastructure is within reach of capable adversaries. In the United States, NERC has also reported events in which roughly 1,500 MW of data-center load disconnected almost at once during a transmission fault — not an attack, but a signature that operators could easily confuse with one.
3. Why IBR- and DER-rich systems are different
3.1 Lower inertia, lower strength, faster dynamics
Replacing synchronous machines with IBR reduces system inertia and short-circuit strength, narrows stability margins and moves dynamics into faster, control-defined timescales. The same change alters the security calculation: the behavior of an IBR-dominated grid is set by software that is, in principle, reachable and modifiable.
The rate of change of frequency (RoCoF) immediately after a power imbalance ΔP is set by the stored kinetic energy:

where f₀ = 60 Hz and Eₖ is the synchronous kinetic energy (MW·s).
Worked example — load-altering attack. An attacker controls 500 MW of EV chargers and heat pumps and switches them on at once.
| Interconnection condition | E s (MW-s) | Initial RoCoF |
|---|---|---|
| High inertia (heavy synchronous commitment) | 300,000 | 500 × 60 / (2 × 300,000) = 0.05 Hz/s |
| Low inertia (high IBR share, light load) | 120,000 | 500 × 60 / (2 × 120,000) = 0.125 Hz/s |
| Islanded 34.5 kV microgrid with 300 MW-s of inertia and 20 MW of compromised load | 300 | 20 × 60 / (2 × 300) = 2.0 Hz/s |
On a large interconnection, a 500 MW static attack is comparable to a large unit trip, which the system is designed to withstand. The real risks are (1) dynamic attacks that modulate load in phase with oscillations, (2) attacks timed to coincide with a real contingency, and (3) attacks on islanded microgrids and small balancing areas, where the same few megawatts produce RoCoF high enough to trip resources on RoCoF or underfrequency protection.
3.2 Smart-inverter and PLL attacks
Smart inverters expose configurable grid-support functions — volt-VAR, volt-watt, frequency-watt, ride-through settings — and remote management interfaces. Manipulated, these functions can inject disturbances that look like legitimate control. Of particular concern are slow, small, physically plausible changes to the PLL gains or bandwidth that track grid angle and frequency. In a weak grid (low short-circuit ratio), a PLL retuned from, say, 10 Hz to 40 Hz bandwidth can move the plant toward sub-synchronous control interaction without tripping any threshold-based alarm. Detecting such attacks requires comparing the measured dynamic response with the expected response — a digital-twin residual — rather than checking setting values alone.
There is a counterpoint. Properly designed local controls give inverter-dominated systems a degree of inherent cyber resilience: autonomous droop and ride-through behavior can blunt the effect of a PLL attack on one plant before any detector acts. Quantifying that inherent resilience is a legitimate design objective.
3.3 DER aggregation multiplies trust boundaries
A virtual power plant that aggregates 40,000 residential batteries through a cloud platform has 40,000 devices, several vendors, a cloud service, a cellular or broadband network, an aggregator, a utility DERMS and an ISO interface. Each boundary is a trust assumption. Consumer-grade devices are rarely hardened to utility standards. Security architectures must therefore assume partial compromise and degrade gracefully.
| Aggregation design choice | Security consequence |
|---|---|
| Single cloud platform for all devices | One compromise reaches the entire fleet; consider caps on simultaneous commands and rate limits |
| Common firmware image | One exploit affects every device; require signed firmware and staged rollouts |
| Direct device-to-cloud control without utility visibility | Utility cannot see or block a malicious mass command; require telemetry and override paths |
| Local autonomous fallback (1547-2018 default settings) | Devices keep safe behavior if communications are lost or untrusted |
| Utility-side command plausibility checks | Rejects commands that would move more than a set number of MW within a set time |
3.4 Standards as both shield and surface
U.S. DER and IBR practice relies on several standards that are simultaneously security assets and security surfaces:
- The DER interconnection standard 1547-2018 and its 2020 amendment define ride-through and grid-support functions and require a communication interface.
- The IBR transmission interconnection standard 2800-2022 defines performance for transmission-connected IBR.
- The DER communication protocol 2030.5 and the 1547.3-2023 cybersecurity guide for DER interoperability address secure communication.
- IEC 61850 and IEC 62351 cover substation communication and its security; IEC 62443 covers industrial control system security by zones and conduits.
- The NIST Cybersecurity Framework 2.0 (2024) and NIST SP 800-82 Rev. 3 (2023) provide the process baseline for OT security.
Where these standards specify security extensions, adoption lags deployment. Many fielded devices still rely on perimeter assumptions that the Energy Internet no longer satisfies.
4. How corrupted data propagates through state estimation and OPF
4.1 The state estimation model
The state estimator combines redundant measurements with the network model to compute the most probable operating state. The measurement model is:
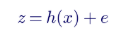
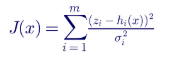
where z is the vector of m measurements (voltages, flows, injections), x is the vector of n states (bus voltage magnitudes and angles), h(x) is the nonlinear measurement function and e is the measurement error. Weighted least squares minimizes:
4.2 Residual-based bad-data detection
Under normal Gaussian errors, J(x̂) at the solution follows a chi-square distribution with m − n degrees of freedom. The classic test flags bad data when:
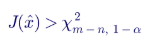
Worked example. A 138 kV subtransmission model has m = 60 measurements and n = 29 states. With α = 0.01, the threshold is χ²(31, 0.99) ≈ 52.2. A random gross error on one meter — for example, a 20 MW error on a flow with σ = 2 MW — adds roughly (20/2)² = 100 to J and is detected. The largest normalized residual test then identifies the bad meter.
4.3 Why a coordinated attack passes the test
In the linearized (DC) model, z = Hx + e. Suppose an attacker adds a vector a to the measurements, chosen as:

for any state-shift vector c. The estimator then computes x̂ₐ = x̂ + c, and the residual is:

The residual — and therefore J — is unchanged. The attack is invisible to the bad-data detector. It does not increase the estimation error; it moves the estimated operating point.
Worked example — a 138 kV corridor. Bus 3 connects to buses 1 and 2 through 138 kV lines with reactances x₁₃ = x₂₃ = 0.05 pu on a 100 MVA base. The attacker wants the estimator to believe the angle at bus 3 is 0.02 rad lower than it is (c₃ = −0.02). The required falsifications are:
| Measurement | Required change |
|---|---|
| Flow 1→3 | Δθ / x = 0.02 / 0.05 = 0.4 pu = +40 MW |
| Flow 2→3 | +40 MW |
| Injection at bus 3 | −80 MW (more apparent load) |
| Injection at buses 1 and 2 | +40 MW each |
Five coordinated meter changes create an 80 MW phantom load at bus 3 that the bad-data detector cannot see. The defense is to make it impossible for the attacker to compute or deliver a = Hc:
- Protect a minimum set of measurements (for example, with PMUs and authenticated, encrypted channels) so that no stealthy attack vector exists.
- Change H unpredictably — moving target defense — so the attacker's model is out of date (Section 8).
- Cross-check with physics outside the estimator: independent revenue meters, inverter telemetry, line temperature monitoring.
4.4 From estimation error to dispatch error
The estimated state feeds the AC OPF, which minimizes cost subject to power balance:

voltage limits:

and thermal limits:

An attacker does not need to alter physical equipment. Manipulating boundary loads, DER output, voltages, tap positions or line ratings is enough to move the feasible region the optimizer sees.
Worked example — a falsified dynamic line rating. A 230 kV line has a true rating of 600 MVA. An attacker reduces the rating sent from the dynamic line rating system to 450 MVA during a peak hour when the line carries 520 MVA. The market sees congestion that does not exist and re-dispatches 70 MW from a $25/MWh resource to a $95/MWh peaker. The congestion cost is about 70 × (95 − 25) = $4,900 per hour, and the locational prices on the import side rise. The reverse attack — reporting 750 MVA when the true rating is 600 MVA — schedules power into a real overload, accelerating conductor annealing and sag and, in the worst case, initiating a cascade.
4.5 Mitigation inside the optimizer
Three techniques protect the mathematics of the optimization itself:
| Technique | How it works | Engineering trade-off |
|---|---|---|
| Robust optimization | Treats inputs as uncertain within a bounded set and optimizes for the worst case in that set | Immune to small manipulations; costs some economic efficiency |
| Privacy-preserving distributed OPF | Transmission and distribution solve sub-problems and exchange only boundary variables (Lagrange multipliers, boundary voltages and power); homomorphic encryption can keep those exchanges confidential | Limits what an attacker sees and can corrupt; adds computation and latency |
| Feasibility slack variables | Penalized slacks on constraints let the solver return a solution and an alarm when corrupted data make the problem infeasible | Converts a solver crash into a diagnosable alert |
5. Detection and localization
5.1 Three families of detectors
| Family | Principle | Strength | Weakness |
|---|---|---|---|
| Model-based | Physics or control model predicts behavior; residuals or observers flag mismatches | Works on never-before-seen attacks; can localize | Blind to attacks consistent with the model; needs accurate models |
| Data-driven | ML learns normal and abnormal patterns from data | Detects subtle, high-dimensional anomalies | Needs representative data; fragile under distribution shift; can itself be attacked |
| Physics-informed hybrid | Physics residuals combined with ML classifiers, or physics embedded in the learning model | Better generalization, fewer false alarms, more trustworthy | Needs both modeling and data engineering |
A cross-cutting lesson: detectors validated only in idealized phasor-domain simulations often fail on real protection logic, measurement noise and latency. Validation in real-time co-simulation and hardware-in-the-loop (HIL) environments transfers far better to the field.
5.2 The most useful signal is a cyber-physical inconsistency
In Keentel's experience, the most informative anomalies are mismatches between the cyber and physical views:
- A valid, authenticated command produces an implausible physical response.
- Communications look healthy while control performance degrades.
- A device reports a nominal status that does not match measured behavior.
- A controller's actions match its cyber inputs but not the power-system conditions.
Single-domain monitoring misses these. Joint monitoring of a state vector that combines physical variables (voltage, current, frequency, P, Q, breaker and inverter states) with cyber variables (latency, retransmissions, command logs, authentication events, configuration hashes) catches them.
5.3 Hardware-assisted detection
Some compromises never appear as abnormal grid behavior until it is too late — a firmware implant waiting for a trigger date, for example. Monitoring device execution at the firmware level, attesting firmware hashes at boot, and comparing configuration files against a golden baseline (as CIP-010 requires for applicable systems) complement network and measurement monitoring.
5.4 Internal network security monitoring
FERC Order 887 (January 2023) directed NERC to require internal network security monitoring (INSM) inside trusted zones. NERC's response, CIP-015-1, was approved by FERC in Order 907 (June 2025). It requires INSM for networks within the Electronic Security Perimeter of high-impact BES Cyber Systems and of medium-impact systems with External Routable Connectivity, with compliance phased in over several years, and FERC directed an extension to Electronic Access Control or Monitoring Systems and Physical Access Control Systems. INSM is the natural home for the cyber half of a cyber-physical detector: east-west traffic baselines, protocol anomaly detection and data retention for investigation.
5.5 Detection performance must be judged physically
A detector should be scored on what it protects, not only on its confusion matrix:
| Metric | Why it matters |
|---|---|
| Time to detect | Dominates unserved energy, as Figure 1 shows |
| Time to localize | Determines how much of the system must be isolated |
| False-alarm rate per day | Determines whether operators trust and act on alarms |
| Physical impact avoided (MWh, MW-s, overload minutes) | Connects detection to reliability |
| Robustness to adaptive attack | Determines whether performance survives a capable adversary |
5.6 Timing integrity — a quantified view
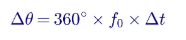
A PMU's phase-angle error from a timing error Δt is:
| Metric | Why it matters |
|---|---|
| Time to detect | Dominates unserved energy, as Figure 1 shows |
| Time to localize | Determines how much of the system must be isolated |
| False-alarm rate per day | Determines whether operators trust and act on alarms |
| Physical impact avoided (MWh, MW-s, overload minutes) | Connects detection to reliability |
| Robustness to adaptive attack | Determines whether performance survives a capable adversary |
6. Decision-aware resilience for storage-integrated systems
6.1 Storage capacity is not resilience
A battery can be physically intact after a disturbance and still provide no help. It may have been depleted by energy arbitrage before the event. Its reported SoC may be wrong because of sensor error or false data. Or the inverter or network may be unable to deliver the power the operator asks for. In each case, the resilience shortfall comes from the decision process, not from asset damage.
Keentel frames this with a
decision-induced resilience deficit:

where zₜ is the true decision-relevant state, ẑₜ is the state reported or estimated for the decision layer, uₜ is the chosen resilience action, R^exp is the resilience the operator expects and R^real is the resilience actually achieved. A positive deficit means the decision layer overestimated achievable resilience — because of depleted but unobserved storage, distorted SoC measurements, communication delay, forecast error, or ignored feasibility limits.
6.2 Five challenges
| Challenge | Main issue | Resilience consequence | Needed decision support |
|---|---|---|---|
| Cross-horizon energy coupling | Energy at disturbance onset is inherited from pre-event dispatch | Low usable energy when needed | Storage-aware reserve scheduling |
| Cyber-physical storage state | SoC is measured, estimated and communicated | Wrong dispatch, or unused capability | Independent validation of reported SoC |
| Decision-induced deficit | Reported state differs from true state | Planned resilience exceeds actual | Decision-aware metrics |
| Source-grid-load-storage coordination | Many resources must act together under limited headroom | Misallocation of scarce energy | Coordinated dispatch and restoration logic |
| Physical feasibility limits | Inverter current, modulation voltage and network transfer limits bind before energy runs out | Energetically possible but physically impossible actions | Security-margin screening |
6.3 Three readiness metrics and an action gate
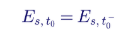
Energy at the disturbance onset is inherited, not reset:
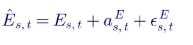
The decision layer sees a reported energy that may include an attack bias and measurement noise:
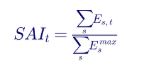
Three metrics then describe readiness. The storage adequacy index is usable energy relative to capacity:
The decision integrity gap measures how far reported energy departs from true energy:
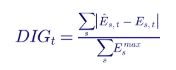
The physical security margin is the smallest of the margins to power-flow solvability, inverter overcurrent and inverter modulation-voltage limits:

A candidate resilience action is admissible only if all three conditions hold:

This action gate shifts resilience assessment from post-event measurement to pre-action screening: should this load pickup, island transfer or emergency dispatch be allowed, slowed or blocked?
Worked example — three batteries serving a critical 34.5 kV feeder group.
| BESS | Capacity (MWh) | True energy (MWh) | Reported energy (MWh) |
|---|---|---|---|
| A | 200 | 120 | 120 |
| B | 100 | 30 | 75 (falsified) |
| C | 100 | 60 | 62 |
| Total | 400 | 210 | 257 |
SAI = 210 / 400 = 0.53. DIG = (0 + 45 + 2) / 400 = 0.12. If the utility's gate requires SAI ≥ 0.40 and DIG ≤ 0.05, the plan fails on integrity, not adequacy. The correct action is to dispatch based on independently validated energy (revenue-grade metering of cumulative throughput, cell-level BMS data through a separate path) and to plan restoration on 210 MWh, not 257 MWh. Planning on 257 MWh would schedule a load pickup that collapses about 47 MWh early — exactly the decision-induced deficit.
6.4 Sizing a resilience readiness reserve
A practical rule for the minimum SoC to hold as a resilience reserve is:

where Pdef is the credible deficit (MW), Tbridge is the time to detect and recover (h), ηd is discharge efficiency and SoCmin is the operating floor.
Worked example. For the 138 kV area in Figure 1: Pdef = 100 MW, Tbridge = 1.25 h (15 minutes to detect plus 1 hour to restore DER), ηd = 0.93, Enom = 400 MWh, SoCmin = 5%:
SoCres = (100 × 1.25) / (0.93 × 400) + 0.05 ≈ 0.336 + 0.05 ≈ 39%.
Holding 39% of a 400 MWh battery in reserve gives up about 155 MWh of arbitrage capacity. At an assumed average spread of $40/MWh and one cycle per day, that is roughly $6,200 per day, or about $2.3 million per year — a real cost that must be weighed against avoided outage cost. In Figure 1, the readiness reserve cut expected unserved energy from about 10 MWh to 3 MWh even with fast detection. Without fast detection, the Tbridge term grows to 4–6 hours and the required reserve exceeds the battery's capacity: detection and storage are complements, not substitutes.
6.5 Energy-state-driven restoration
Fixed restoration sequences are "energy-blind." They keep picking up load when reserves are low, or move too slowly when storage is plentiful. A better approach uses the normalized energy state as a supervisory signal:
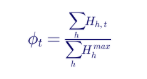
and limits how many buses or loads may be energized per step:
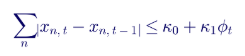
When ϕ is high, restoration proceeds quickly; as stored energy (battery or hydrogen) declines, the pace slows automatically. Published studies on benchmark systems report that this kind of adaptive pacing raises a weighted resilience index by roughly 10 percentage points and serves 12–15% more cumulative load than a fixed sequence. Long-duration storage — flow batteries, hydrogen — shows the largest benefit in blackout restoration studies because it sustains support over the multi-hour restoration window that short-duration lithium-ion cannot cover.
6.6 Feasibility: energy is necessary but not sufficient
During restoration, topology changes stepwise, voltage support is weak, and inverter headroom shrinks as load is added. A
grid-forming BESS may have plenty of energy and still reach its current limit or its maximum modulation voltage. Security-region analysis embeds those limits into the power-flow model and tracks the margin at each restoration stage:
| Restoration stage | Security margin | Operational interpretation |
|---|---|---|
| Early stages | Large, positive | Secure; adequate inverter and network headroom |
| Middle stages | Small, positive | Near-limit; monitor closely |
| Late stage | About zero | Boundary contact; the next pickup is critical |
| Next proposed pickup | Negative | Infeasible; block the action or add reactive or inverter headroom |
Reducing the inverter current limit shrinks the feasible P–Q region. For black-start and microgrid plans, Keentel checks every planned pickup against this margin in EMT and RMS simulation before the plan is approved.
7. Measuring resilience across dimensions
7.1 The resilience curve and resilience loss
A system performance function φ(t) — load served, a frequency-quality index, or a weighted combination — traces the familiar resilience "trapezoid": pre-event, absorption, degraded operation, recovery and post-event. Resilience loss is the normalized area lost over a horizon TH:
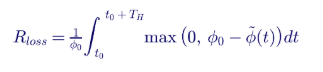
where φ̃(t) is set to zero after a collapse. In Figure 1, φ is load served in per unit and Rloss is in pu·h; multiplying by the 400 MW base gives expected unserved energy.
For dynamic studies, a useful performance function combines frequency quality and inter-machine coherence:
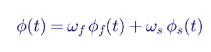
where φf falls from 1 to 0 as the center-of-inertia frequency moves from nominal toward a critical value (for example 59.0 Hz), and φs falls as the frequency spread between generators approaches a coherency tolerance.
7.2 Five dimensions
Resilience is usually assessed one dimension at a time. Keentel assesses five together:
| Dimension | Sub-index | Built from |
|---|---|---|
| Physical | Dphy | Weighted fraction of generation, storage or substation capacity lost |
| Operational | Dop | Maximum RoCoF, depth of performance drop and peak inter-generator frequency spread, each normalized to a critical value and combined as X / (1 + X) |
| Digital-cyber | Dcyb | Weighted fraction of assets with compromised observability, controllability, integrity and availability |
| Climatic | Dclim | Weighted normalized intensity of temperature, wind, ice, snow and other stressors |
| Regulatory and institutional | Dreg | Fraction of reference control categories (for example a 10-category map drawn from NERC CIP and IEC 62443) with a weakness |
7.3 The multidimensional resilience index
The three endogenous dimensions form a core with an additive part and a coupling part:
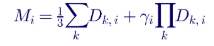
The product term is near zero if any one dimension is intact — an intact dimension stops propagation — and becomes significant only when all are degraded together. γ = 0 for single-vector events and 1 for coordinated multi-vector events. The exogenous dimensions amplify the core:

Worked example — two attack scenarios on a 230 kV system with 1,500 MW of grid-forming PV.
| Quantity | Scenario 1: one 190 MW plant's setpoint manipulated | Scenario 2: six plants disconnected, communications disrupted, winter peak |
|---|---|---|
| Dphy | 0.10 | 0.70 |
| Dop | 0.18 | 0.68 |
| Dcyb | 0.06 | 0.64 |
| Mean of the three | 0.113 | 0.673 |
| Coupling product | 0.001 (γ = 0) | 0.305 (γ = 1) |
| Core M | 0.113 | 0.978 |
| Climatic factor (1 + Dclim) | 1.00 | 1.15 |
| Regulatory factor (1 + Dreg) | 1.00 | 1.60 (6 of 10 control categories weak) |
| MDRI | 0.113 | 1.80 |
The coordinated scenario scores about 16 times worse. A logarithmic decomposition shows where the increase comes from:
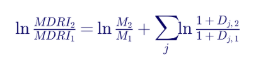
Here ln(15.9) = 2.77, of which ln(0.978/0.113) = 2.16 (78%) comes from the endogenous core and its coupling, and ln(1.15 × 1.60) = 0.61 (22%) from climate and institutional weaknesses. The practical message: closing six common control weaknesses — no multi-factor authentication on remote access, unpatched firmware, default credentials on RTUs and controllers, poor IT/OT segmentation, unenforced DER security requirements, and thin OT monitoring at remote substations — would have removed a 1.6× amplifier from the worst case without any physical investment.
8. Adversarial risk and trustworthy AI
8.1 AI as shield and weapon
AI improves forecasting, detection and decision support, and it also introduces new attack surfaces:
| ML application | Consequence of a successful adversarial attack |
|---|---|
| Load, renewable and price forecasting | Wrong commitment, reserve and storage schedules |
| Predictive maintenance | Premature work, or missed failures |
| Intrusion and FDI detection | Attacks evade detection |
| Autonomous or advisory control | Unsafe or destabilizing actions |
| Customer-facing chatbots | Wrong billing or service information; credential theft |
| Operator decision-support assistants (LLMs) | Wrong operational recommendations; prompt injection |
8.2 Adversarial attacks must obey physics
In image classification, a tiny perturbation can flip a classifier's decision while the image looks unchanged. In power systems, the perturbation must also satisfy the measurement model so that the conventional bad-data detector stays quiet. Simple gradient attacks adapted from computer vision tend to raise the residual and get caught before they fool the ML detector. Optimization-based attacks can be crafted to evade both the ML detector and the bad-data detector, but there is a trade-off: the more the perturbation is shaped to evade the ML model, the less it preserves the physical effect the attacker wanted. A useful measure is the ratio of attack intensity before and after adversarial shaping; values near 1 mean the attack keeps its effect while evading detection.
8.3 Static defenses are not enough
Adversarial training, gradient masking and input transformation all harden a detector against known attacks. But they are static. An adversary who can probe a deployed model over weeks of reconnaissance can optimize against it. Grid monitoring runs continuously for years, which gives patient attackers that time.
8.4 Moving target defense
Moving target defense (MTD) changes the system so that the attacker's knowledge goes stale:
| Time after flow loss | Event |
|---|---|
| 0 s | All secondary flow lost in the affected CDUs |
| About 2–3 s | Pumps coast down; flow near zero |
| About 6 s | Worst-rack GPUs reach 85 °C; hardware throttling begins |
| About 8 s | GPU power falls to the throttling floor (30% in the model) |
| 15 s | Power restored; pumps restart and ramp up |
| About 35 s after flow loss | Temperatures recover; GPUs return to full power |
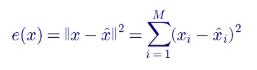
When cyber and physical features are combined in the same input vector, the autoencoder learns their normal relationship and flags cases where that relationship breaks. Sequence models (LSTM autoencoders, temporal convolutional networks, transformers) add time, which matters for replay, delay and slow-drift attacks.
8.6 Explaining a detection
An anomaly score alone does not tell an operator what to do. Feature attribution does. SHAP expresses a model output as a baseline plus additive feature contributions:
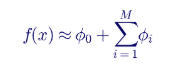
For unsupervised models, a normalized per-feature reconstruction ratio serves the same purpose:
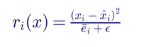
Worked example — explaining an alarm at a 34.5 kV solar plus storage collector substation.
The detector's anomaly score is 0.91 against a baseline of 0.08.
| Feature | Domain | Contribution |
|---|---|---|
| DNP3 command rate to plant controller | Cyber | +0.29 |
| Reactive power response vs. volt-VAR curve | Physical | +0.24 |
| New source IP on control VLAN | Cyber | +0.14 |
| Feeder voltage at POI | Physical | +0.09 |
| Packet latency to SCADA master | Cyber | +0.04 |
| Irradiance-normalized active power | Physical | +0.03 |
| Sum of contributions | — | 0.83 (0.91 − 0.08) |
Cyber features contribute 0.47 and physical features 0.36. Both are high, and the top physical feature is a control-response mismatch. The explanation points to a genuine cyber-physical event — an unexpected source issuing frequent commands that change reactive power behavior — rather than a communications fault (cyber only) or a feeder disturbance (physical only). The response is to isolate the control VLAN path, place the plant controller in local autonomous mode and preserve logs for investigation.
8.7 Governance: treat the detector as a cyber asset
A detector that can be tampered with is a liability. Keentel recommends:
- Version control, change approval and testing for models, thresholds and training data, following the same discipline as CIP-010 configuration change management.
- Drift monitoring of input data quality, anomaly-score distributions and explanation behavior.
- Calibrated uncertainty, so operators can distinguish strong detections from ones that need cross-checking.
- Secure data provenance and access control over training data and model artifacts.
- Running security-critical scoring logic in a protected environment (for example, a trusted execution environment) on hardened hosts.
- Mapping the AI lifecycle to the NIST CSF 2.0 functions — Govern, Identify, Protect, Detect, Respond, Recover — and to NIST SP 800-82 for OT.
Generative AI and LLM assistants are useful for summarizing alerts, drafting incident descriptions and answering analyst questions, but they must be grounded in verified data, checked against physical rules and protection logic, and kept in an advisory role with a human making the decision.
9. Price forecasting as a security function
9.1 Why forecasting is now operational
In ISO/RTO markets, locational marginal prices (LMPs) are shadow prices of security-constrained unit commitment and economic dispatch. Forecasts of those prices drive generator offers, storage schedules, DER aggregation, demand response, hedging with financial transmission rights, and ISO situational awareness. In an Energy Internet, price formation is shaped by renewable uncertainty, millions of automated participants, storage, coupled gas and hydrogen systems, and data quality — so forecasting has become a cyber-physical learning problem.
9.2 From accuracy to resilient market intelligence
| Conventional objective | Resilient objective |
|---|---|
| Minimize average error | Support reliable operational decisions |
| Deterministic point forecast | Calibrated probabilistic forecast (quantiles, scenarios) |
| Fit historical data | Adapt to extreme events and changing conditions |
| One node or market | Generalize across nodes, regions and energy carriers |
| Standalone tool | Integrated with optimization and control |
| Offline updates | Continuous monitoring and governed retraining |
| Data-only | Physics, topology and cyber-trust aware |
Topology-aware models (graph neural networks over the transmission network) capture how congestion propagates. Probabilistic methods — quantile regression, deep ensembles, conformal prediction — provide calibrated intervals; calibration matters as much as sharpness, because a narrow interval that misses price spikes misleads storage and reserve decisions.
9.3 The forecast as an anomaly detector
A calibrated probabilistic forecast is also a detector. If the realized price, load or DER output falls far outside the predicted distribution — beyond, say, the 0.5th–99.5th percentile band — repeatedly and without a physical explanation, the inputs or the market may have been manipulated. A forecast-based anomaly score can then trigger operator review, fallback models, robust optimization or additional cyber diagnostics.
10. Attack-resilient routing of control traffic
10.1 The network as a weighted graph
Encryption and authentication assume trustworthy endpoints and paths. A compromised gateway can still forward messages that are cryptographically valid and factually wrong. Keentel therefore treats the communication network as a graph: endpoints (inverters, IEDs, PMUs, controllers) are nodes, repeaters (routers, gateways, protocol converters) are intermediate nodes, and links are edges. Each edge carries a weight that reflects the current evidence of manipulation, supplied by detectors on the path.
10.2 Edge weights from fused detectors
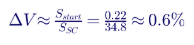
Each edge weight combines physics-based residual tests and learned detectors, normalized and fused so that stronger evidence always increases the weight. A decay function lowers the weight when no new evidence appears, so a cleaned link can return to service:

where se(k) is the fused detector score at step k and λ (for example 0.9) sets the memory.
10.3 Routing algorithms
| Traffic pattern | Algorithm | Why |
|---|---|---|
| Point-to-point control and telemetry | Dijkstra shortest path | Lowest total manipulation weight from source to destination |
| Broadcast of setpoints or synchronization | Prim or Kruskal minimum spanning tree | Reaches every node over the most trusted edges |
| Critical traffic (trip, transfer trip, emergency curtailment) | Two or more node-disjoint paths | An attacker must compromise a device on every path |
10.4 Epsilon-greedy exploration
A purely greedy router never revisits a path it distrusts, so it never learns when that path has been cleaned. An epsilon-greedy policy sends traffic on the best path with probability 1 − ε and explores an alternative with probability ε.
Worked example. With ε = 0.05 and two alternative paths, each alternative is probed with probability 0.025 per routing cycle. The number of cycles N for a 95% chance of probing a given recovered path at least once is:
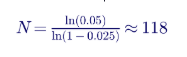
At a 1-second routing cycle, a cleaned path is rediscovered within about two minutes, while 95% of traffic stays on trusted paths. For critical traffic, two node-disjoint paths with an independent per-path compromise probability of p = 0.02 reduce the probability that every copy is corrupted to p² = 0.0004.
10.5 Where routing runs
Fast local rerouting belongs at edge gateways, feeder and microgrid controllers, so decisions complete within a sampling period without wide-area communication. Network-wide optimization belongs at the control center or an SDN controller, which periodically recomputes consistent routes. Exploration should be capped network-wide and staggered so that too much traffic is never on unproven paths at once. The routing layer decides how commands travel, never what they say, so it can adapt freely without touching protection or control logic. This aligns with IEC 62443 zones and conduits and with zero-trust principles.
11. Large AI data-center loads and post-quantum readiness
11.1 Large loads as stressor, attack surface and resource
Hyperscale AI campuses at 138, 230 and 345 kV can ramp hundreds of megawatts in seconds and can drop off the system almost instantly during a voltage dip if their UPS and protection systems transfer to on-site sources. NERC has documented such events and has an active large-loads effort. From a security standpoint:
- The volatility of these loads narrows the margin between a benign workload swing and a destabilizing disturbance, and can mask an attack.
- Price-responsive workload scheduling makes the market a control channel into very large physical loads.
- Treated as grid-interactive assets, data centers can provide fast frequency response and other services — but those control and communication paths must then be secured as critical infrastructure.
Keentel's interconnection studies for large loads include ride-through and voltage-sensitivity performance, ramp-rate limits, protection coordination with UPS transfer schemes, and the cyber architecture of any demand-response or flexible-load interface.
11.2 Post-quantum cryptography
Relays, RTUs, inverters and meters installed today may still be in service in the 2040s. NIST published its first post-quantum standards in August 2024: FIPS 203 (ML-KEM, key establishment), FIPS 204 (ML-DSA, signatures) and FIPS 205 (SLH-DSA, hash-based signatures). They are larger than today's elliptic-curve primitives:
| Primitive | Public key (bytes) | Signature or ciphertext (bytes) |
|---|---|---|
| ECDSA P-256 (today) | 64 | 64 |
| ML-DSA-44 (FIPS 204) | 1,312 | 2,420 |
| ML-DSA-65 (FIPS 204) | 1,952 | 3,309 |
| SLH-DSA-128s (FIPS 205) | 32 | 7,856 |
| ML-KEM-768 (FIPS 203) | 1,184 | 1,088 |
For protection messaging such as routable GOOSE and sampled values, a signature of 2–8 kB inside a 1,500-byte Ethernet frame means fragmentation or new framing, and signing and verification must fit within a few milliseconds. Research has shown this can be engineered, but it is not a drop-in change. Owners should inventory where public-key cryptography is used, prioritize long-lived and high-impact assets, and specify crypto-agility (the ability to change algorithms by firmware update) in new procurements.
12. Mapping to U.S. requirements
| Topic | U.S. requirement or guidance | How it applies |
|---|---|---|
| Asset categorization | NERC CIP-002 | Identifies high-, medium- and low-impact BES Cyber Systems — the scope for the rest of CIP |
| Low-impact controls | CIP-003 | Security plans, electronic and physical access controls, vendor electronic remote access controls at low-impact sites, including many IBR plants |
| Electronic perimeters and remote access | CIP-005 | Electronic Security Perimeters, interactive remote access with multi-factor authentication |
| System security | CIP-007 | Ports and services, patching, malicious code prevention, security event logging |
| Configuration and vulnerability management | CIP-010 | Baselines, change control, vulnerability assessments — extend the discipline to all assets |
| Information protection | CIP-011 | Protects BES Cyber System Information, including network models that enable FDI |
| Supply chain | CIP-013 | Vendor risk management for procurement of high- and medium-impact systems |
| Internal network security monitoring | CIP-015 (FERC Order 887 directive; approved in Order 907) | East-west monitoring inside Electronic Security Perimeters, phased in |
| DER market participation | FERC Order 2222 | Aggregations in wholesale markets; aggregator and DSO data exchange must be secured |
| DER interconnection and interoperability | 1547-2018 (with 2020 amendment), 1547.3-2023 cybersecurity guide, 2030.5 | Grid-support functions, communication interface, DER cybersecurity practice; state rules (for example California Rule 21) add requirements |
| IBR performance | 2800-2022, NERC PRC-028, PRC-029, PRC-030 | Ride-through, disturbance monitoring, event analysis — data that also supports cyber forensics |
| OT security frameworks | NIST CSF 2.0, NIST SP 800-82 Rev. 3, IEC 62443, DOE CESER guidance | Program structure, OT controls, zones and conduits |
| Post-quantum | NIST FIPS 203, 204, 205 | Migration planning and crypto-agility |
Note that many DER and some IBR facilities fall outside NERC CIP entirely. For them, cybersecurity rests on interconnection agreements, state commission rules, utility DER technical requirements and procurement specifications. Keentel recommends that utilities write minimum cybersecurity requirements — authenticated communications, no default credentials, signed firmware, local fallback behavior, logging — into their DER interconnection technical requirements.
13. A practical roadmap
| Horizon | Action | Outcome |
|---|---|---|
| 0–6 months | Map the three layers for your footprint: assets, communication paths, decision tools and trust boundaries | Know where attacks enter and where they land |
| 0–6 months | Close the common weaknesses: MFA on remote access, default credentials, unpatched firmware, IT/OT segmentation | Remove the largest regulatory-dimension amplifier |
| 6–12 months | Deploy cyber-physical monitoring: INSM plus physics residuals from SE, PMUs and plant telemetry | Cut time-to-detect from hours to minutes |
| 6–12 months | Independent validation of storage SoC and DER output; storage readiness reserves for critical areas | Close the decision integrity gap |
| 6–18 months | HIL and co-simulation testing of controls and detectors against FDI, LAA, timing and firmware attacks | Detectors that work in the field, not just in simulation |
| 12–24 months | Governed AI: explainability, drift monitoring and change control for detectors and forecasts | Operators trust and act on alarms |
| 12–24 months | Multidimensional resilience assessment and an MDRI-style dashboard | Investment prioritized by measured resilience |
| 12–36 months | Post-quantum inventory and crypto-agility in procurement | Long-lived assets ready for migration |
14. Key takeaways
- The Energy Internet couples physical, cyber and decision layers; attacks enter at one and land at another.
- Coordinated false data can pass residual-based bad-data detection; defend the measurement model, not only the messages.
- Time-to-detect dominates resilience loss; invest first in fast cyber-physical detection.
- Usable, trusted, deliverable stored energy — not installed capacity — is what provides resilience.
- Measure resilience across dimensions; coupled degradation and institutional weaknesses multiply impact.
- AI is essential and is itself an attack surface; make it explainable, governed and robust to adaptive adversaries.
- Route critical traffic around compromised devices with trust-weighted, multi-path routing.
- Large flexible loads and post-quantum migration are near-term planning issues, not future ones.
15. How Keentel Engineering helps
Keentel Engineering brings power-system engineering and NERC compliance expertise to grid cybersecurity and resilience — the physical side that IT-focused security programs often miss.
- Cyber-physical resilience assessments for transmission, distribution, IBR, DER and microgrid systems, including resilience curves, unserved-energy estimates and multidimensional resilience indices.
- State estimation and OPF vulnerability studies, including FDI attack-space analysis, protected-measurement placement and PMU deployment planning.
- IBR and DER control studies in PSCAD and PSS®E — PLL and grid-support function tampering scenarios, weak-grid stability, ride-through and EMT validation of detectors and mitigations.
- Storage resilience engineering — readiness reserve sizing, SoC validation architecture, grid-forming BESS feasibility and black-start and restoration plans checked against security margins.
- NERC CIP program support — CIP-002 categorization, CIP-003 low-impact programs for IBR sites, CIP-005/007/010/011/013 evidence, and CIP-015 INSM planning.
- DER interconnection technical requirements — minimum cybersecurity provisions aligned with 1547-2018, 1547.3 and 2030.5 for utilities and developers.
- Large-load interconnection studies for data centers at 138–345 kV — ride-through, ramp limits, protection coordination and secure flexible-load interfaces.
- Timing and synchronization design for PMUs, protection and PRC-028 disturbance monitoring, including GNSS spoofing resilience.
- Owner's engineer services for AI-enabled monitoring and DERMS procurements, including governance and validation requirements.
Why clients choose Keentel Engineering
- Power-system depth. Keentel's engineers model what an attack does to voltage, frequency, flows and protection — from 4 kV distribution to 765 kV transmission.
- NERC compliance fluency. CIP, PRC and MOD requirements are handled by the same team that performs the engineering studies.
- EMT and HIL-ready modeling. Detectors and mitigations are tested against realistic control and protection behavior, not idealized models.
- Practical, prioritized recommendations. Findings are ranked by measured resilience benefit and cost.
- Independent perspective. Keentel is vendor-neutral and works for owners, developers and utilities.
Talk to Keentel Engineering. Call (813) 389-7871, email contact@keentelengineering.com, or book a 15-minute call at calendly.com/keentel-engineering/15min.
Part C — Case Studies
The three case studies below are anonymized composites based on conditions Keentel Engineering commonly encounters. Names, locations and identifying details have been changed or omitted, and figures are rounded.
Case Study 1 — The phantom load at a 138 kV substation
Situation. A mid-size utility in the U.S. Southeast noticed that its EMS state estimator occasionally showed 60–90 MW more load at a 138 kV substation than the distribution SCADA reported. The discrepancy never triggered the bad-data detector, and operators had begun to treat it as a "known modeling issue." During one afternoon peak, the estimate drove a re-dispatch that put a parallel 230/138 kV autotransformer within 4% of its emergency rating.
Analysis. Keentel reviewed the estimator configuration and measurement set. The suspect substation was observable through only five measurements — two line flows, two remote-end injections and one bus injection — all delivered through a single protocol converter at a communications hub. Keentel computed the attack space: a coordinated change to those five values could shift the bus angle without changing the residual, exactly as in Section 4.3. Forensic review of the converter found a configuration change made through a vendor remote-access account that was outside the change-management process. The change scaled two analog points; whether it was malicious or a botched maintenance action was never conclusively determined, but the effect was indistinguishable from a stealthy FDI attack.
Engineering solution.
- Added a PMU at the substation on an authenticated, separately routed channel, making the bus a protected measurement that no single-path change can defeat.
- Implemented a cross-domain check comparing estimator bus load with the sum of feeder-head telemetry from distribution SCADA, with an alarm at a 15 MW sustained mismatch.
- Brought the protocol converter under CIP-010 baseline monitoring and removed the standing vendor remote-access account in favor of supervised, multi-factor sessions under CIP-005.
- Redesigned measurement routing so that the five measurements traverse two different hubs.
Outcome. The recurring discrepancy disappeared. Two later configuration drifts were caught by the baseline monitor within one day. The utility's estimator now has no stealthy attack vector involving fewer than nine coordinated measurement changes at that substation, and the near-overload condition has not recurred.
Case Study 2 — A virtual power plant that could drop 140 MW at once
Situation. A utility in the Mountain West planned to accept a 140 MW residential battery virtual power plant into its DER program and the regional wholesale market under an Order 2222 aggregation. The aggregator's platform controlled about 28,000 home batteries through a single cloud service. The utility's planning team asked Keentel whether a compromise of that platform could threaten system reliability.
Analysis. Keentel modeled the utility's footprint, including its 230 kV ties and a weak 69 kV island-capable area that could be served by a 34.5 kV-connected grid-forming BESS during wildfire-related shutoffs. Findings:
- On the interconnected system, a simultaneous 140 MW swing from full charge to full discharge (a 280 MW change) produced a frequency deviation well within normal response, but a synchronized swing timed with a large unit trip pushed frequency close to the first underfrequency load-shedding stage under light-load, low-inertia conditions.
- In the islanded 69 kV area, just 18 MW of the fleet was located inside the island. A malicious step of that size produced an initial RoCoF above 1.5 Hz/s against the island's limited inertia and would have tripped the grid-forming BESS on its own protection.
- A dynamic attack modulating the fleet at the island's dominant oscillation frequency could drive sustained oscillation even at smaller amplitudes.
Engineering solution.
- Required the aggregator to enforce a fleet-level rate limit of 20 MW per minute for non-emergency commands, with utility override.
- Required signed firmware, unique device credentials and local 1547-2018 default behavior on loss of communication or untrusted commands.
- Added a utility-side plausibility check in the DERMS that blocks mass commands exceeding the rate limit and alarms on commands issued outside market dispatch windows.
- During island operation, the DERMS automatically places in-island devices in autonomous frequency-watt mode and ignores cloud setpoints.
- Wrote these provisions into the utility's DER interconnection technical requirements so they apply to future aggregators as well.
Outcome. The aggregation was approved with the conditions in place. EMT studies showed that the worst credible attack in island mode was reduced to a RoCoF below 0.3 Hz/s, within the grid-forming BESS ride-through capability. The utility now applies the same requirements to EV-charging aggregations.
Case Study 3 — Resilience reserve for a hospital and water-treatment microgrid
Situation. A municipal utility in the U.S. Northeast operates a 34.5 kV microgrid serving a regional hospital, a water-treatment plant and emergency services, supplied normally from a 115 kV substation. On-site resources included 12 MW of solar, a 10 MW / 40 MWh BESS and two diesel generators. The BESS also earned revenue in the wholesale energy and regulation markets. A tabletop exercise asked what would happen if a winter storm outage coincided with a cyber intrusion that corrupted BESS telemetry.
Analysis. Keentel built a decision-aware model of the microgrid:
- Market dispatch routinely left the BESS at 15–25% SoC in winter evening hours.
- BESS SoC reached the microgrid controller through a single gateway with no independent check, so a decision integrity gap was undetectable.
- Security-margin analysis showed that, with one diesel unavailable, the BESS inverter would reach its current limit when the water plant's large pumps started, even with ample energy — an energetically possible but physically infeasible step.
Under the combined scenario (storm outage, one diesel down, SoC reported at 60% but actually 18%), the restoration plan collapsed after about 50 minutes and critical load was interrupted for roughly 4 hours.
Engineering solution.
- Set a seasonal resilience reserve: SoCres of 45% from November through March during storm watches, calculated from the critical load, diesel start and synchronization times and a two-hour bridge.
- Added independent SoC validation using revenue-grade metering of cumulative charge and discharge energy, compared with BMS-reported SoC; a gap above 5% blocks restoration actions that depend on BESS energy.
- Re-sequenced pump starts with soft starters and added a security-margin check in the microgrid controller that defers pickups when inverter headroom falls below 10%.
- Moved the BESS gateway behind the utility's monitored OT network with INSM-style traffic baselining.
Outcome. In the re-run exercise, the microgrid served all critical load through a simulated 10-hour outage with one diesel unavailable, and the falsified telemetry was detected in under five minutes. The utility estimated the reserve's lost market revenue at roughly 6% of annual BESS revenue — a cost its board accepted for critical-facility resilience.
Part D — Technical FAQ: Cyber-Physical Resilience for the Energy Internet
A grid in which large numbers of DER, IBR, storage and flexible loads are coordinated through communication networks, software and markets, with energy and information flowing in both directions. It is the practical end state of today's DER growth, Order 2222 aggregation and digital grid operations.
IT security protects confidentiality, integrity and availability of information. Cyber-physical security must also protect physical behavior — frequency, voltage, flows and prices — and judge success by physical consequences. Attacks are realized through physics, so defenses must be evaluated physically.
An attack that corrupts measurements or estimates used by monitoring and control. Its most dangerous form is consistent with the network model, so it shifts the estimated state without raising the bad-data residual.
Residual tests catch errors that are inconsistent with the model. If the injected vector equals H times a state shift (a = Hc), the residual is unchanged. Defenses include protected measurements such as authenticated PMUs, independent cross-checks and moving target defense.
Coordinated switching of many compromised high-wattage, internet-connected loads — EV chargers, heat pumps, thermostats — to disturb frequency or voltage. Dynamic versions modulate load in phase with oscillations and are most dangerous in low-inertia systems and islands.
Individually no; in aggregate, yes. Thousands of devices behind one cloud platform or one firmware image can act as a single multi-hundred-megawatt resource with a single point of compromise.
An attacker changes PLL gains or other control parameters slightly and slowly. In a weak grid this can move the plant toward control instability without triggering setting-limit alarms. Detection requires comparing measured dynamic response with an expected model.
If it is a BES facility, its BES Cyber Systems are categorized under CIP-002 — usually low impact, which brings CIP-003 obligations including vendor electronic remote access controls. Non-BES DER are outside CIP but subject to state rules and utility interconnection requirements.
NERC's internal network security monitoring standard, developed in response to FERC Order 887 and approved by FERC in 2025. It requires monitoring of network traffic inside Electronic Security Perimeters for high-impact and certain medium-impact systems, with phased compliance dates.
As fast as practical. In Keentel's illustrative 138 kV example, reducing time-to-detect from four hours to fifteen minutes cut unserved energy by about 98%. Detection time is usually the single most valuable resilience lever.
Because what matters is usable energy at the moment of the event, trusted information about that energy, and the inverter and network capability to deliver it. A depleted, mis-reported or headroom-limited battery provides little resilience.
Start from the credible deficit, the time needed to detect and recover, discharge efficiency and the operating floor: SoCres = Pdef × Tbridge / (η × Enom) + SoCmin. Then weigh the lost market revenue against avoided outage cost.
The normalized difference between the storage energy the decision layer believes is available and the true energy. A large gap means decisions are being made on false information; actions that depend on that energy should be blocked until it is validated.
A single comparative metric that combines physical, operational and cyber degradation — including a coupling term for simultaneous degradation — and amplifies it by climatic and institutional stress. It reveals how coordinated attacks and weak controls multiply impact.
Yes. Adversarial examples, data poisoning and model probing can evade or corrupt ML detectors. In power systems the attacker must also satisfy physics, which helps defenders, but adaptive attackers can still succeed against static models.
Deliberately changing system parameters, network configuration or detector models so that an attacker's reconnaissance becomes outdated. Changing line reactances, for example, changes the measurement matrix and exposes attacks crafted on the old one.
Operators must decide quickly whether an alarm is a communications problem, a physical disturbance or a genuine cyber-physical attack. Feature attribution such as SHAP shows which cyber and physical signals drove the alarm and supports the right response.
Every microsecond of time error is 0.0216° of phase-angle error at 60 Hz. A slow spoof of 1 µs per second exceeds the 1% total vector error equivalent of about 26.5 µs in under 30 seconds. Holdover clocks, multi-constellation receivers and terrestrial time distribution are the main defenses.
They can ramp or drop hundreds of megawatts in seconds and increasingly respond to price signals. Their volatility can mask attacks, and any interface that lets the grid or market control them must be secured as critical infrastructure.
Now. NIST published FIPS 203, 204 and 205 in August 2024. Devices installed today may still be in service when quantum attacks are practical. Inventory public-key use, prioritize long-lived high-impact assets and require crypto-agility in new procurements.
References and Further Reading
Links and status were current at publication (October 2026).
- Resilient and Secure Large-Scale Energy Internet Systems, Technical Report PES-TR147, IEEE Power & Energy Society, Energy Internet Coordinating Committee, Task Force on Resilient and Secure Large-Scale Energy Internet Systems, July 2026.
- NERC, Critical Infrastructure Protection Reliability Standards CIP-002 through CIP-015. https://www.nerc.com/pa/Stand/Pages/ReliabilityStandards.aspx
- FERC, Order No. 887, Internal Network Security Monitoring for High and Medium Impact Bulk Electric System Cyber Systems (January 2023).
- FERC, Order No. 907, approving Reliability Standard CIP-015-1 (June 2025); Federal Register, July 2, 2025.
- FERC, Order No. 2222, Participation of Distributed Energy Resource Aggregations in Markets Operated by Regional Transmission Organizations and Independent System Operators (September 2020).
- NIST, The NIST Cybersecurity Framework (CSF) 2.0 (February 2024).
- NIST, SP 800-82 Rev. 3, Guide to Operational Technology (OT) Security (September 2023).
- NIST, FIPS 203 (ML-KEM), FIPS 204 (ML-DSA) and FIPS 205 (SLH-DSA) (August 2024).
- IEEE Std 1547-2018 and IEEE Std 1547a-2020, Interconnection and Interoperability of Distributed Energy Resources with Associated Electric Power Systems Interfaces.
- IEEE Std 1547.3-2023, Guide for Cybersecurity of Distributed Energy Resources Interconnected with Electric Power Systems.
- IEEE Std 2030.5, Smart Energy Profile Application Protocol.
- IEEE Std 2800-2022, Interconnection and Interoperability of Inverter-Based Resources Interconnecting with Associated Transmission Electric Power Systems.
- IEEE Std 1815 (DNP3), including Secure Authentication.
- IEC 61850, IEC 62351 and IEC 62443 series.
- U.S. Department of Energy, Office of Cybersecurity, Energy Security, and Emergency Response (CESER), grid cybersecurity resources.
- NERC, reports and alerts on inverter-based resource performance and large-load behavior, including the Large Loads Task Force.
- Liu, Y., Ning, P., Reiter, M. K., "False Data Injection Attacks against State Estimation in Electric Power Grids," ACM CCS, 2009.
- Lundberg, S. M., Lee, S.-I., "A Unified Approach to Interpreting Model Predictions," NeurIPS, 2017.
Disclaimer
This article is general technical information for educational purposes. It is not legal advice, cybersecurity certification or engineering advice for any specific facility, and it does not create a professional relationship. Requirements of NERC Reliability Standards, FERC orders, state commissions and utility interconnection rules govern; paraphrases here are for orientation only, and dates and status should be confirmed before reliance. Keentel Engineering's worked examples and figures use illustrative systems and data, not records of specific facilities.
Case studies are anonymized composite scenarios based on typical project conditions, not records of specific client projects. Figures are rounded and indicative.
Cybersecurity information in this article is defensive and high-level. It does not describe exploitable details of any specific product or system.
NERC, FERC, NIST, IEC and other names are the property of their respective owners. Keentel Engineering is not affiliated with or endorsed by these organizations or any equipment manufacturer.
© 2026 Keentel Engineering. All rights reserved.
| Office | Address | Phone |
|---|---|---|
| Head Office — Tampa | 400 N Ashley Dr STE #2600, Tampa FL 33602 | (813) 389-7871 |
| Austin | 5900 Balcones Drive STE 100, Austin TX 78731 | (512) 591-0752 |
| Sacramento | 1401 21st St Ste R, Sacramento CA 95811 | (916) 913-4524 |
| Baltimore | 306 W Redwood St STE 200, Baltimore MD 21201 | (410) 225-2181 |

About the Author:
Sandip "Sonny" R. Patel, P.E.
IEEE Senior Member · Founder & CEO, Keentel Engineering
In 1995, Sonny Patel earned his Electrical Engineering degree from the University of Illinois. But degrees don't build legacies — action does.
For three decades, he has worked the power industry from every side of the table: 16 years as a utility engineer at Exelon/Commonwealth Edison; generation leadership across hydroelectric, industrial steam turbine, and a 9 GW renewable fleet; NERC Regional Entity Senior Compliance Engineer and Audit Team Lead, auditing some of the nation's largest utilities; and testing and commissioning lead on equipment up to 765 kV — the very top of the North American grid.Utility. Generator. Regulator. Consultant. Few engineers have seen all four seats. Fewer still have sat in them.
His experience spans nuclear, hydro, conventional generation, renewables, oil and gas, mining — and today's data centers, where he is authoring a three-book series on data center design. He is a Licensed Professional Engineer in six states and a Licensed Electrical Contractor in Florida (Unlimited EC) — he doesn't just design the work; he's qualified to stand behind its execution.Today, as Founder and CEO of Keentel Engineering, Sonny leads a nationwide team of engineers delivering substation design, power system studies, NERC compliance, and commissioning — done right, coast to coast.Three decades. Every side of the table. One standard: accountable engineering.
Services

Let's Discuss Your Project
Let's book a call to discuss your electrical engineering project that we can help you with.
About the Author:
Sandip "Sonny" R. Patel, P.E.
IEEE Senior Member · Founder & CEO, Keentel Engineering
In 1995, Sonny Patel earned his Electrical Engineering degree from the University of Illinois. But degrees don't build legacies — action does.
For three decades, he has worked the power industry from every side of the table: 16 years as a utility engineer at Exelon/Commonwealth Edison; generation leadership across hydroelectric, industrial steam turbine, and a 9 GW renewable fleet; NERC Regional Entity Senior Compliance Engineer and Audit Team Lead, auditing some of the nation's largest utilities; and testing and commissioning lead on equipment up to 765 kV — the very top of the North American grid.
Utility. Generator. Regulator. Consultant. Few engineers have seen all four seats. Fewer still have sat in them.
His experience spans nuclear, hydro, conventional generation, renewables, oil and gas, mining — and today's data centers, where he is authoring a three-book series on data center design. He is a Licensed Professional Engineer in six states and a Licensed Electrical Contractor in Florida (Unlimited EC) — he doesn't just design the work; he's qualified to stand behind its execution.
Today, as Founder and CEO of Keentel Engineering, Sonny leads a nationwide team of engineers delivering substation design, power system studies, NERC compliance, and commissioning — done right, coast to coast.Three decades. Every side of the table. One standard: accountable engineering.
Leave a Comment
Thank you for contacting us.
We will get back to you as soon as possible.
We will get back to you as soon as possible.
Oops, there was an error sending your message.
Please try again later.
Please try again later.
Related Posts
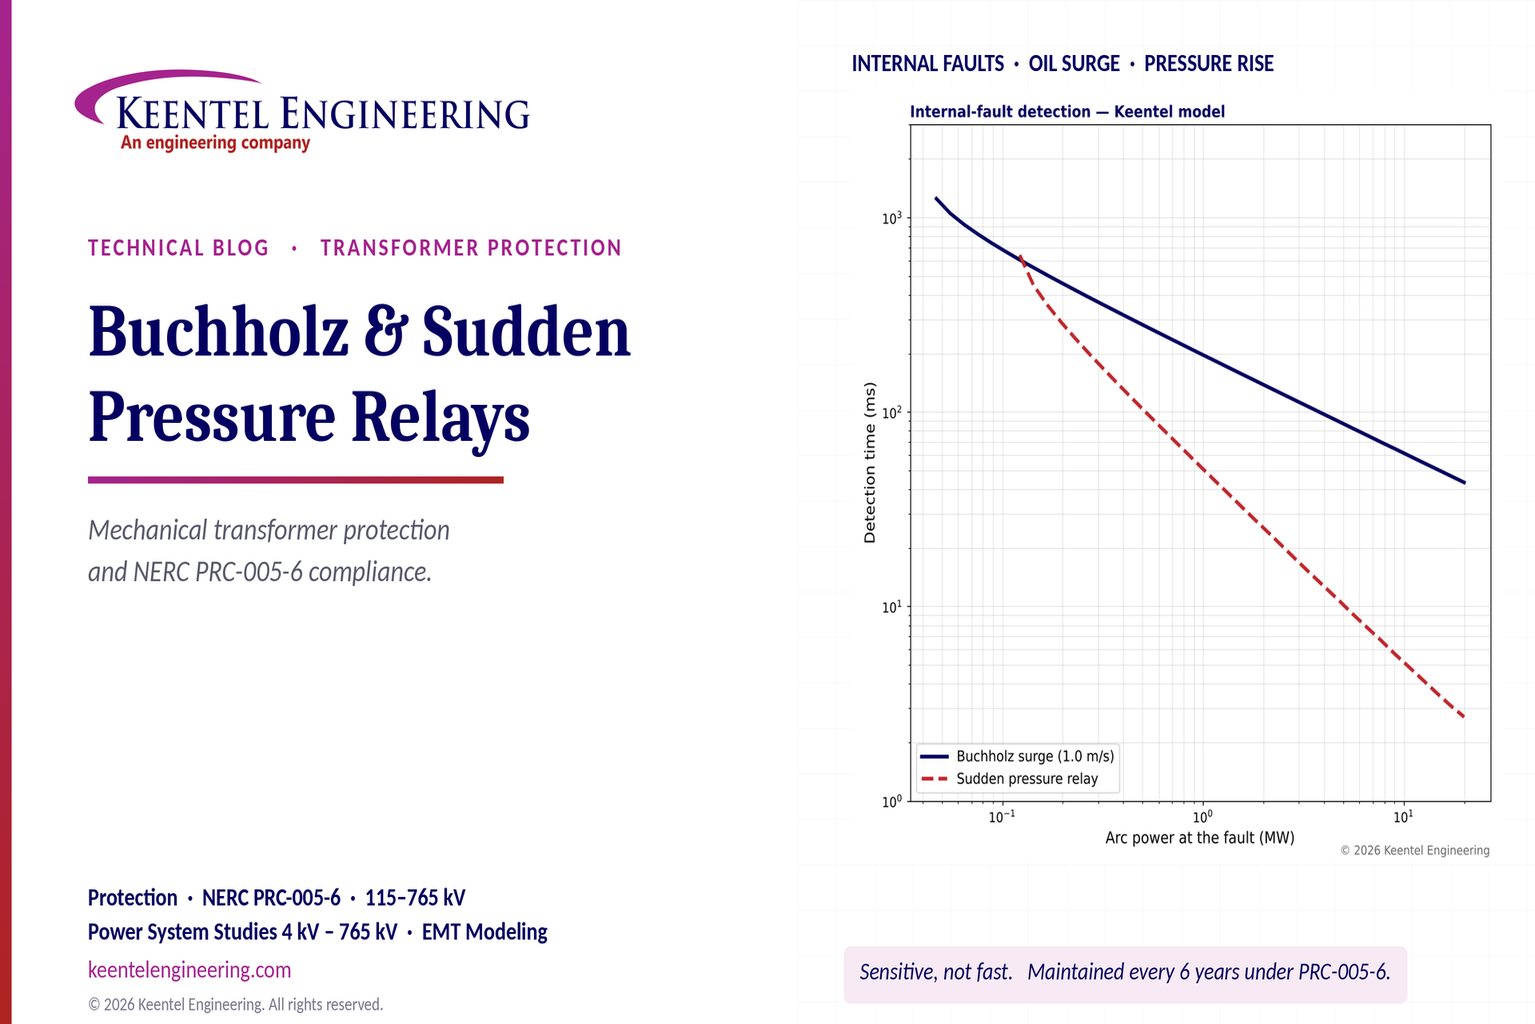
By SANDIP R PATEL
•
October 24, 2026
Learn how Buchholz and sudden pressure relays protect transformers, detect internal faults, and meet NERC PRC-005-6 maintenance requirements.
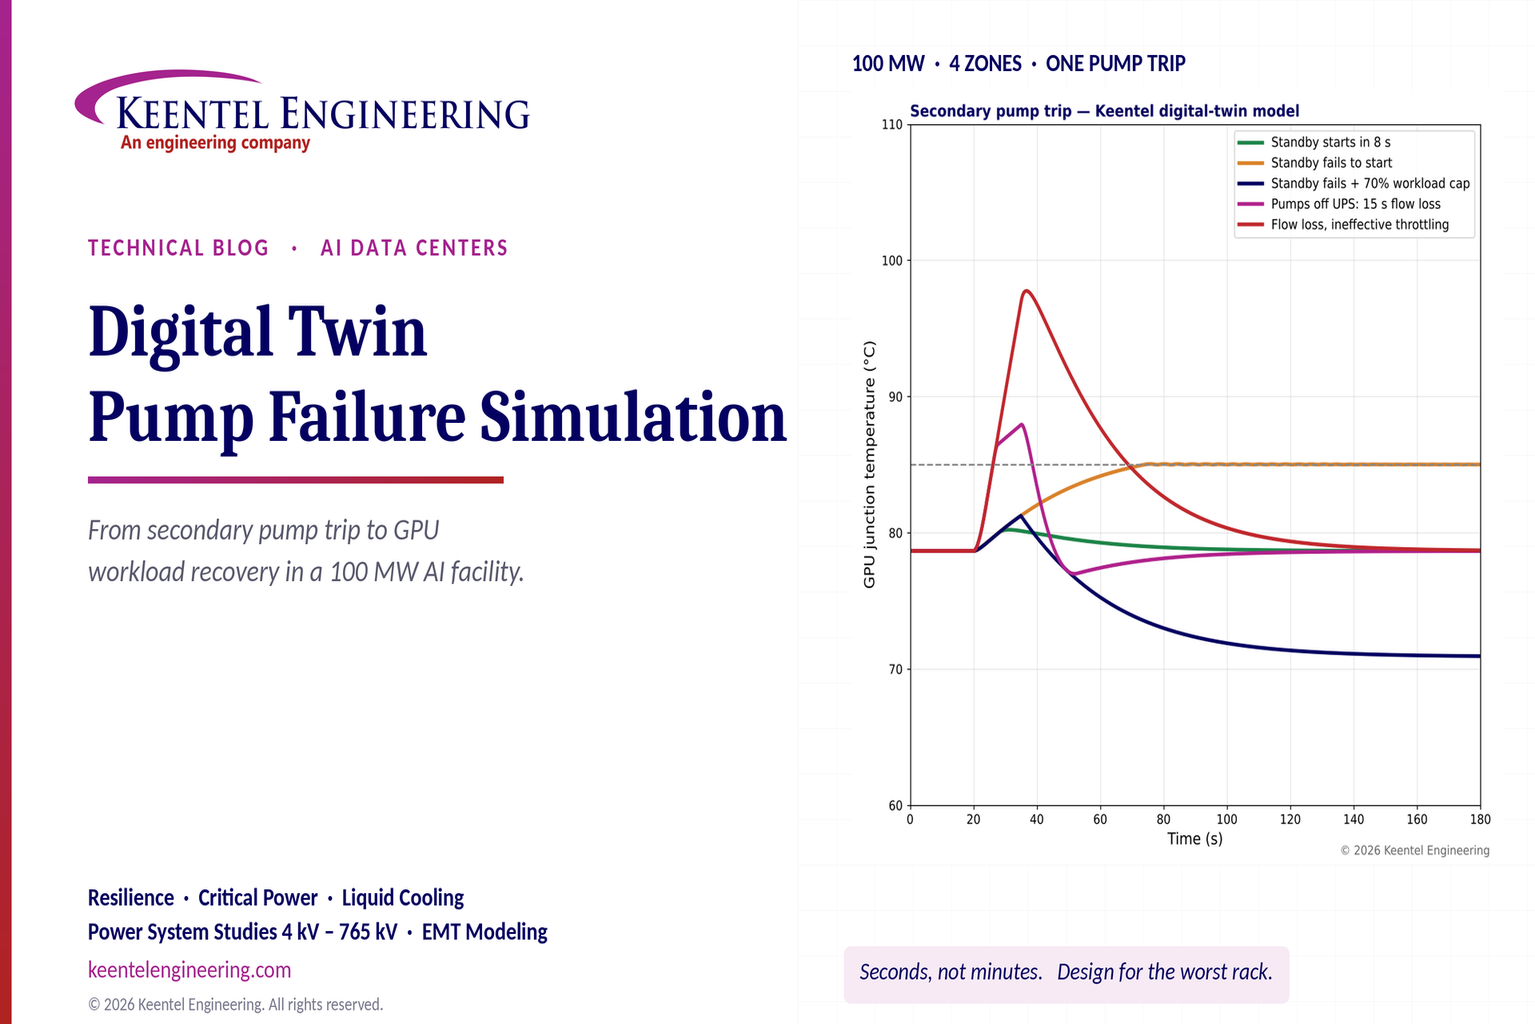
By SANDIP R PATEL
•
October 24, 2026
Explore digital twin pump failure simulation for liquid-cooled AI data centers, including GPU temperatures, standby pump failover, UPS and workload recovery.
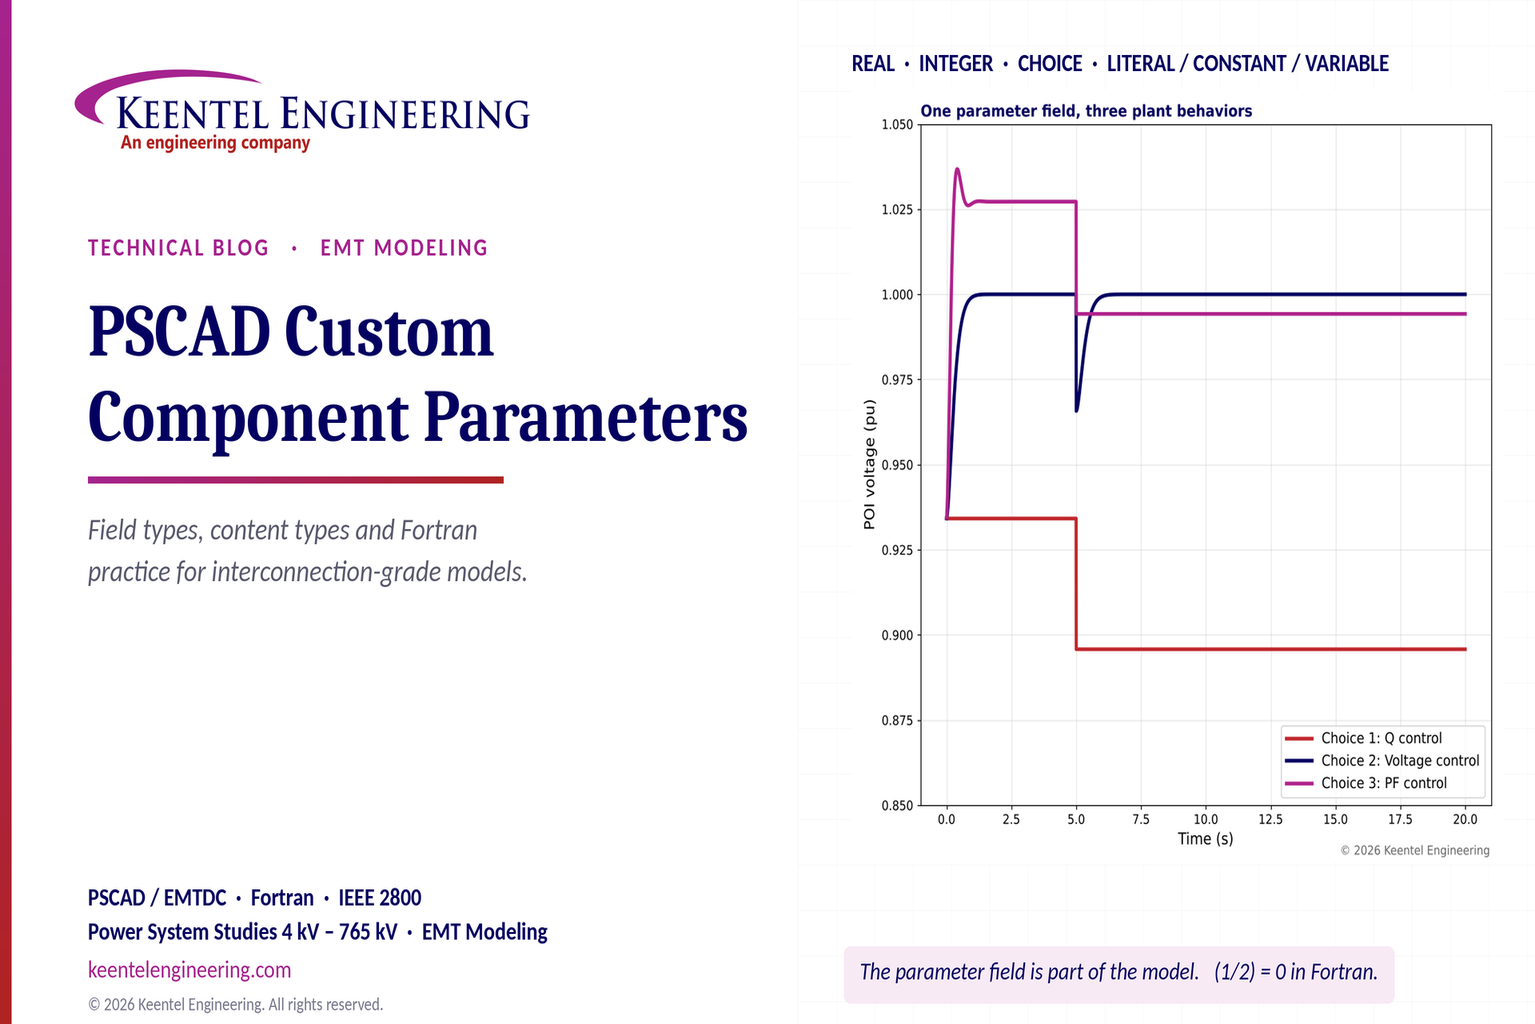
By SANDIP R PATEL
•
October 24, 2026
Learn PSCAD custom component parameters, field types, Literal, Constant and Variable settings, Fortran coding, and EMT model validation for grid studies.
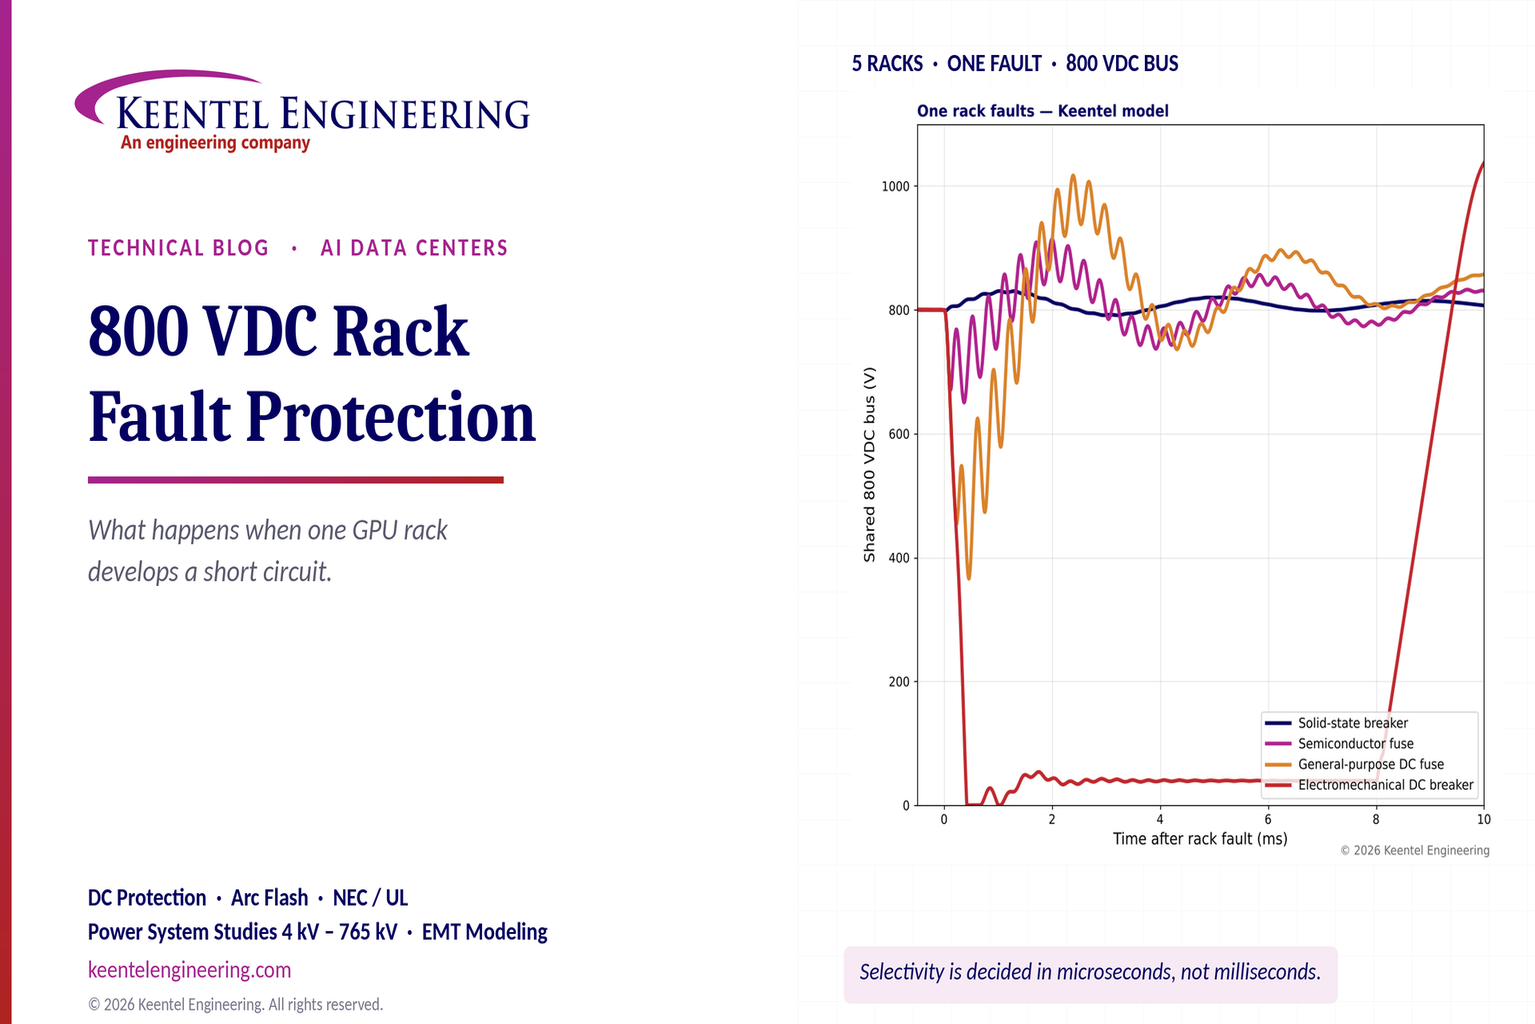
By Team 2 Dexora
•
October 24, 2026
Explore 800 VDC rack fault protection for AI data centers, including solid-state breakers, DC short circuits, selectivity, arc flash, and NEC/UL standards.
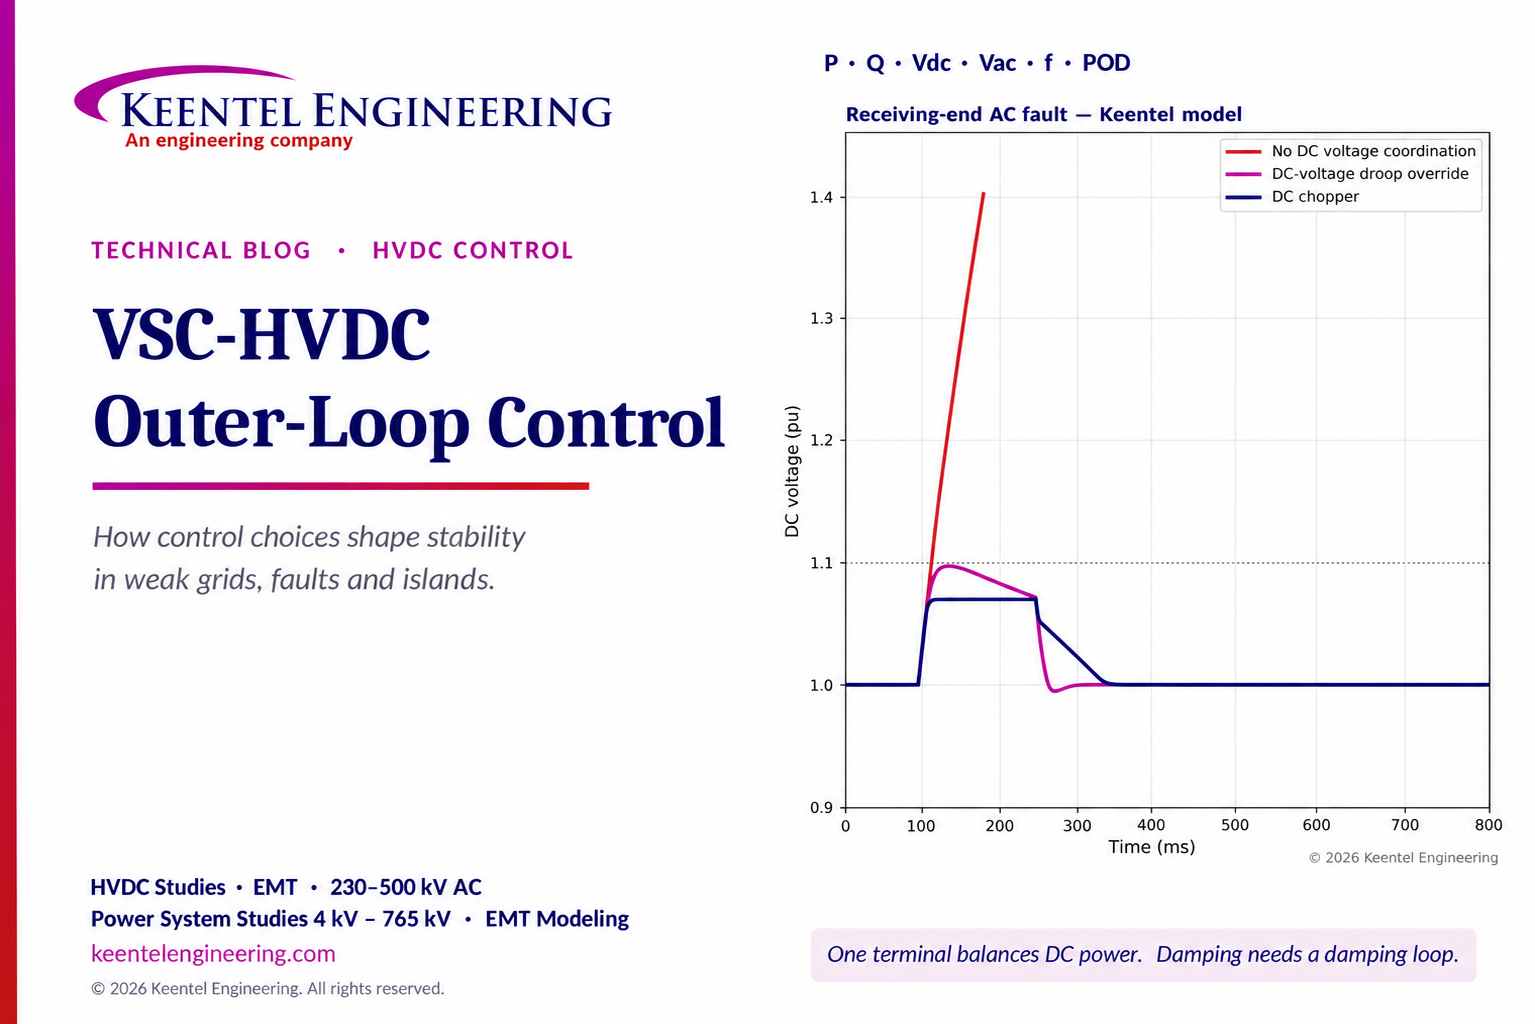
October 24, 2026
Explore VSC-HVDC outer-loop control for P, Q, DC voltage, weak-grid stability, fault ride-through and power oscillation damping with engineering models.
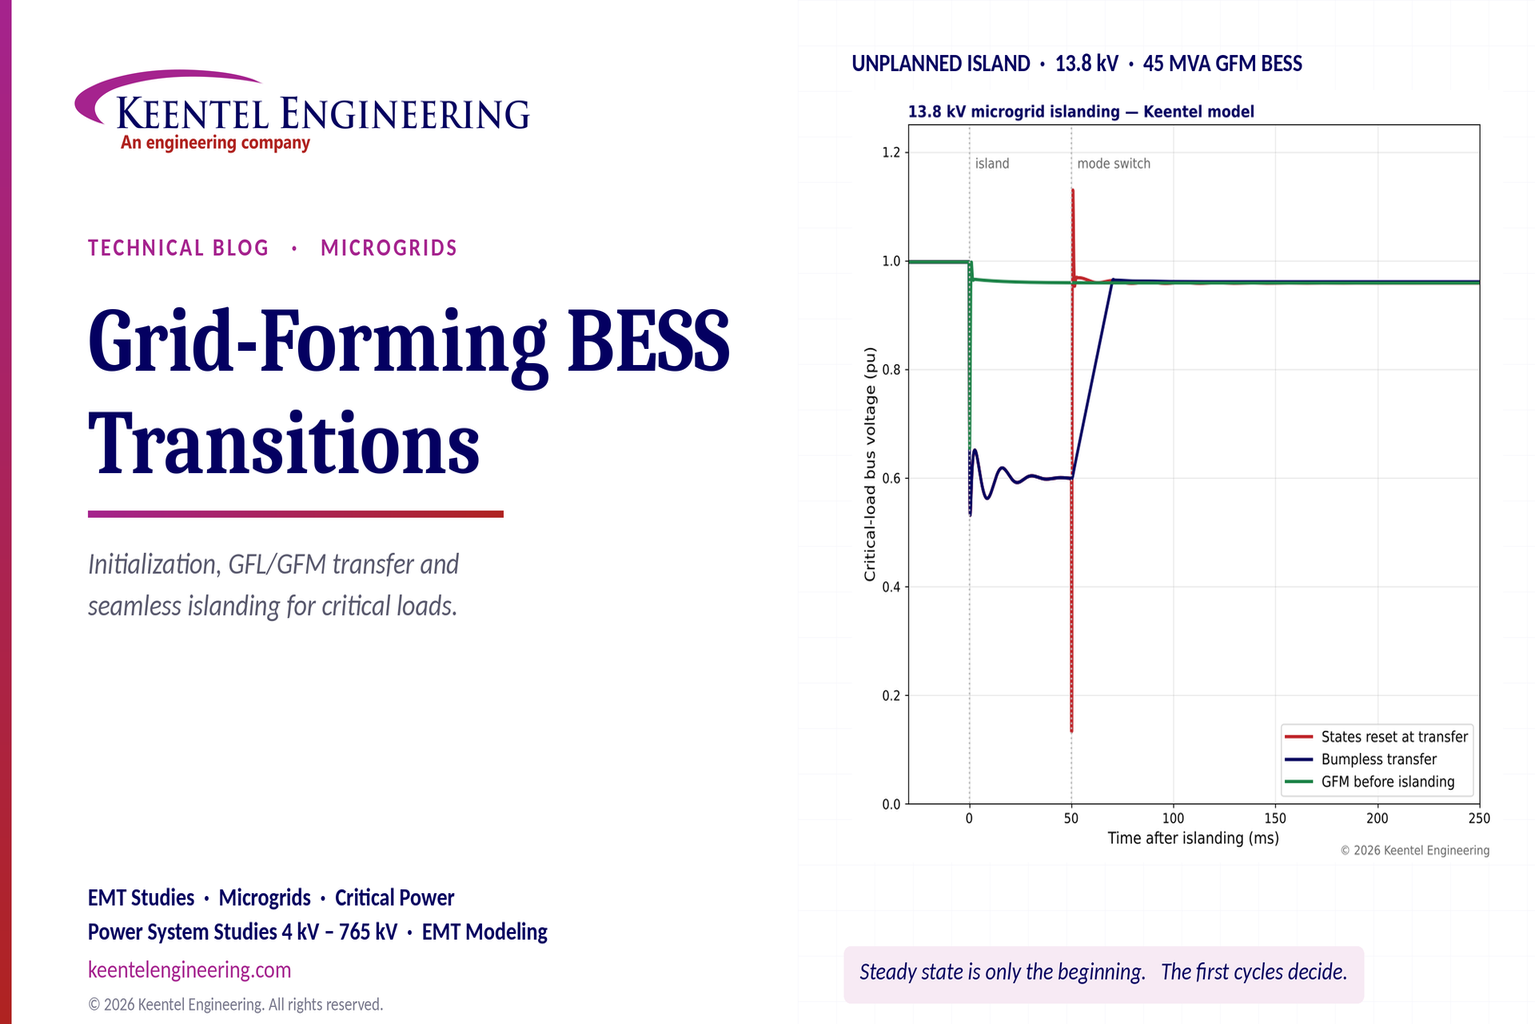
By SANDIP R PATEL
•
October 23, 2026
Explore grid-forming BESS initialization, GFL-to-GFM transitions, seamless islanding, EMT simulations, current limiting and microgrid protection.
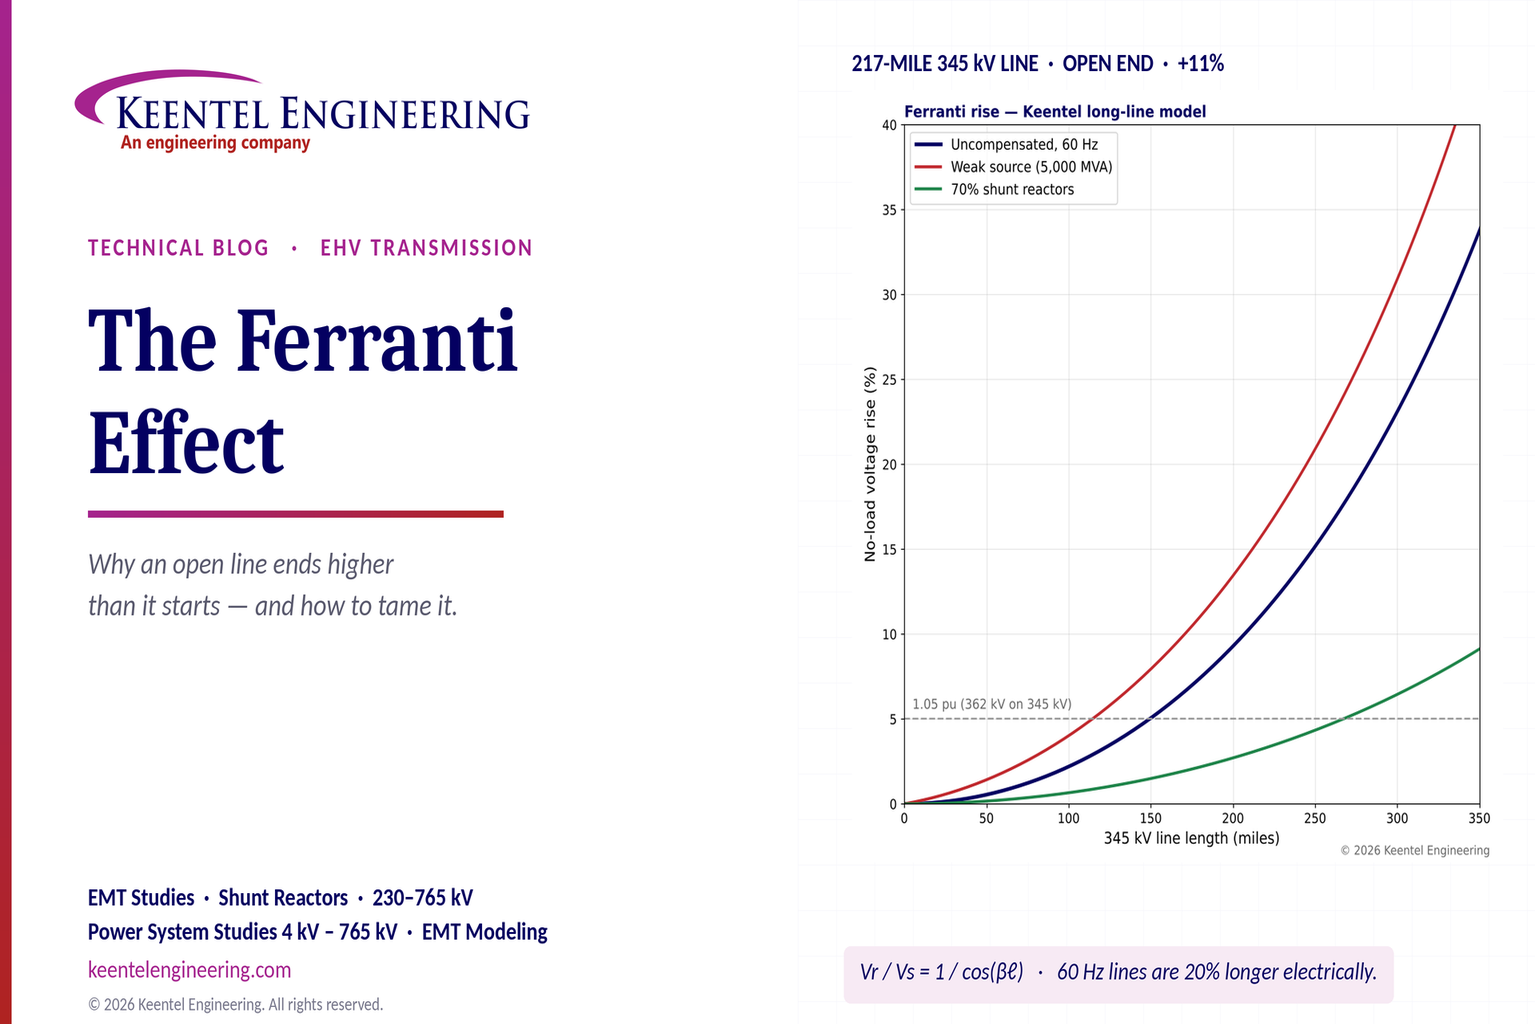
By SANDIP R PATEL
•
October 23, 2026
Explore the Ferranti effect in EHV transmission lines: voltage rise, 345 kV examples, switching overvoltages, shunt reactor sizing and mitigation.
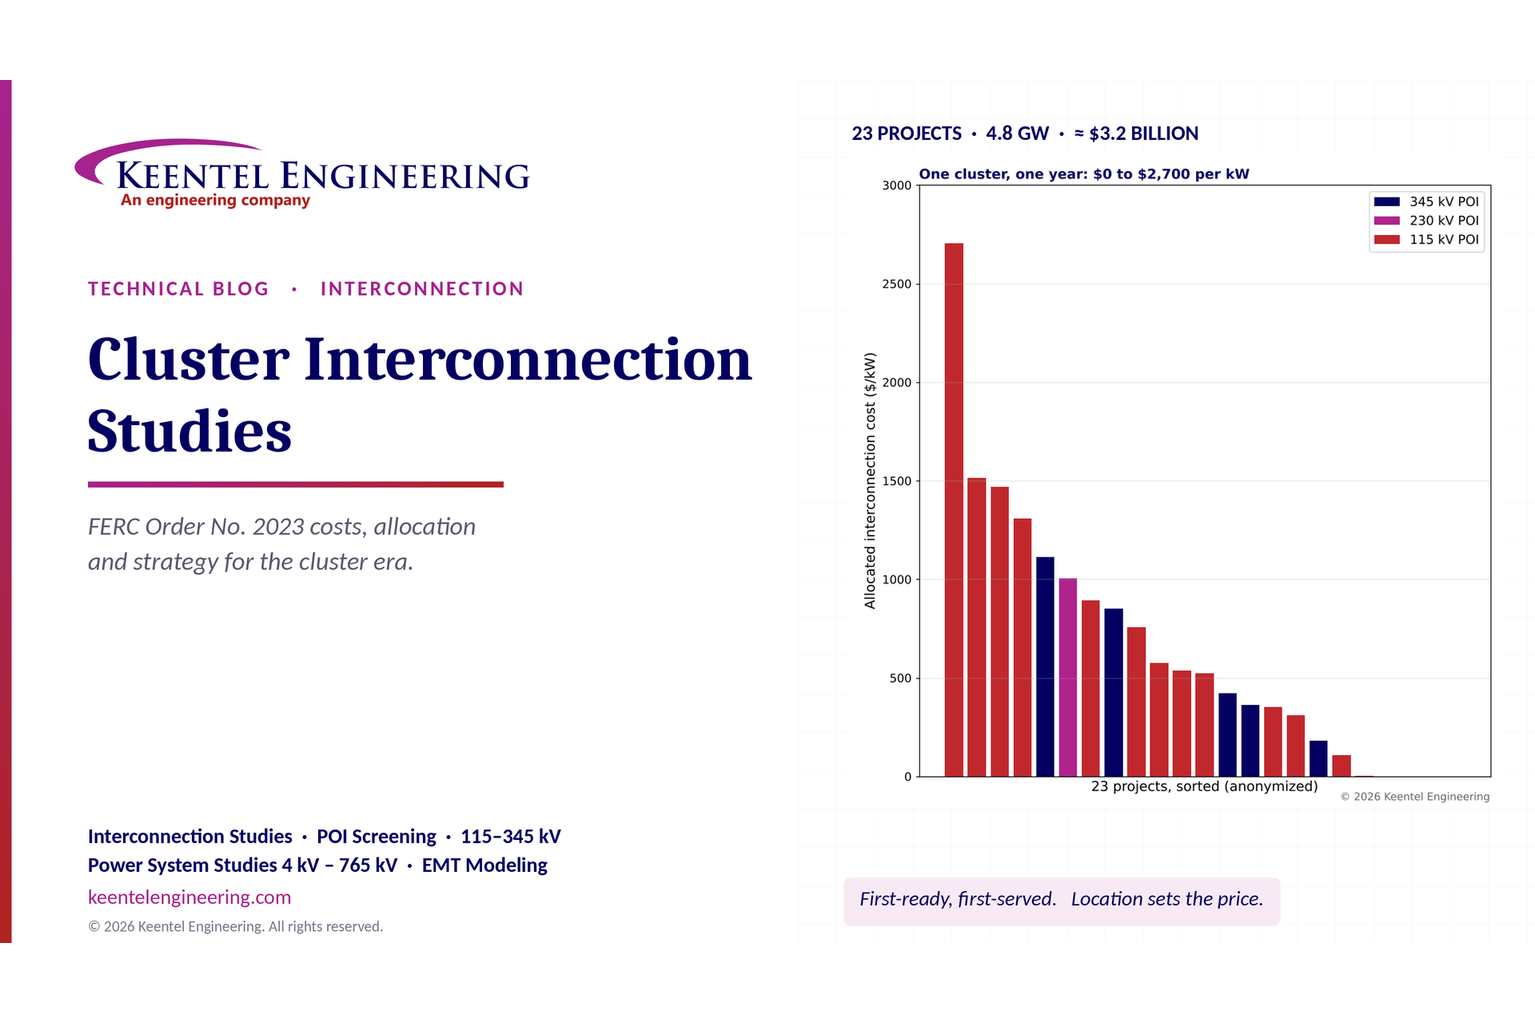
By SANDIP R PATEL
•
October 23, 2026
Explore cluster interconnection studies under FERC Order 2023, including network upgrades, cost allocation, withdrawal penalties and developer strategy.
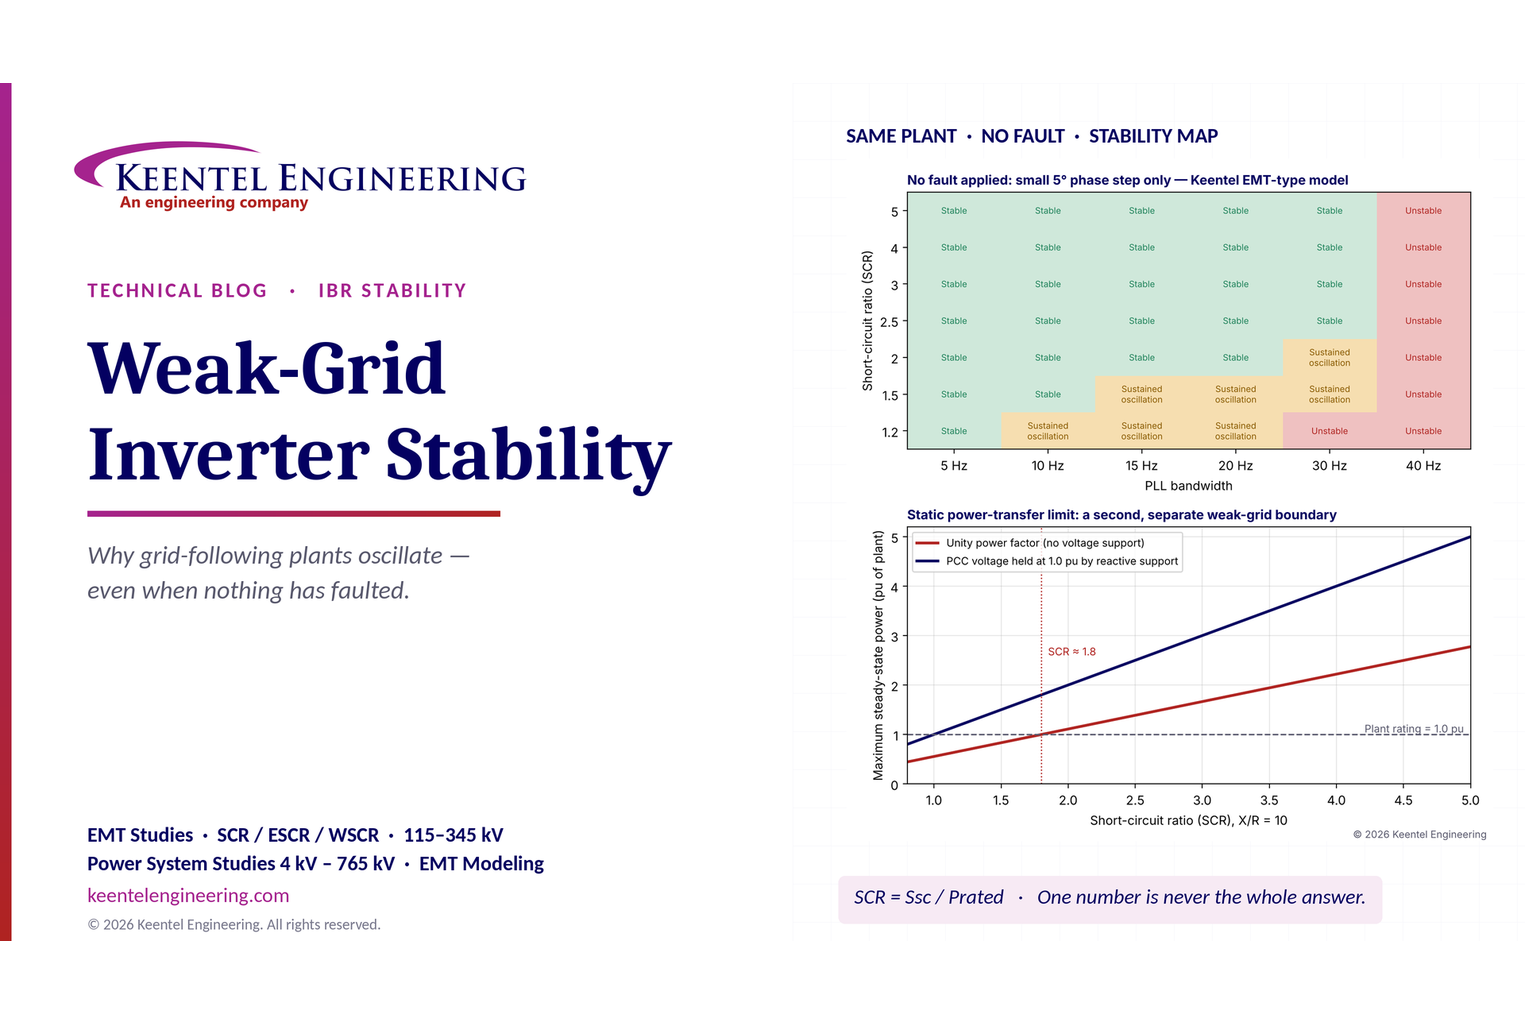
By SANDIP R PATEL
•
October 21, 2026
Learn why grid-following inverters become unstable without grid faults. Explore SCR, PLL interactions, EMT studies, grid strength, and mitigation.