
A Coordinated Electric System Interconnection Review—the utility’s deep-dive on technical and cost impacts of your project.
Challenge: Frequent false tripping using conventional electromechanical relays
Solution: SEL-487E integration with multi-terminal differential protection and dynamic inrush restraint
Result: 90% reduction in false trips, saving over $250,000 in downtime
The three operating regions you have to design to
| Device | Output vs voltage | Response | Best suited to | Main limitations |
|---|---|---|---|---|
| Mechanically switched capacitor or reactor | Proportional to voltage squared | Seconds; discrete steps; limited switching operations per day | Steady-state reactive supply, voltage profile, loss reduction | No dynamic capability; step voltage change on switching; capability collapses when most needed |
| Static var compensator | Capacitive branches proportional to voltage squared | A few cycles; continuously controllable | Continuous control where cost matters and deep voltage support is not the driver | Square-law capability loss; harmonic filters are part of the plant and interact with the network |
| STATCOM | Approximately proportional to voltage — constant current capability | One to two cycles closed loop; converter response faster still | Voltage stability margin, weak interconnections, fast disturbance recovery, flicker and unbalance compensation | Higher capital cost; converter losses; adds a converter and its control dynamics to the network |
| Synchronous condenser | Governed by machine capability and excitation | Excitation response in the hundreds of milliseconds; inherent inertial response instantaneous | System strength and inertia, short-circuit contribution, black start support | Rotating plant with maintenance and losses; slower controlled response than a converter |
| STATCOM with energy storage | Reactive as a STATCOM, plus real power within the storage rating | As STATCOM for reactive; real power limited by storage | Where a real power deficiency is part of the problem | Cost and complexity of the storage; different failure and maintenance profile |
Interconnecting a Large Load in MISO: What the RTO Needs, What the Transmission Owner Needs, and How to Get Your Data Center Through the Process
September 19, 2026 | Blog
Keentel Engineering — Power System Studies | Grid Interconnection | NERC Compliance
Data centers, hydrogen electrolyzers, crypto-mining facilities and industrial electrification projects are arriving on the Midcontinent Independent System Operator (MISO) footprint at a scale the grid has never seen. A single AI-training campus can ask for 200 MW to more than 1 GW at one point of interconnection. Loads of that size behave nothing like the aggregated residential and commercial demand that transmission planners have modeled for fifty years, and the interconnection process has changed to match.
This article explains, in practical engineering terms, what MISO needs, what the local transmission owner needs, and what a load developer has to deliver to get an application accepted and studied. It is written for developers, owner’s engineers and EPC teams who are seeing these requirements for the first time, and for utilities who want to understand what a complete submittal looks like from the applicant’s side. Keentel Engineering prepares these packages for large-load customers; the process described here is the one we work through on every project.
1. Who Is Who: MISO, the Transmission Owner, and the Requestor
A large load in MISO is not interconnected to MISO. It is interconnected to the transmission system of a Transmission Owner (TO) — the local utility that owns the substations and lines — and MISO, as the Transmission Provider and Planning Coordinator, coordinates the regional impact of that connection.
That distinction shapes everything that follows:
- The Transmission Owner publishes its Facility Connection Requirements under NERC Reliability Standard FAC-001, performs (or contracts) the system impact studies under FAC-002, defines the physical connection (the “plan of interconnection”), and sets the performance requirements the load must meet in operation.
- MISO reviews the TO’s studies for regional impact, coordinates with affected neighboring systems, and folds the resulting transmission solution into the MISO Transmission Expansion Plan (MTEP). For loads on an accelerated timeline, MISO offers an Expedited Project Review (EPR) path so the transmission solution can be approved outside the annual MTEP cycle.
- The Requestor (the load developer or its engineer) supplies the site, load and equipment information both parties need, and is responsible for the accuracy of the models that represent the facility.
Unlike generation, there is no MISO-administered load interconnection queue. The process runs through the TO, and its speed depends almost entirely on the quality and completeness of what the Requestor submits.
2. What MISO Needs
.MISO’s role is regional reliability and resource adequacy. Its needs are less about your facility’s internal design and more about three questions: Is the transmission solution the TO proposes consistent with the regional plan? Will the resources exist to serve this load when it arrives? Is this project real?
2.1 A transmission solution it can approve
When a TO’s impact study concludes that new or upgraded transmission is needed to serve the load — a new substation, transformer additions, line reconductoring, a new loop — that project has to be approved through MISO’s planning process before the TO can build it. In the normal course this happens through the annual MTEP cycle. For loads that cannot wait, MISO’s Expedited Project Review allows a TO to submit the project for out-of-cycle approval. MISO opens EPR windows periodically; a TO that misses a window waits for the next one. The practical consequence is that the applicant’s modeling package has to be in the TO’s hands early enough for the TO to study it, size the solution and prepare the submittal before the window closes — typically a week or more ahead of the deadline.
2.2 Modeling data that fits the MTEP cases
MISO’s studies, and the TO’s studies on MISO’s behalf, run in PSS®E on the MTEP base cases — a defined set of power-flow and dynamics models for future years and seasons (summer peak, winter peak, shoulder, light load). The load’s steady-state records and dynamic model files must be built against the same PSS®E version the TO is using, with bus numbering and area/zone assignments that drop straight into those cases. A model built in the wrong version, or with parameters that fail to initialize, costs the applicant a study cycle.
2.3 A ramp schedule for resource adequacy
MISO has to know when the load will actually arrive — not just the ultimate MW, but the build-out schedule by phase and the requested in-service dates. This feeds MISO’s resource adequacy process: a 200 MW load arriving in 2028 is a different planning problem from the same load arriving in 2031, and MISO will expect the TO to present a defensible schedule.
2.4 Evidence that the project is real
Because dropouts and re-studies disrupt the regional plan, MISO and the TOs increasingly require evidence of commercial commitment before a project is submitted into the expedited path: site control, a demonstrated ability to proceed on the stated timeline, defined and validated study assumptions, and settled cost-responsibility and study-funding arrangements. This is the applicant’s business-side homework, and it has to be done in parallel with the engineering.
3. What the Transmission Owner Needs
The TO is the party that actually engineers the connection and lives with the load’s behavior on its system. Its requirements are more detailed and more technical. Most TOs in MISO publish them in a facility connection requirements document; the structure below reflects what those documents commonly require of a large load.
3.1 The initial information package
Before the TO’s planning group will begin the interconnection evaluation, the Requestor has to provide a defined set of information. The list typically includes:
- Requestor and design-engineer contact information.
- Requested in-service date, and a date for temporary service to test the facility.
- A plot plan or description locating the facility and the proposed point of delivery, with confirmation that the point of interconnection sits within the TO’s balancing authority area.
- One-line and schematic diagrams of the proposed facility, and plan/elevation drawings showing clearances and grounding as they become available.
- Load characteristics: initial build-up, five- and ten-year projections, and power factor.
- Power-factor correction equipment: fixed or switched capacitors, STATCOM, and the control method.
- Preliminary equipment data: high-side interrupting and sectionalizing devices, high-side relaying, power transformer nameplate and impedance data (positive- and zero-sequence, at each tap), low-side grounding, and low-voltage protection settings.
- Additional data for power-quality evaluation: harmonic and sub-harmonic current and voltage spectra of the end-user equipment under balanced and unbalanced conditions; maximum sudden load swings (MW and MVAR) and how often they occur; SVC/STATCOM/filter data; and maximum expected MW and MVAR demand at the point of connection.
Many TOs also require a completed Large Load Interconnection Data Request Form — a structured questionnaire that captures the same information in the TO’s format.
3.2 A complete dynamics model
This is the requirement that distinguishes a large-load application from a conventional retail service request. Because the TO must perform stability analysis for large loads, it needs a dynamic model of the facility — normally in PSS®E composite load format — before the evaluation can start. Section 4 of this article covers what that model contains.
3.3 A harmonic current spectrum at the point of interconnection
The TO needs an estimate of the individual harmonic current injections the facility will produce at the POI, typically up to the 50th harmonic order, so it can check the result against IEEE 519 and its own harmonic distortion criteria at the point of compliance. For a data center this means aggregating the emissions of the UPS or BESS converters, server power supplies and variable-frequency drives through the facility’s transformers to the POI. Section 6 covers the method.
3.4 Performance requirements the load must meet in operation
The TO’s requirements for large loads have moved well beyond “provide a one-line and a power factor.” Drawing on NERC’s large-load guidance, TOs now commonly specify:
- Ramp-rate and oscillation limits. A maximum active-power ramp rate averaged over one-minute and ten-minute windows (20 MW/min is a value we see), plus limits on intra-minute variability — for example, the typical change over any four-to-six-second interval limited to the greater of 1 MW or 1 percent of maximum load, with recurring variability held within a defined band (10 MW is common). These limits protect the balancing authority’s area control error and its reserve requirements.
- Voltage ride-through. TOs are adopting NERC PRC-029 as the basis for load ride-through, defining a voltage tolerance envelope in which the load may not disconnect. In the envelope’s inner zone the load must operate continuously; in intermediate zones it may reduce consumption proportionally to the voltage depression but must ride through and return to at least 90 percent of pre-disturbance consumption within one second once voltage recovers above 0.9 per unit; only in the outer zone may it trip or transfer to backup power.
- Frequency ride-through. Likewise on a PRC-029 basis: continuous operation across a band around 60 Hz (commonly 58.8 to 61.2 Hz), with defined ride-through durations outside it.
- Load block limits. Total demand segmented into discrete, separately controllable blocks of no more than a set size (150 MW is a value in use), so that a single trip or restoration step cannot create an abrupt supply-demand imbalance.
- Facility monitoring. A PMU or equivalent high-resolution recorder on the low side of the supply transformers, synchronized to satellite time, with data retention and delivery obligations; possibly dynamic disturbance recorders and power-quality meters as well.
- Emergency load reduction and UFLS participation. The capability to reduce load on TO direction during emergencies, and participation in the TO’s under-frequency load shedding plan where the TO’s PRC-006 obligations require it.
- Power factor. Typically 0.98 lagging to 0.98 leading at the delivery point, with the TO able to evaluate it on a shorter time scale than the usual 15-minute average for large loads.
- Power quality. Harmonics per IEEE 519 and the TO’s own criteria; voltage flicker limits; voltage and current unbalance limits; and case-by-case screening for sub-synchronous torsional interaction where the load’s converters sit electrically close to existing turbine-generators.
3.5 As-built and as-left data
The TO’s requirements do not end at the application. After construction the Requestor submits as-built facility information; the TO runs a performance-validation period; and after commissioning the Requestor submits as-left information reflecting the final configuration and settings. Any material later change — load additions, transformer or grounding changes, firmware, protection settings — has to be reported and may trigger re-study.
4. The Dynamics Model: CMLD, Load Protection, and the In-Line BESS
4.1 Why a composite load model
Classical planning practice represented load as constant impedance, constant current or constant power. That is adequate for aggregated distribution load but says nothing about how a 200 MW block of power-electronic load behaves when a nearby fault depresses voltage to 0.6 per unit for eight cycles. Does it ride through? Does the UPS transfer to battery and drop the grid entirely? Does it trip and, if so, does it come back — and how fast? Each answer produces a different post-fault system response, and the TO’s stability study has to know which one applies.
The PSS®E composite load model (CMLD) was developed to answer these questions for aggregated load. It represents load as a mix of components behind a distribution equivalent:
- Motor A, B, C, D — three-phase induction motor types and a single-phase air-conditioner compressor model, each with its own electrical and mechanical parameters and protection.
- Electronic load — power-electronic load with defined voltage thresholds below which it disconnects and above which it reconnects, and a recovery characteristic.
- Static load — the residual represented with voltage- and frequency-dependent polynomial terms.
- Distribution equivalent — the substation transformer, LTC, feeder impedance and compensation between the transmission bus and the load bus.
For a data center the composition is dominated by the electronic fraction (IT load and VFD-driven cooling), with a motor fraction for direct-on-line cooling equipment and a small static remainder. Getting the fractions right, and documenting where each came from, is the heart of the modeling task.
4.2 Load protection and ride-through models
The composite load model captures the load’s voltage sensitivity. TOs increasingly also ask for a companion load protection / ride-through model — the PERC family in PSS®E is one example — that represents the facility’s protective settings explicitly: under- and over-voltage and under- and over-frequency trip thresholds and delays, reconnection logic, and load recovery after a disturbance. The value of this model is that it lets the TO test the facility’s protection against its ride-through envelope directly. If the facility’s UPS is set to transfer to battery at 0.85 per unit with a 100 ms delay, the model will show the load disappearing from the grid inside the envelope where the TO requires it to stay — and that conversation is far better to have during the study than during commissioning.
4.3 Representing the in-line MV UPS or BESS
A modern AI data center often places a medium-voltage UPS or battery energy storage system in line between the utility supply and the IT load. From the TO’s point of view this device determines the facility’s ride-through behavior, its recovery profile, and — critically — whether the wild swings of an AI training workload are visible at the POI or absorbed on site.
There is not yet a settled industry convention for representing this device. The two options are to embed its effect in the composite load’s electronic-load ride-through and recovery parameters, or to model it as a separate dynamic device with its own control representation. The right answer depends on the BESS control design and on what the TO’s planners are prepared to review, and it should be agreed with the TO at the kick-off meeting rather than discovered in a deficiency notice.
4.4 Model verification before submittal
A model that arrives at the TO and fails to initialize costs the applicant weeks. Every model package we prepare goes through a verification harness before it leaves: flat-start initialization in the target PSS®E version; a no-disturbance run to confirm stability; balanced and unbalanced faults at the POI; voltage steps to the boundaries of the ride-through envelope; and frequency excursions to the band limits. The results — plots of P, Q, V and f at the POI, with a pass/fail statement against each requirement — go into the model report.
5. Ramp Rates and Swings: The Requirement That Surprises AI Data Centers
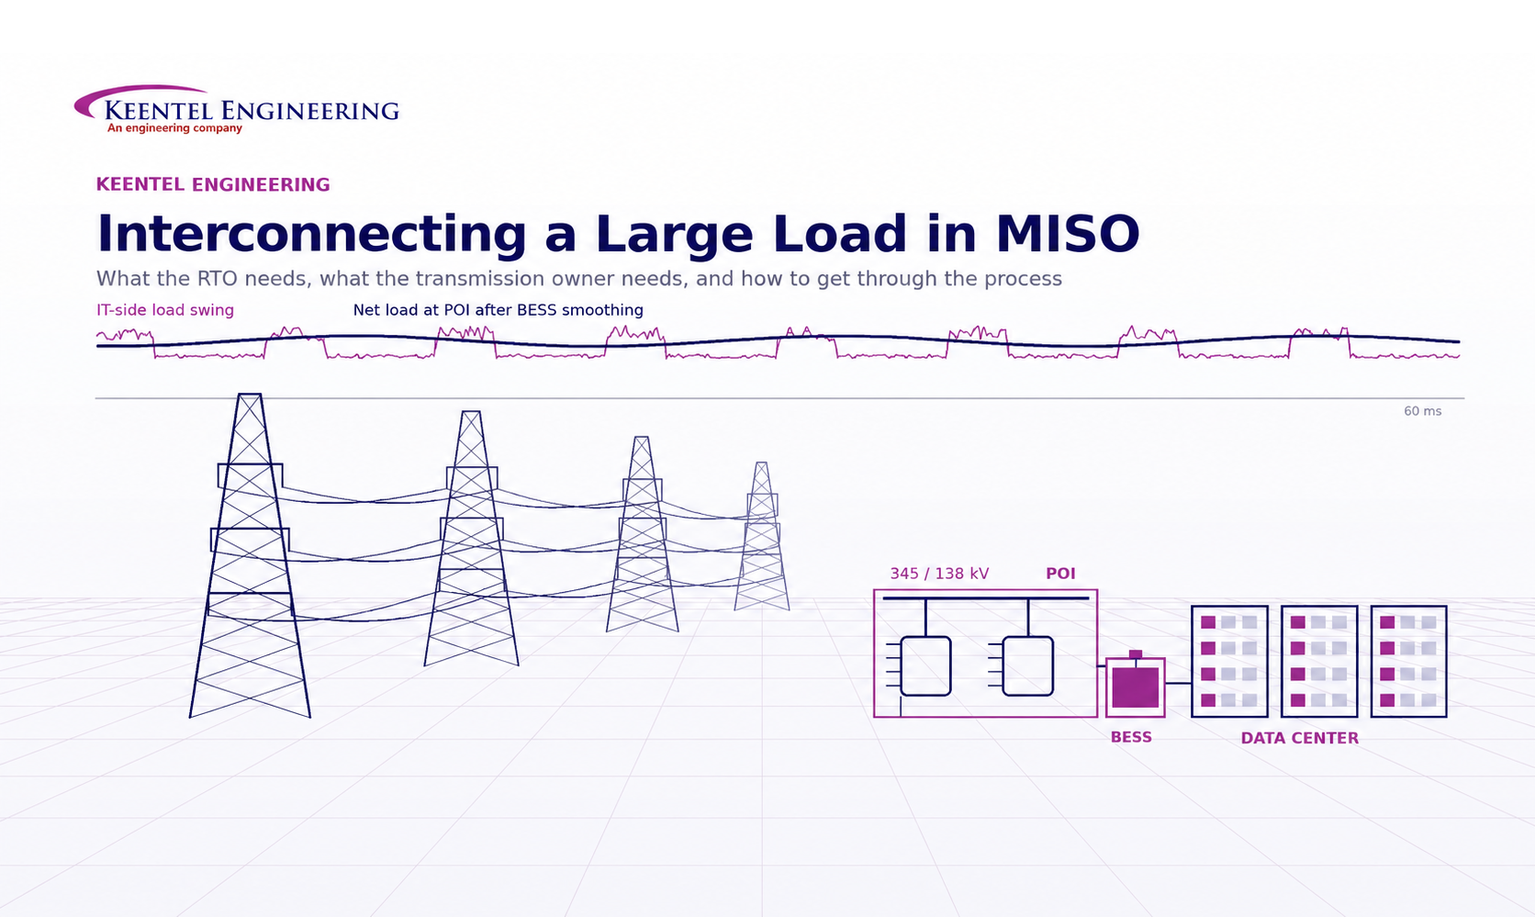
Conventional data centers present a nearly flat load. AI training clusters do not. Synchronized GPU workloads can swing tens of percent of site load in tens of milliseconds as jobs start, checkpoint and stop. Developers now routinely quote figures such as a 99th-percentile swing of 30 to 40 percent of site peak within 60 milliseconds, and trough-to-peak excursions of half the site load.
Set those numbers against a TO’s ramp-rate requirement and the conflict is immediate. A 200 MW site with a 38 percent swing is moving 76 MW in less time than a protective relay takes to operate; a 4-to-6-second limit of 2 MW and a 10 MW variability band are two orders of magnitude tighter. The facility as described at the IT bus cannot comply at the POI.
The resolution is the in-line BESS, or an equivalent grid-interface control, doing the smoothing — which turns the BESS from a backup device into a compliance device. That has three consequences for the application:
- The load data sheet has to present both the raw IT-side swing characteristics and the expected net behavior at the POI after smoothing, with the smoothing headroom and response time stated.
- The dynamic model has to reflect the smoothing control, not just the ride-through settings.
- The BESS sizing and control specification become interconnection deliverables, not just facility-design decisions — and they need the OEM’s participation early.
Applicants who present only the raw swing numbers will be asked to explain how they meet the ramp-rate requirement; applicants who present only the smoothed numbers will be asked what produces them. The application has to show the chain.
6. The Harmonic Spectrum
The TO’s power-quality evaluation needs the facility’s harmonic current injection at the point of compliance, harmonic by harmonic, to the 50th order. A single “THD = 2.1 percent” figure — however true at the facility level — does not satisfy this.
The method is straightforward but data-hungry. Emission spectra are collected from the OEM data for each non-linear source: UPS or BESS converters, server power supplies, VFDs, LED lighting. Each source’s injection is referred through its transformer connections, with phase-shift cancellation and diversity applied where multiple sources are fed through different winding groups, and aggregated to the POI under balanced conditions with a qualitative treatment of unbalance. The resulting spectrum, in amperes and in percent of fundamental, is compared with the individual and total demand distortion limits of IEEE 519 for the POI voltage class and with the TO’s own criteria (for transmission-voltage POIs, individual voltage distortion of 1.5 percent and total of 2.5 percent are typical limits).
Where OEM data is not yet available, representative values can be used — but they must be identified as such, and the applicant should expect to replace them with as-designed data before energization.
7. The Single-Line Diagram
Every other deliverable depends on the single-line diagram. The TO needs it to define the plan of interconnection; the composite load model’s distribution equivalent is derived from it; the harmonic aggregation follows its transformer connections; and the load-block requirement is demonstrated on it.
For an interconnection application the SLD is conceptual — not for construction — but it must show: the POI configuration at the transmission voltage consistent with the TO’s standard connection arrangements (looped supply with two line positions is the norm; tapped connections are generally discouraged); ownership demarcation and the revenue-metering location; main HV/MV transformers with preliminary MVA, ratio, winding connection, impedance and grounding; the MV switchgear and feeder architecture with the load segmented into controllable blocks within the TO’s limit; the in-line UPS or BESS blocks with ratings, interface transformers and bypass arrangement; representative LV distribution to the data halls; power-factor correction if required; and the PMU location on the transformer low side. A notes column identifying assumptions and items to be finalized in detailed design is expected and welcome.
8. The Schedule Reality
The applicant’s timeline is driven by the TO’s timeline, which is driven by MISO’s windows. Working backwards from an EPR window:
- The TO needs roughly a week to run the applicant’s load through its models, size the connection and any upgrades, and prepare the submittal.
- Before that, the applicant needs the TO’s confirmation of the POI, the PSS®E version and base case, the required model set, and short-circuit data at the POI — all of which come from a kick-off meeting and a written data request.
- Before that, the applicant needs its own load composition, ramp schedule, BESS and transformer data from its design team and OEMs.
On a compressed schedule, the practical sequence is: kick-off meeting with the TO in the first week; written RFI responses from the TO and load data from the developer in the same week; SLD drafted and approved by the end of that week; dynamic models, load data sheet and modeling-basis memo completed in the following four to five days; package to the TO with at least a week of review margin before the window. That is achievable only if the developer’s inputs arrive on time and the TO’s questions are answered the same day. Applicants should also recognize that the EPR package can be a reduced set — SLD, load data sheet, CMLD and load-protection models, and a modeling-basis memo — with the full facility connection package (all Section 2.2-type information, the Data Request Form, the harmonic spectrum, detailed drawings) following for the TO’s own evaluation.
9. Frequently Asked Questions
Q1. Does MISO have a large-load interconnection queue like the generator interconnection queue?
No. Loads interconnect to the Transmission Owner under the TO’s FAC-001 facility connection requirements. MISO’s involvement is through its regional planning process — MTEP and, for accelerated projects, the Expedited Project Review — where the TO’s proposed transmission solution is reviewed and approved. There is no MISO application form for a load; the TO is the applicant’s counterparty.
Q2. What is the MISO Expedited Project Review, and why does it matter to my schedule?
EPR is MISO’s out-of-cycle path for approving transmission projects that cannot wait for the annual MTEP cycle — large-load connections are a common reason. MISO opens EPR windows periodically; missing one means waiting for the next. Because the TO must complete its study and prepare the submittal before the window closes, the applicant’s modeling package has to reach the TO a week or more ahead of the deadline. The EPR also carries commitment prerequisites — site control, schedule certainty, settled study funding — that the developer must satisfy.
Q3. What models do I actually have to provide?
At minimum: steady-state PSS®E load records (P and Q at the POI for each build-out stage) and a PSS®E composite load model (CMLD) with fully documented parameters. Most TOs now also require a load protection / ride-through model — the PERC family in PSS®E is one implementation — that represents the facility’s trip settings and recovery. Some TOs also request EMT (PSCAD) load models for sub-synchronous and control-interaction screening; treat that as a likely follow-on request even if it is not required for the initial application.
Q4. Which PSS®E version and which base case?
Ask the TO at kick-off and build against exactly that. MISO’s MTEP cases are versioned by cycle year (e.g., “MTEP26”) and season; the TO will tell you which PSS®E release it runs and what bus-numbering convention to use. Models built in the wrong version, or that fail to initialize in the TO’s case, are the most common cause of a first-round deficiency.
Q5. Do I need separate models for each season?
Usually one dynamic model file is enough — a data center’s load composition does not normally change with season. If your cooling load does vary materially (large seasonal motor load, for example), the TO will want cases for its standard seasons: summer peak, winter peak, shoulder and spring light load. Confirm with the TO rather than assuming.
Q6. My AI cluster swings 40 percent of load in 60 milliseconds. How can I possibly meet a 20 MW/min ramp limit?
You cannot meet it at the IT bus; you meet it at the POI, which is where the TO measures. That means an in-line BESS or grid-interface control that absorbs the swings on site. Your application has to show the raw IT-side characteristics, the smoothing device’s capability (headroom and response time), and the resulting net behavior at the POI against each of the TO’s limits — and the dynamic model has to reflect the smoothing control. Engage the BESS OEM early; their control data is on the critical path.
Q7. Should the BESS be modeled inside the composite load model or as a separate device?
There is no settled convention yet. If the BESS operates purely as an in-line UPS with no export and its main effect is on ride-through and recovery, embedding its behavior in the composite load’s electronic-load parameters is defensible. If it actively smooths the POI power or could ever export, a separate dynamic device is more transparent. Agree the approach with the TO’s planners at kick-off; it is one of the questions they may need to research internally.
Q8. What are the ride-through requirements for a load?
TOs are adopting NERC PRC-029 — written for inverter-based generation — as the basis for large-load ride-through. Expect a voltage tolerance envelope with a continuous-operation zone around nominal, intermediate zones where the load must ride through but may reduce consumption in proportion to the voltage dip, a requirement to return to at least 90 percent of pre-disturbance consumption within one second of recovery above 0.9 per unit, and an outer zone where tripping or transfer to backup is allowed. Frequency ride-through follows the same pattern around a continuous band such as 58.8–61.2 Hz. Where on-site generation is interconnected at the POI, the load’s ride-through requirements may be tied to the generation’s PRC-024 or PRC-029 obligations.
Q9. Why does the TO want my load split into blocks?
So that no single event — a trip, a restoration step, an operational transition — can add or remove more than a defined amount of load at once. A 150 MW block limit is a value in current use. Segmentation also gives the TO a practical way to direct partial load reduction during emergencies, and it may underpin the facility’s participation in the under-frequency load shedding plan. Show the blocks on the SLD and describe the control method.
Q10. I have a facility THD figure from my design team. Is that enough for the harmonic requirement?
No. The TO needs the individual harmonic current injections at the point of compliance, to the 50th order, so it can compare each against IEEE 519 and its own limits. That requires OEM emission data for the converters and power supplies, aggregated through the facility’s transformers to the POI. A facility-level THD number is a useful sanity check but does not satisfy the submittal.
Q11. What short-circuit data do I need from the TO, and why?
Three-phase and single-line-to-ground fault levels at the POI, with positive- and zero-sequence Thevenin impedances under maximum and minimum system conditions. These feed the composite load model’s distribution equivalent, the harmonic aggregation, and the preliminary sizing of your transformers and switchgear. If the TO cannot provide them before your deadline, build the models on representative values and state that explicitly in the modeling-basis memo.
Q12. What happens after the application is accepted?
The TO performs its system impact studies (power flow, short circuit, stability, power quality) in coordination with MISO, develops the plan of interconnection and any network upgrades, and the transmission solution goes through MISO approval. During construction you provide final equipment data (typically at least three months before electrical construction). After construction you submit as-built data, the TO validates performance — potentially with monitoring and simulation — and after commissioning you submit as-left data. Material changes thereafter must be reported and may require re-study.
Q13. What is the most common reason applications stall?
Incomplete or inconsistent data. The TO’s requirements say plainly that inadequate modeling information can significantly delay the evaluation, and our experience agrees: models that do not initialize, load fractions that do not sum to the stated demand, a one-line that disagrees with the transformer data, or a ramp-rate claim with no explanation of how it is achieved. A single controlled project data sheet, from which every deliverable draws its values, prevents most of this.
Q14. Can the interconnection package be phased
Yes, and on a tight EPR schedule it usually should be. A reduced first package — conceptual SLD at the POI level, load data sheet, CMLD and load-protection models, and a one-page modeling-basis memo — gives the TO what it needs to run the load and prepare the EPR submittal. The full facility connection package follows for the TO’s detailed evaluation. Agree the phasing with the TO in writing so the reduced package is not read as an incomplete one.
Q15. Do I need a Professional Engineer?
The models and drawings should be prepared and reviewed under the responsible charge of a licensed Professional Engineer, and some TOs require sealed submittals. More practically, the TO’s planners are engineers who will ask engineering questions — about load composition, protection coordination with ride-through, harmonic cancellation, BESS control — and the applicant needs someone who can answer them in their language and revise the models the same day
10. How Keentel Engineering Supports Large-Load Applicants
Keentel Engineering prepares complete large-load interconnection packages for data center, industrial and storage developers across MISO and the other North American RTOs. A typical engagement includes:
- Kick-off and requirements mapping — attending the TO kick-off meeting, confirming the model set, software version, base case and submission process, and issuing a written data request and gap register that traces every TO requirement to its source.
- Conceptual single-line diagram — POI through MV distribution to the load blocks, including in-line UPS/BESS representation and TO-standard connection arrangements.
- Load data sheet and modeling assumptions memorandum — load composition, build-up schedule, power factor, ramp-rate and swing characteristics stated against the TO’s limits, with every value sourced.
- Dynamic model development — PSS®E composite load (CMLD) and load-protection (PERC-type) models, parameterized to the facility and the TO’s ride-through envelopes, verified in a test harness and delivered with a model report.
- Harmonic current spectrum — aggregated to the POI to the 50th order and screened against IEEE 519 and TO criteria.
- Submittal assembly and deficiency response — the TO’s information package and data request form, a transmittal index mapping every requirement to its evidence, and same-day technical responses through acceptance.
- Follow-on studies — EMT (PSCAD) load models, harmonic and flicker studies, protection coordination and NERC compliance support (PRC-029 ride-through, PRC-002 monitoring, PRC-006 UFLS) as the project moves from application to commissioning.
Our team works in PSS®E, PSCAD and the standard planning toolsets the RTOs and TOs use, and our deliverables are reviewed under a licensed Professional Engineer. If you have a large load heading for a MISO transmission owner — or for any other RTO — and a window you cannot afford to miss, we would welcome the conversation.
Keentel Engineering LLC — Tampa, FL | Austin, TX | Sacramento, CA | Baltimore, MD (813) 389-7871 | contact@keentelengineering.com | www.keentelengineering.com
This article describes general requirements and engineering practice. Specific requirements vary by transmission owner and change over time; always work from the TO’s current published facility connection requirements and MISO’s current business practice manuals.

About the Author:
Sandip "Sonny" R. Patel, P.E.
IEEE Senior Member · Founder & CEO, Keentel Engineering
In 1995, Sonny Patel earned his Electrical Engineering degree from the University of Illinois. But degrees don't build legacies — action does.
For three decades, he has worked the power industry from every side of the table: 16 years as a utility engineer at Exelon/Commonwealth Edison; generation leadership across hydroelectric, industrial steam turbine, and a 9 GW renewable fleet; NERC Regional Entity Senior Compliance Engineer and Audit Team Lead, auditing some of the nation's largest utilities; and testing and commissioning lead on equipment up to 765 kV — the very top of the North American grid.Utility. Generator. Regulator. Consultant. Few engineers have seen all four seats. Fewer still have sat in them.
His experience spans nuclear, hydro, conventional generation, renewables, oil and gas, mining — and today's data centers, where he is authoring a three-book series on data center design. He is a Licensed Professional Engineer in six states and a Licensed Electrical Contractor in Florida (Unlimited EC) — he doesn't just design the work; he's qualified to stand behind its execution.Today, as Founder and CEO of Keentel Engineering, Sonny leads a nationwide team of engineers delivering substation design, power system studies, NERC compliance, and commissioning — done right, coast to coast.Three decades. Every side of the table. One standard: accountable engineering.
Services

Let's Discuss Your Project
Let's book a call to discuss your electrical engineering project that we can help you with.
About the Author:
Sandip "Sonny" R. Patel, P.E.
IEEE Senior Member · Founder & CEO, Keentel Engineering
In 1995, Sonny Patel earned his Electrical Engineering degree from the University of Illinois. But degrees don't build legacies — action does.
For three decades, he has worked the power industry from every side of the table: 16 years as a utility engineer at Exelon/Commonwealth Edison; generation leadership across hydroelectric, industrial steam turbine, and a 9 GW renewable fleet; NERC Regional Entity Senior Compliance Engineer and Audit Team Lead, auditing some of the nation's largest utilities; and testing and commissioning lead on equipment up to 765 kV — the very top of the North American grid.
Utility. Generator. Regulator. Consultant. Few engineers have seen all four seats. Fewer still have sat in them.
His experience spans nuclear, hydro, conventional generation, renewables, oil and gas, mining — and today's data centers, where he is authoring a three-book series on data center design. He is a Licensed Professional Engineer in six states and a Licensed Electrical Contractor in Florida (Unlimited EC) — he doesn't just design the work; he's qualified to stand behind its execution.
Today, as Founder and CEO of Keentel Engineering, Sonny leads a nationwide team of engineers delivering substation design, power system studies, NERC compliance, and commissioning — done right, coast to coast.Three decades. Every side of the table. One standard: accountable engineering.
Leave a Comment
Thank you for contacting us.
We will get back to you as soon as possible.
We will get back to you as soon as possible.
Oops, there was an error sending your message.
Please try again later.
Please try again later.
Related Posts
By SANDIP R PATEL
•
September 22, 2026
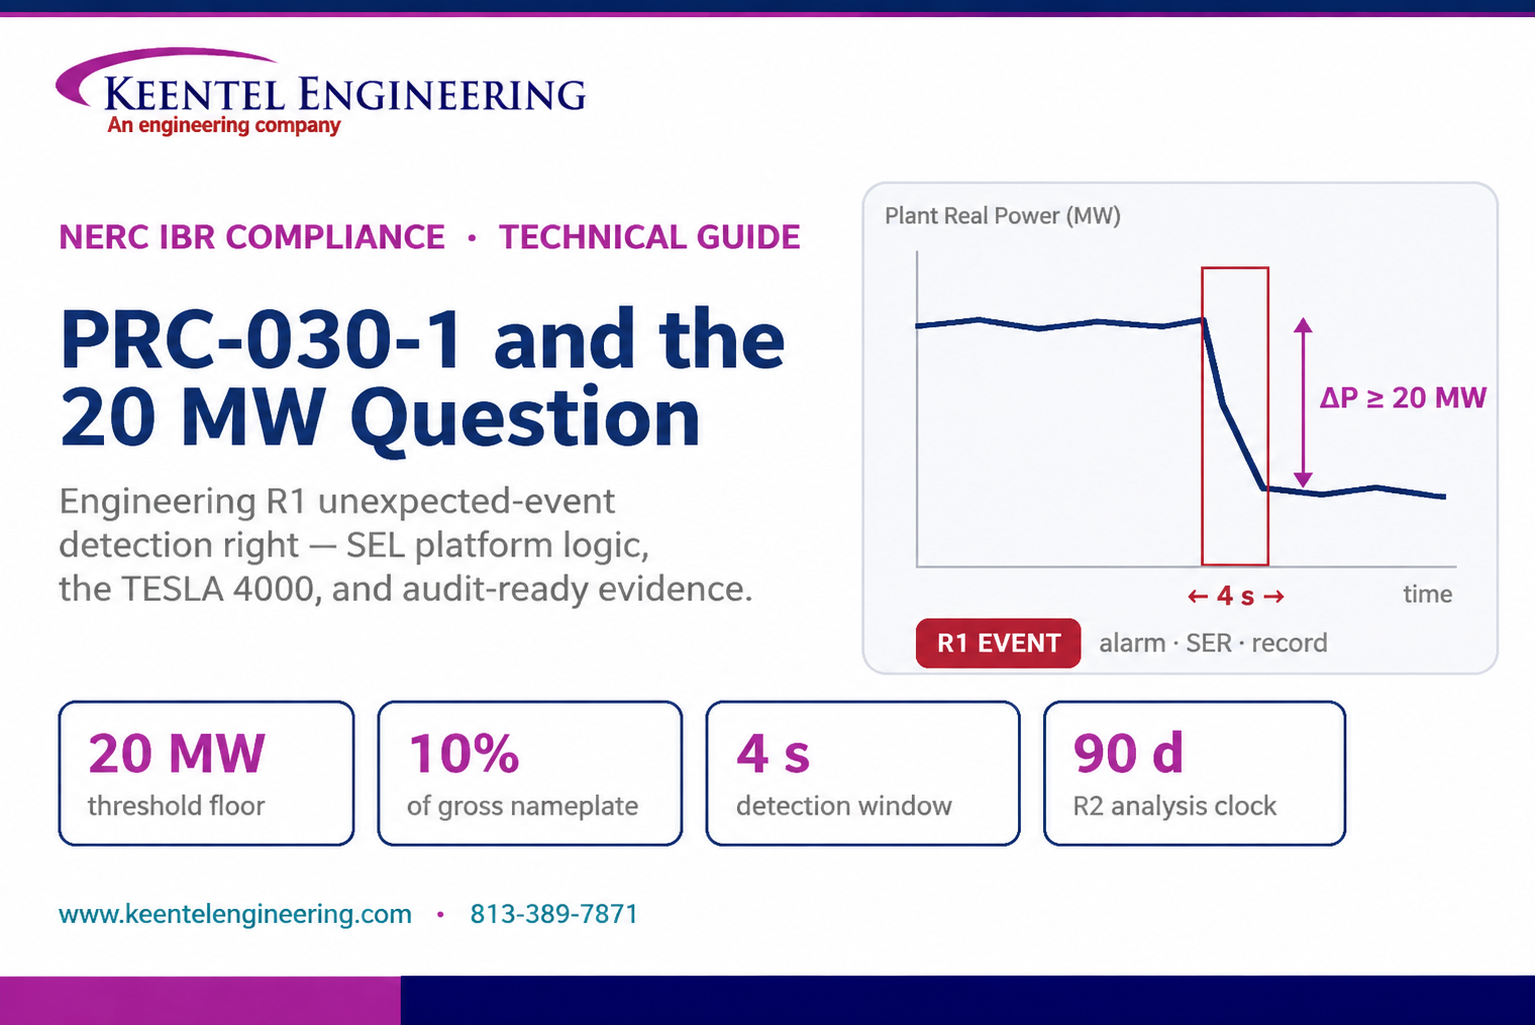
Learn PRC-030-1 R1 event detection requirements for inverter-based resources, SEL platforms, disturbance monitoring, and audit-ready compliance.
By SANDIP R PATEL
•
September 22, 2026
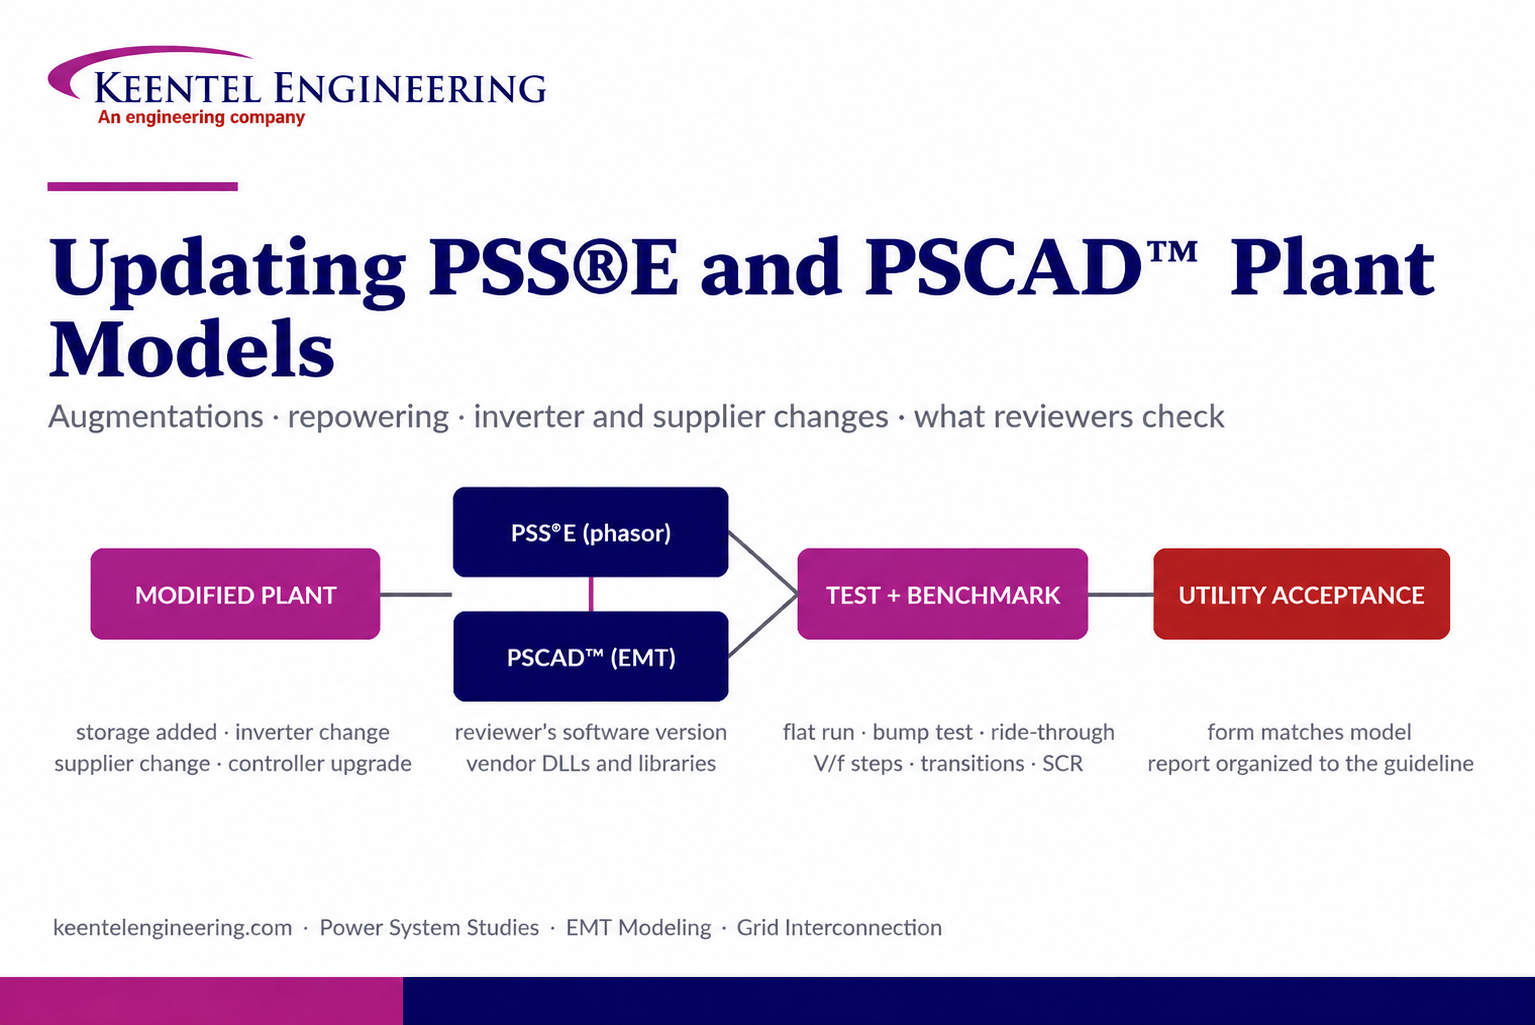
Learn how PSS®E and PSCAD™ model updates support plant augmentations, repowering, equipment changes, testing, benchmarking, and grid compliance.
By SANDIP R PATEL
•
September 20, 2026
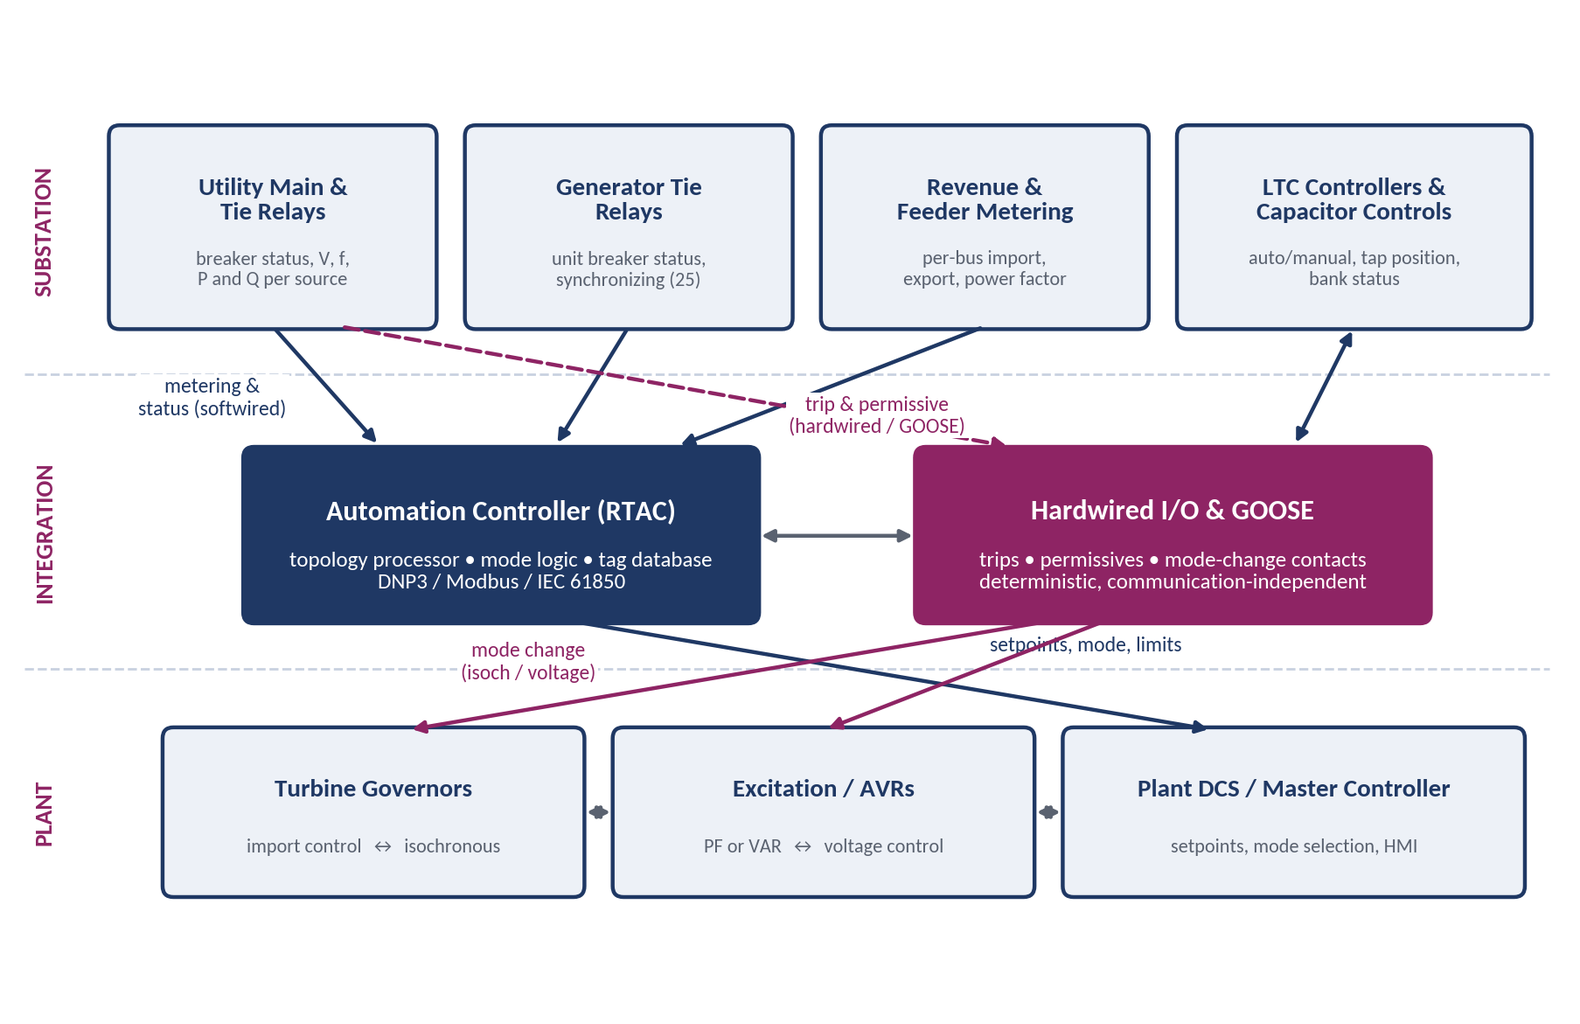
Learn CHP load following and island detection engineering for campus plants, including protection, controls, power studies, and grid transition design.
By SANDIP R PATEL
•
September 20, 2026
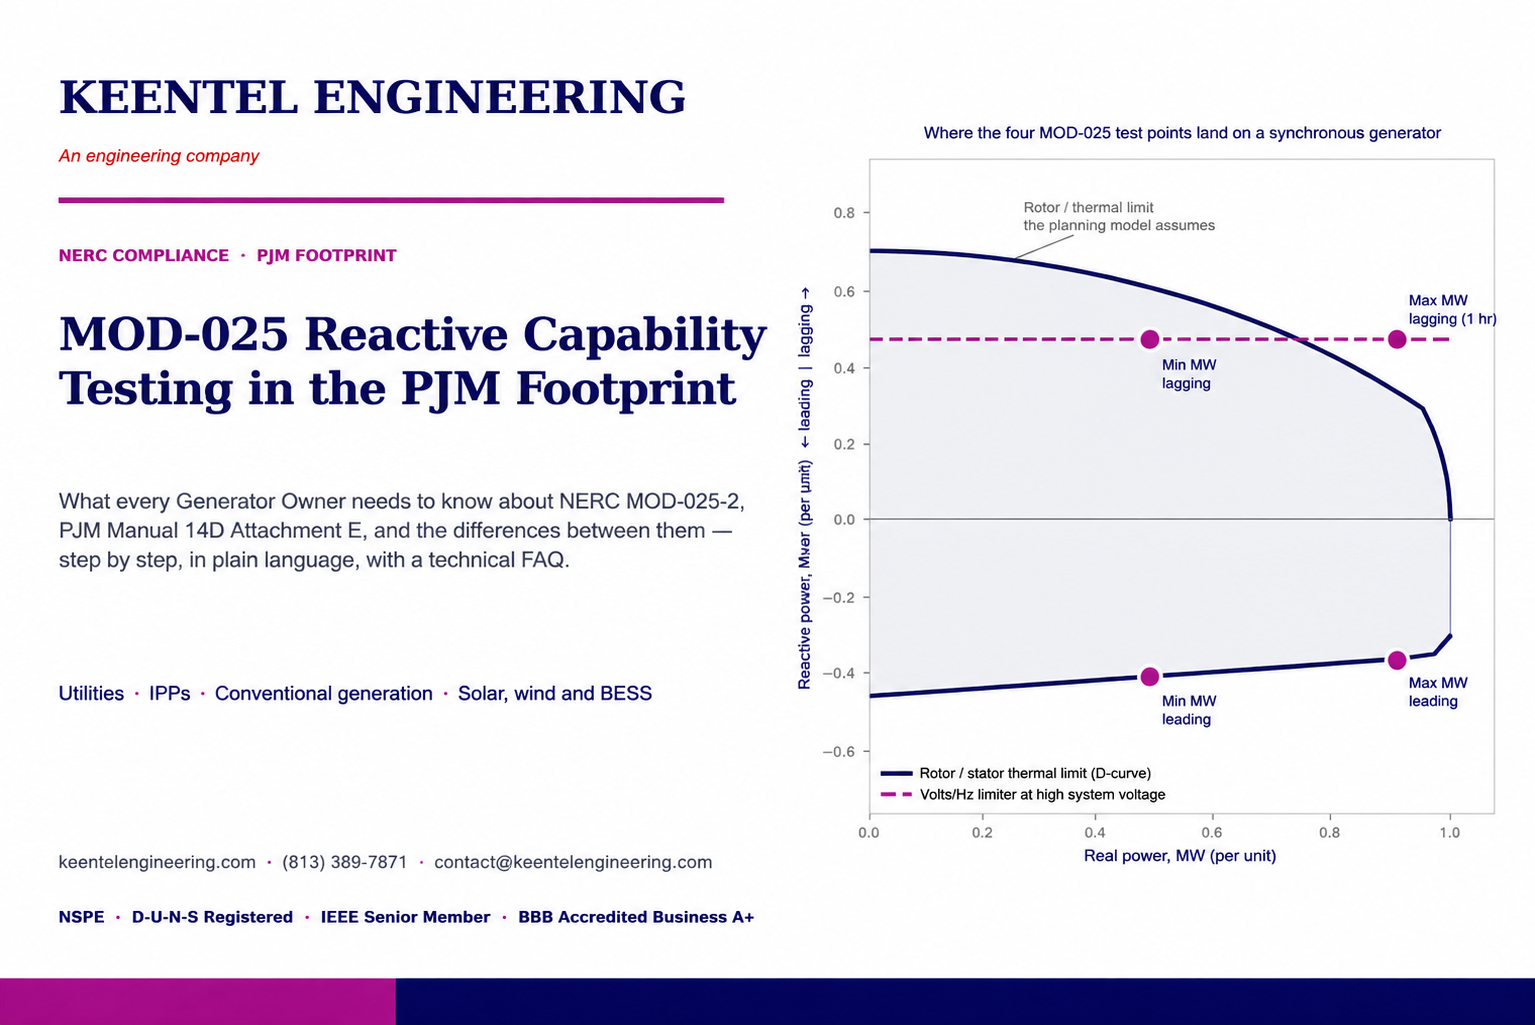
NERC MOD-025-2 Generator Owners, MOD-025-2 reactive power testing, generator capability verification, NERC Attachment 1, MOD-025 compliance testing
By SANDIP R PATEL
•
September 20, 2026
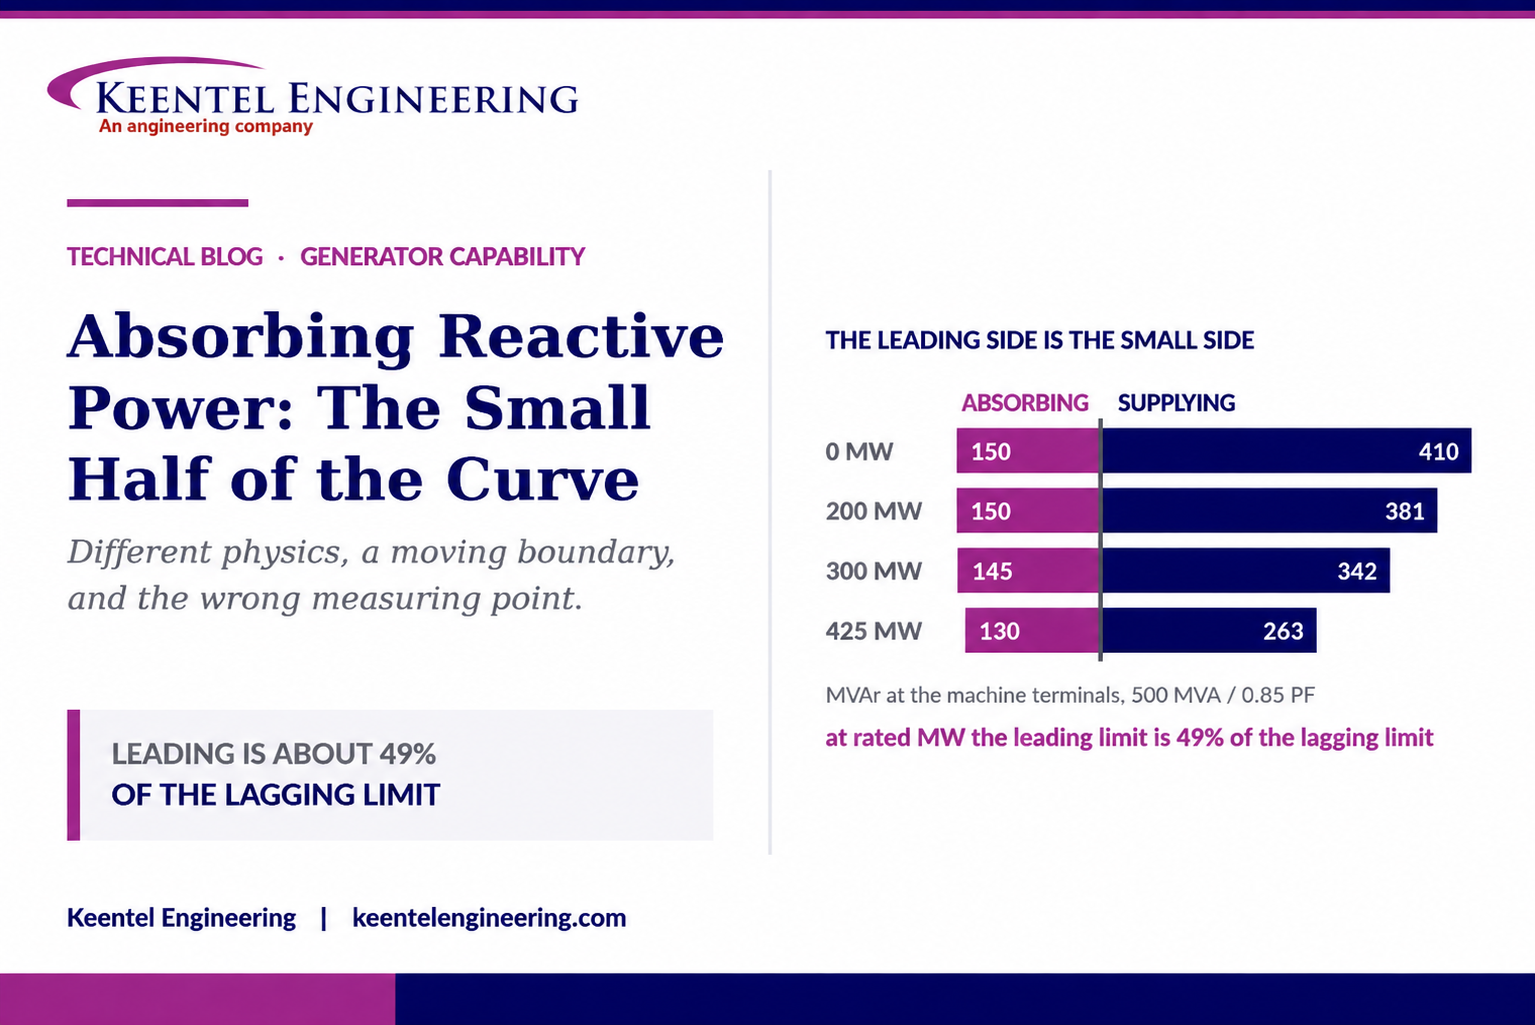
Understand generator capability curves, reactive power absorption, MVAr limits, MOD-025 verification, protection coordination, and grid requirements.
By SANDIP R PATEL
•
September 19, 2026
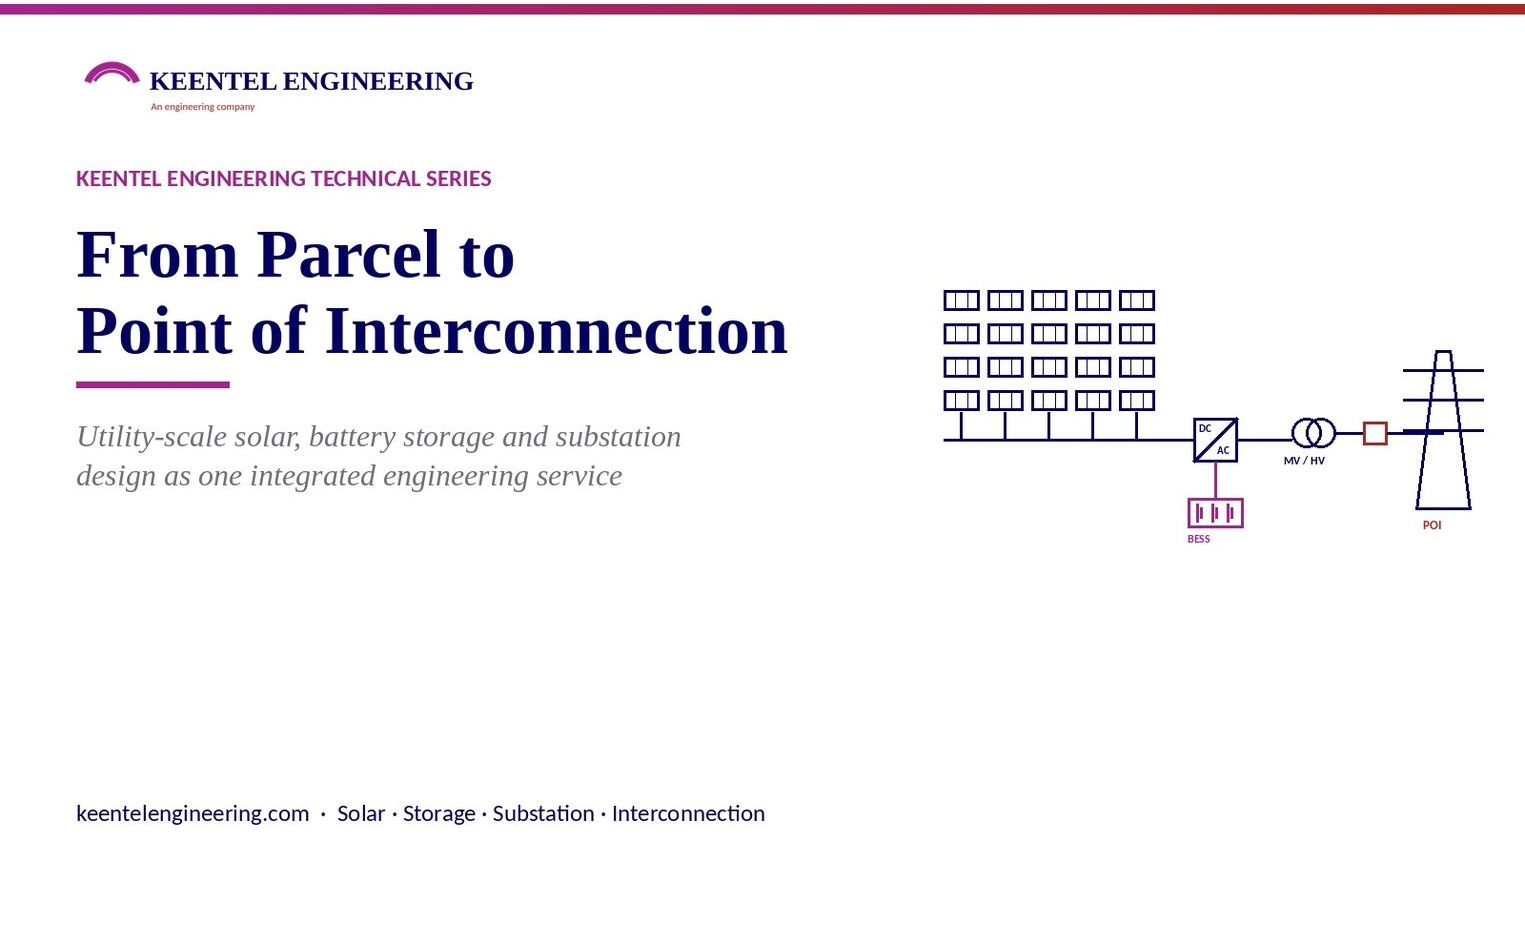
Explore utility scale solar engineering from site assessment to POI interconnection, including PV design, BESS, substation and grid studies.
By SANDIP R PATEL
•
September 18, 2026
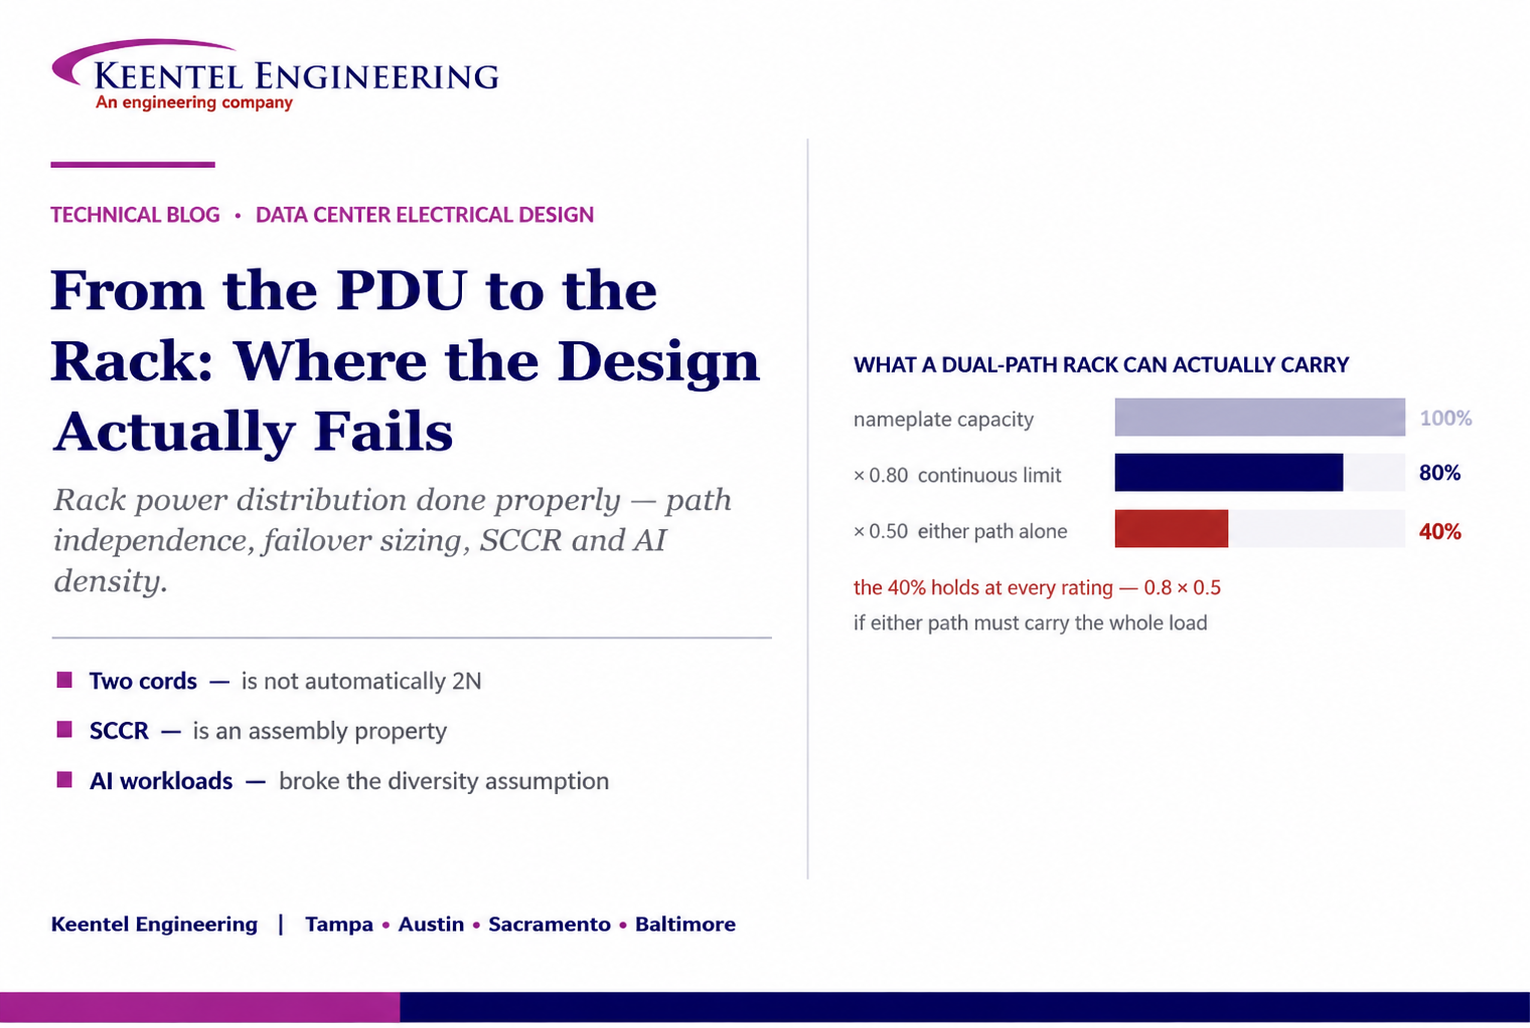
Learn how to size rack power distribution, PDU and RPP systems for continuous loads, A/B redundancy, failover capacity, SCCR and high-density AI data centers.
By SANDIP R PATEL
•
September 18, 2026
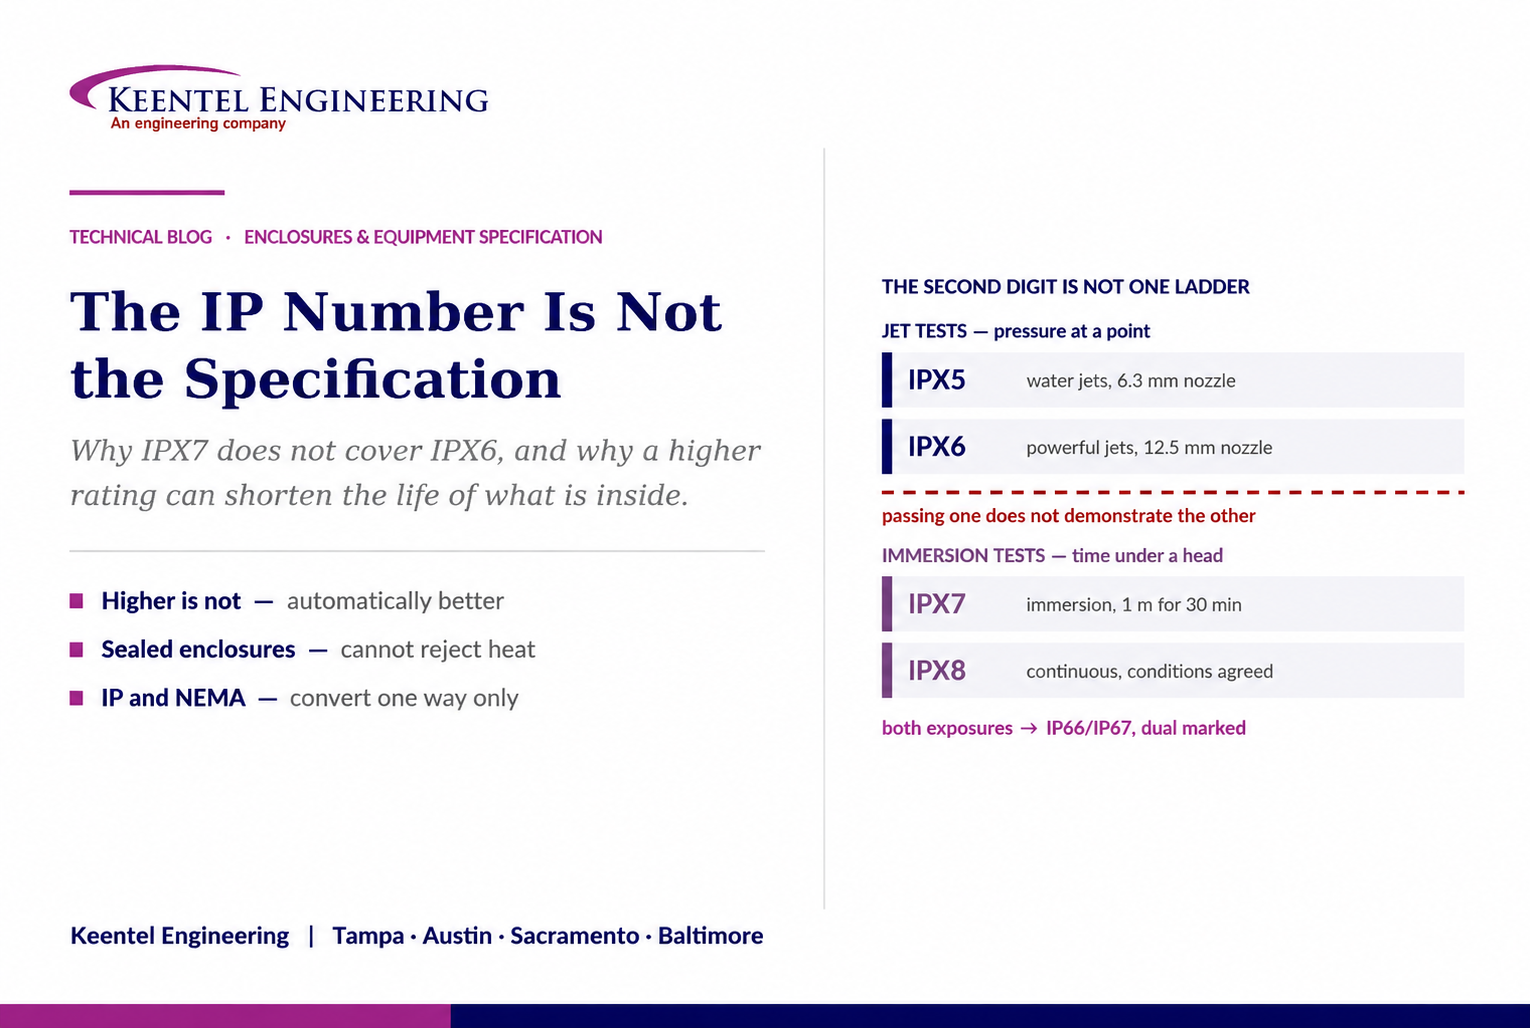
Learn why IP ratings like IP66, IP67, and IP68 do not tell the full story. Understand enclosure selection, NEMA differences, heat, corrosion, and protection.
By SANDIP R PATEL
•
September 15, 2026
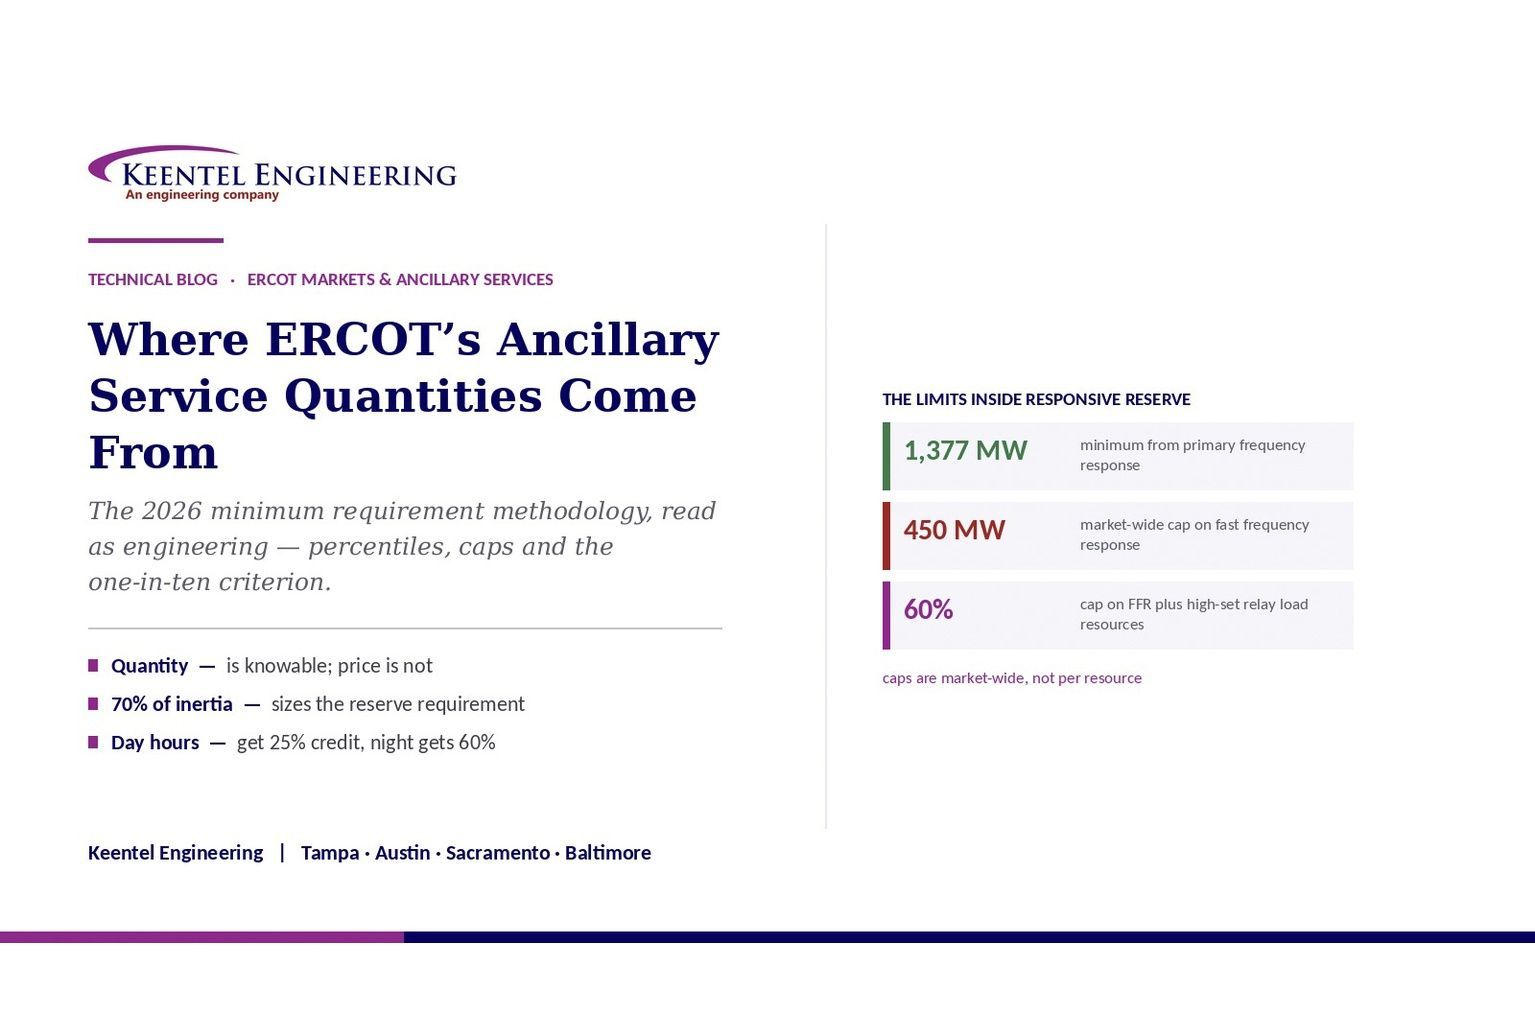
Learn how ERCOT calculates 2026 Regulation, RRS, ECRS and Non-Spin requirements, including inertia, FFR caps, forecast error and reserve methodology.





