
A Coordinated Electric System Interconnection Review—the utility’s deep-dive on technical and cost impacts of your project.
Challenge: Frequent false tripping using conventional electromechanical relays
Solution: SEL-487E integration with multi-terminal differential protection and dynamic inrush restraint
Result: 90% reduction in false trips, saving over $250,000 in downtime
ERCOT enforces all of the above through simulation, which means your model is your compliance case. The bar is now high:
- Whole-facility scope. The model must represent everything the IT load, the UPS and power conversion, the cooling plant, the protection and control systems in formats compatible with ERCOT's study platforms (PSS/E, PSCAD, TSAT).
- Real control loops, not approximations. Generic textbook representations are unacceptable. The model must capture the actual inner control behavior of your power electronics.
- Hardware-validated converter models. For electronic loads, the PSCAD model must be benchmarked against actual hardware testing including voltage ride-through and subsynchronous response. A model assembled from standard PSCAD library blocks fails by definition, because a generic block has never been tested against your vendor's hardware. The good news: validation is a hardware-type test, so results for a given converter product are reusable across every facility that uses it.
- Format migration. Facilities that previously submitted the older composite load model (CMLD) format must transition to EPRI's PERC1 format.
- Three checkpoints. Models are reviewed before the stability study begins (no model, no study), before each quarterly stability assessment, and for electronic loads one final time before energization, when you must submit as-built models with a documented comparison against the previously studied data and a sworn attestation that the model matches actual field settings. ERCOT's review takes 10 business days, extendable by 20 put it on your critical path.
- A living obligation. Change your technology, controls, or relay settings in a way that affects ride-through including converting a crypto mining site to an AI data center — and you've triggered a new interconnection study, even if your megawatts don't change.
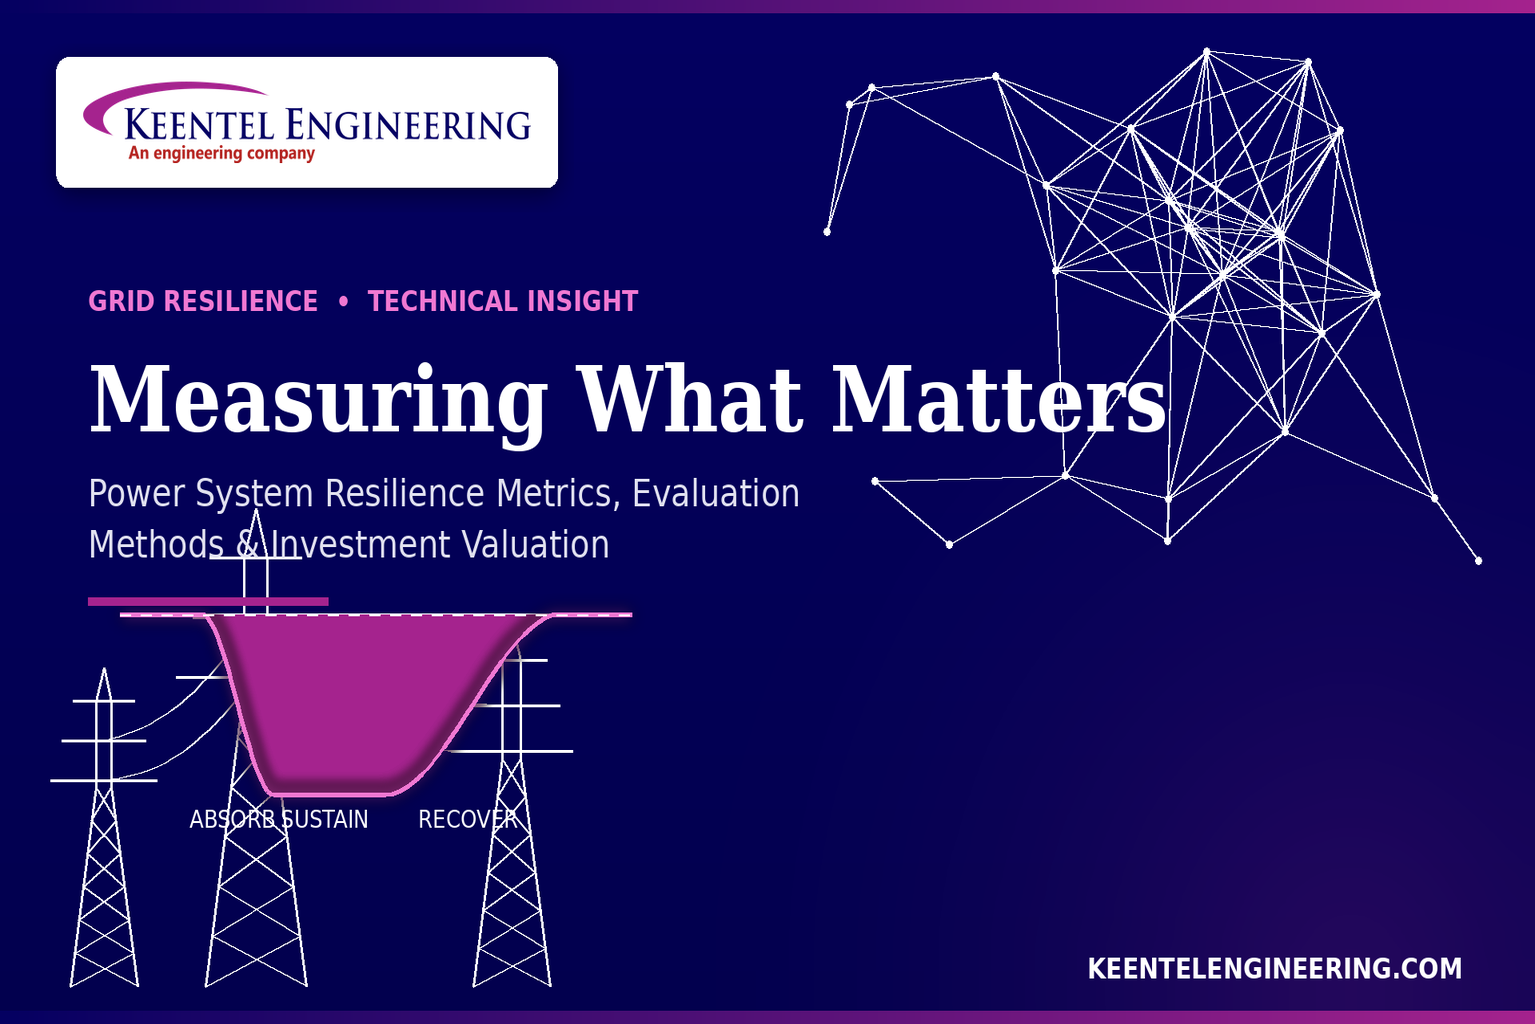
Measuring What Matters
Jul 07, 2026 | Blog
A Practical Framework for Power System Resilience Metrics, Evaluation Methods, and Investment Valuation
Keentel Engineering Technical Blog • Engineering FAQ • Anonymized Case Studies • Service Capabilities
Notice and Disclaimer
This publication is original technical content developed and copyrighted by Keentel Engineering. It reflects Keentel Engineering's independent engineering perspective on power system resilience metrics, evaluation methods, and investment valuation, informed by our project experience in transmission and distribution planning, grid interconnection, utility-scale renewables and energy storage, and reliability compliance engineering.
Keentel Engineering is an independent consulting engineering firm. This document is not affiliated with, sponsored by, or endorsed by any standards development organization, regional transmission organization, independent system operator, reliability coordinator, government agency, national laboratory, or equipment manufacturer. All trademarks, registered marks, program names, and product names referenced in this publication, if any, are the property of their respective owners and are used solely for identification purposes.
The case studies presented in this document are anonymized and generalized composites drawn from engineering practice. Client names, project names, locations, counterparties, and commercially sensitive parameters have been altered or omitted. Any resemblance to a specific project or organization is coincidental.
This document is provided for general technical information only and does not constitute engineering services, legal advice, or a professional engineering deliverable for any specific project. Resilience metric selection, valuation, and investment decisions must be evaluated by qualified professionals against project-specific data, applicable reliability standards, regulatory requirements, and contractual obligations.
PART I — TECHNICAL BLOG: Measuring What Matters in Grid Resilience
1. Why Resilience Metrics, and Why Now
For most of the past century, the power industry measured itself with a small, stable family of reliability indices. SAIDI, SAIFI, and CAIDI told regulators how the average customer fared over the average year. LOLE and EENS told planners whether the resource fleet could cover expected demand. These indices did their job well for the grid they were designed to describe: a grid dominated by dispatchable generation, statistically independent component failures, and weather that behaved roughly the way it always had.
That grid no longer exists. Extreme weather events are striking with greater frequency and severity, cyber and cyber-physical threats against utilities and grid assets are escalating, infrastructure is aging, and the resource mix is shifting rapidly toward weather-dependent, inverter-based generation. At the same time, load itself is transforming data centers, electrification, and large industrial additions are concentrating enormous demand behind single points of interconnection. The events that now define grid performance are not the routine, uncorrelated faults that reliability indices average away. They are high-impact, low-probability (HILP) events: hurricanes, ice storms, wildfires, extended heat domes, coordinated attacks, and cascading failures that take out hundreds of components at once and keep customers dark for days or weeks.
Reliability metrics were never built to see these events clearly. In fact, standard practice often explicitly excludes them major event days are routinely removed from SAIDI reporting precisely because they distort year-to-year comparisons. The result is a measurement blind spot exactly where the stakes are highest. Resilience metrics exist to close that blind spot: to quantify how deeply a system degrades under extreme stress, how quickly it recovers, what the disruption actually costs customers and the economy, and critically whether a proposed hardening or flexibility investment is worth the money.
This article lays out a practical, engineering-grade framework for resilience measurement: what resilience means, how it differs from reliability, how metrics should be classified and selected, how real utility outage data is converted into defensible resilience numbers, how heavy-tailed blackout risk changes the math, and how resilience value is monetized for regulatory filings and investment decisions. Throughout, we approach the problem the way Keentel Engineering approaches every grid problem: resilience, like interconnection, is a first-order design input — not a downstream compliance formality.
Keentel Perspective:
A resilience metric is only useful if it can be computed from data you actually have, moves when you invest in the system, and survives cross-examination in front of a regulator. Metrics that fail any of those three tests are decoration. Everything in this framework is filtered through that standard.
2. Where Traditional Reliability Metrics Fall Short
Reliability indices remain indispensable for day-to-day planning and performance regulation, and nothing in a resilience program replaces them. But they are structurally incapable of characterizing performance during extreme events, for seven distinct reasons:
- Built for expected conditions. Reliability standards assume failures are independent, statistically consistent, and well represented by historical averages. Extreme events violate every one of those assumptions, producing correlated, cascading, large-scale failures that exceed design limits.
- No view of degradation or recovery. Reliability indices are long-term averages. They say nothing about how fast a system degrades, how deep the service loss goes, or how quickly restoration proceeds during and after a specific event.
- Human and organizational factors invisible. Extreme events strain crews, communications, and decision-making. System performance during a hurricane is a function of organizational resilience and staffing as much as hardware — dimensions reliability indices simply do not carry.
- Blind to cyber-physical and multi-infrastructure threats. Standard indices focus on physical component outages and ignore cyberattacks, communication failures, fuel supply disruption, interdependent infrastructure failures, and distributed resource variability.
- Not designed to guide hardening. SAIDI improvements do not tell you where to underground, which substations to elevate, where microgrids belong, or how much flexible capacity to hold. Utilities need metrics that connect directly to actionable investments.
- Equity and critical loads averaged away. Reliability indices treat all customers identically, masking impacts on hospitals, emergency services, water systems, and vulnerable populations exactly the loads a resilience program exists to protect.
- Misaligned with non-stationary threats. Reliability frameworks rest on stationarity the assumption that the future statistically resembles the past. Climate-driven weather and evolving cyber threats are fundamentally non-stationary, so backward-looking indices cannot support forward-looking resilience planning.
The conclusion is not that reliability metrics should be discarded they remain the baseline expectation of performance under normal conditions. The conclusion is that a second, complementary class of metrics is required to characterize robustness, adaptability, and recovery under abnormal conditions. That is the entire project of resilience measurement.
3. Defining Resilience: The Event Lifecycle
Across the definitions advanced by standards bodies, system operators, national laboratories, and regulators, a consistent core emerges: resilience is the ability of a power system to anticipate, absorb, adapt to, and rapidly recover from extraordinary, high-impact events including natural hazards, equipment failures, accidents, and deliberate physical or cyber attacks while limiting the extent, severity, and duration of degradation and sustaining critical services.
Two features of this definition deserve emphasis, because they drive everything about metric design. First, resilience is explicitly multi-phase. A resilience event unfolds through anticipation and preparation (risk identification, hardening, contingency planning before the event), absorption (withstanding the initial shock while maintaining at least partial operation), adaptation and sustainment (dynamic response, reconfiguration, and critical-load prioritization during prolonged disruption), and recovery (efficient restoration of service and infrastructure to pre-event or improved condition). A meaningful metric set must cover the full lifecycle — a system that absorbs well but recovers slowly, and a system that fails hard but restores fast, are different engineering problems requiring different investments.
Second, resilience admits degraded operation. Reliability compliance is binary: criteria are satisfied or violated. Resilience explicitly accepts that an extreme event may temporarily compromise normal operation, and instead asks whether degradation was controlled, proportionate to the event, and reversed quickly. This is a fundamentally different acceptability philosophy, and it is why resilience cannot simply be bolted onto existing reliability criteria.
4. Resilience vs. Reliability: A Working Comparison
The practical distinctions between adequacy, security, and resilience determine which analytical tools, contingency sets, and acceptance criteria apply to a given study. The comparison below summarizes the differences that matter in practice.
| Aspect | Reliability (Adequacy / Security) | Resilience |
|---|---|---|
| Scope | The power system itself; environment enters only through adjusted failure rates | The power system plus its interactions with environment, threats, and human operators |
| Extreme events | Limited relevance; grid codes focus on credible contingencies | Central focus; events commonly excluded from design provisions |
| Contingency selection | Predefined N-1 to N-k lists per grid codes and planning standards | High-impact events selected by operator experience or risk-based screening across time frames |
| Time evolution | Availability of units and components across system states | Full event timeline: threat evolution, absorption, operator response, infrastructure repair, restoration, and long-term organizational adaptation |
| System impact | Unserved demand; instability or limit violations | Customer supply loss and infrastructure damage, disruption and recovery times, and operator/crew performance under stress |
| Acceptability | Strict criteria, uniform across all studied events | Controlled degraded operation accepted, calibrated to event severity |
| Modeling | Deterministic worst-case checks; probabilistic LOLE/EENS methods | Deterministic extreme-event scenarios plus probabilistic threat, damage, restoration, and countermeasure models |
One doctrinal point is worth carrying into every study: security requires the integrity of conventional load service, while resilience does not. Loads under interruption or demand-response contracts are a security resource; involuntary loss of conventional load during an extreme event is a resilience impact to be measured, bounded, and priced. Keeping those categories straight prevents a common analytical error counting contracted flexibility as a resilience failure, or worse, counting involuntary shedding as acceptable flexibility.
There is also a productive middle path: existing reliability metrics can be conditioned to capture resilience attributes. Expected load curtailment, for example, becomes a resilience metric when the expectation is restricted to events exceeding a severity threshold — a duration beyond 24 hours, an event with more than a set number of simultaneous outages, or costs above a defined level. Threshold-conditioned reliability metrics are often the fastest path to a defensible resilience baseline, because they reuse data pipelines and institutional familiarity that already exist.
5. A Taxonomy of Resilience Metrics
Resilience cannot be condensed to a single number. A workable program classifies metrics along several axes and selects deliberately from each, aligned with the decisions the metrics are meant to inform.
5.1 Vulnerability Modeling: Model-Based vs. Statistical
Every resilience assessment rests on a model of how components and systems fail under stress. Two complementary approaches exist. The model-based (analytical) approach builds fragility relationships for individual components the conditional probability that a line, structure, or insulator fails as a function of wind speed, ice accretion, flood depth, or other hazard intensity and composes them into system response. Its strength is direct investment traceability: once the model is calibrated, a proposed hardening measure changes a fragility curve, and the resilience benefit can be computed. Its weakness is the sheer heterogeneity of real systems ages, designs, exposures, and failure modes vary so widely that system-level calibration and validation are genuinely hard.
The statistical approach works from the other direction: it relates recorded utility outage data to recorded hazard intensity, producing area outage rate curves that describe the system's observed average outage rate as a function of measured stress such as wind speed. These curves capture the system's overall response all component types, ages, and exposures blended together which is exactly what makes them powerful for benchmarking and exactly what limits them for prediction: because they encode the past, they cannot by themselves describe a future that differs from past experience, whether through climate change or through the very hardening investment being evaluated. Mature programs use both: statistical curves to establish the empirical baseline and validate models, analytical fragility models to project the effect of proposed changes.
5.2 Planning vs. Operational Metrics
Planning metrics evaluate a system's inherent capability before an event: performance under predefined damage scenarios, redundancy and robustness attributes, multi-criteria scores weighting robustness, redundancy, and recoverability, and risk-based cost-benefit indicators used to select portfolios of hardening and operational measures. Operational metrics evaluate performance in and after real events: real-time degradation tracking, restoration progress, and post-event assessment against planning assumptions. The most effective frameworks close the loop event data validates planning models, exposes gaps, and recalibrates the next planning cycle. A resilience program that only plans, or only reports, is half a program.
5.3 Transmission vs. Distribution
Transmission and distribution demand different metrics because they differ in topology, control hierarchy, failure physics, and data. Transmission resilience is characterized by energy not served in MWh, stability margins, N-k withstand capability, topological criticality, and cascading-failure exposure, measured largely through SCADA and synchrophasor data. Distribution resilience is customer-facing: customers interrupted, customer-hours lost, restoration rates, critical-load continuity, feeder reconfiguration and islanding capability, measured through outage management systems and AMI. Because impacts propagate across the interface transmission events strand distribution restoration, and distribution DERs increasingly support transmission recovery metric frameworks should align both levels on shared dimensions such as restoration duration, robustness, and recovery slope so that results remain comparable across the hierarchy.
5.4 Grid vs. Community and End-User Perspectives
System-level metrics total customers affected, aggregate energy not supplied, time to restore a defined fraction of regional load describe the interconnected grid. Community-scale metrics describe microgrids and islandable systems: sustainable islanding duration, fraction of community demand met by local resources, voltage and frequency stability in islanded mode, and the speed and reliability of transitions between grid-connected and islanded operation. And beneath both sits the end-user perspective, which reframes resilience in terms customers actually experience: individual interruption duration, continuity of critical services, predictability of restoration estimates, and economic losses by customer segment. Regulators are increasingly explicit that resilience value must ultimately be expressed in customer terms one practical formulation indexes each candidate grid intervention by the ratio of disconnected users to the return period of the initiating event, a compact way to rank investments by customer risk reduction per event likelihood.
6. From Curves to Numbers: Practical Metrics from Real Outage Data
The most defensible resilience metrics are computed directly from data utilities already record: time-stamped outage and restoration events with minute-level resolution, cause codes, and on distribution systems customer counts. Converting that raw data into resilience metrics follows a disciplined pipeline.
6.1 Grouping Outages into Resilience Events
Resilience is a property of events, not of isolated outages. The first processing step groups individual forced outages into events based on temporal clustering of outage start times and overlap of outage durations. Event sizes span an enormous range most events are single outages; the rare extreme events involve hundreds of simultaneous outages from severe weather or cascading phenomena. It is precisely this event-level structure, invisible to annual averages, that resilience analysis exists to capture.
6.2 The Outage, Restore, and Performance Processes
For each event, define the outage process O(t) as the cumulative number of outages by time t and the restore process R(t) as the cumulative number of restorations. The performance curve P(t) = R(t) − O(t) tracks the negative of unrestored outages, decrementing at each outage and incrementing at each restore. The idealized resilience trapezoid degradation phase, sustained nadir, then recovery phase is the textbook picture, but real utility data almost never separates so cleanly: outage and restore processes overlap in time, heavily so on distribution systems. The decomposition of the performance curve into its outage and restore processes generalizes the trapezoid, works on real data, and preserves every trapezoid metric without assuming restoration waits for damage to finish.
The vertical axis is a design choice. Track component counts for asset-centric analysis, MVA ratings for transmission capability, or customer counts for distribution impact in which case the area between the performance curve and the time axis is exactly the customer-hours lost in the event, and the nadir is the maximum simultaneous customers out.
6.3 The Core Metric Set
| Process | Recommended metrics | Notes |
|---|---|---|
| Outage process | Event size (outages, MVA, or customers); outage duration; outage rate | Event size in customers is the most informative distribution measure |
| Restore process | Time to first restore; restore rate (distribution); time to 95% restore (transmission) | Final restorations on redundant transmission are statistically erratic — anchor on 95% (or 50%/90%) restoration instead of full-event duration |
| Performance curve | Area under curve (outage-hours, MVA-hours, or customer-hours); nadir | Customer-hours area equals the event's contribution to the SAIDI numerator when the event is not excluded as a major event day |
| Crew deployment | Total crew-hours; restoration efficiency (customer-hours per crew-hour); crew-hours per outage restored; Emergency Response Efficiency (log-composite) | Connects restoration outcomes to the resources deployed — makes mutual-assistance and staffing decisions quantitative |
The crew metrics deserve special mention because they close the gap between engineering and operations. Tracking deployed crews C(t) hour-by-hour through a restoration yields total crew-hours; dividing customer-hours lost by crew-hours gives restoration efficiency, and normalizing customer-hours by customers affected gives the restoration experience of the average outaged customer. A logarithmic composite of average customer restoration duration and crew-hours per outage the emergency response efficiency compresses these into a single comparable score across events of very different size. Lower is better, and trends in this metric across storm seasons are a direct, data-driven readout of whether emergency response investments are working.
7. The Heavy-Tail Problem: Why Blackout Risk Breaks Ordinary Statistics
Convert each event's customer-hours to direct customer cost using a cost-per-customer-hour factor appropriate to the service territory's load mix, and assemble every event over several years into an empirical exceedance curve the probability that an event's cost exceeds a given value, plotted on log-log axes. The small-cost region of that curve describes routine risk. The large-cost region describes resilience risk, and it routinely exhibits a property that changes the mathematics: heavy tails, with log-log slope magnitudes below one observed on multiple real distribution systems.
A heavy tail has three brutal implications. First, there is no representative large blackout the tail keeps producing larger events, so planning to a single design-basis event systematically understates risk. Second, the risk contributed by large events dominates the risk from all the moderate events combined. Third and this is the one that invalidates familiar tools sample means over the tail do not converge with any realistic amount of data, so metrics and methods that depend on evaluating a mean, including conditional value-at-risk and expected-value optimization, simply cannot be applied to large-blackout cost.
The practical remedy is to work in log space. Taking the logarithm of large-event costs converts heavy-tailed data into light-tailed data on which ordinary statistics behave. Averaging the log-costs of large events yields a stable severity metric; multiplying by the annual frequency of large-cost events yields an annualized log-cost resilience index that is stable year over year, sensitive to genuine changes in system resilience, and unlike a tail expectation actually estimable from the data a utility has. For risk statements, complement this with exceedance-based metrics: the probability that an event exceeds a defined large-cost threshold, the annual frequency of such events, and their recurrence interval.
Engineering Judgment:
If a consultant hands you a single expected-value dollar figure for large-blackout risk, ask how it was estimated. On heavy-tailed systems that number is an artifact of the sample, not a property of the system and an investment case built on it will not survive technical review. Exceedance metrics and log-domain indices are the defensible alternative.
8. Putting a Dollar Value on Resilience
Resilience investments compete for capital against everything else a utility or developer could build. Winning that competition in front of a board, a commission, or an interconnection counterparty requires converting resilience performance into money. Three methodological families carry most of the weight.
8.1 Probabilistic Risk Assessment
PRA follows the fundamental equation risk = probability × consequence: characterize hazards and their frequencies, assess component vulnerabilities, analyze consequences across failure modes, and rank risks. Executed across thousands of simulated scenarios, PRA gives decision-makers a quantitative map of failure modes and mitigation effectiveness. Its cost is data intensity especially for rare events and the specialized expertise needed to build and defend the scenario set.
8.2 Cost-Benefit Analysis and the Value of Lost Load
CBA compares the present value of resilience investment costs capital, O&M, opportunity cost against the present value of avoided costs: avoided infrastructure damage and repair, avoided utility revenue loss, avoided customer outage cost, and avoided broader economic and social impact. The customer term is typically monetized through the Value of Lost Load, and here a critical caution applies: VoLL parameters calibrated for reliability analysis describe interruptions of minutes to a day. Resilience events last days to weeks, and outage cost is strongly nonlinear in duration spoilage, equipment damage, business failure, and public-safety costs accumulate in regimes short-duration VoLL never sampled. Customer damage functions that express outage cost as a function of duration, by facility type, are the better instrument: they reveal, for example, that a battery covering short outages delivers major value to a facility whose costs front-load at interruption onset, and almost none to a facility whose costs begin when refrigeration fails four hours in.
8.3 Resilience-Adjusted Resource Adequacy
Traditional effective load carrying capability measures a resource's contribution to adequacy under normal conditions and misses how resources perform when it matters most. The resilience-adjusted extension evaluates a resource across a probability-weighted set of disruptive event scenarios, each characterized by intensity, duration, and restoration trajectory. For each scenario, compute expected energy not served with and without the resource; the probability-weighted fractional reduction in unserved energy is the resource's resilience-adjusted capacity value. Multiplying that value by the applicable VoLL and representative event duration converts it directly into avoided outage cost a single, auditable bridge from technical adequacy modeling to monetary benefit that lets grid hardening, dispatchable generation, storage, and DERs compete in one framework.
As a scale illustration: a distribution-connected battery energy storage system that reduces modeled storm-event unserved energy by thirty percent, valued at a defensible multi-day VoLL over a representative event duration, produces an avoided-cost figure that can anchor a rate case or an interconnection benefit study. The arithmetic is simple; the engineering content lives in the scenario set, the degradation and restoration modeling, and the VoLL selection which is exactly where these analyses are won or lost.
8.4 Macroeconomic Impact and Composite Indices
For regional and national decisions, input-output and computable general equilibrium models trace outage impacts through inter-sector dependencies to GDP, employment, and sectoral output capturing cascading economic effects that customer-level VoLL misses, at the price of heavy data and modeling requirements and limited ability to disaggregate to specific customer classes. Composite resilience indices resilience triangles and trapezoids, multi-dimensional scores blending performance, consequence, and attribute measures condense multidimensional resilience into single figures useful for tracking and comparison. Use them for communication and trend monitoring; do not let a composite substitute for the underlying independent metrics, and where aggregation is unavoidable, weight components dynamically by event type and contingency level rather than freezing a single weighting for all hazards.
9. Data Foundations
Every metric above is only as good as its data. A serious resilience program inventories and integrates several data classes: utility outage records (time-stamped outage and restoration events with cause codes for transmission and distribution), national and regional outage aggregation platforms and regulatory event reporting, standardized transmission and generation availability databases, detailed weather station observations, numerical weather prediction and extreme-event reanalysis products, and critical-infrastructure geospatial layers. Distribution programs add outage management system and AMI data; transmission programs add SCADA and synchrophasor archives.
Data quality determines credibility. Cleansing workflows must reconcile timestamps across systems, filter planned outages from forced outages, de-duplicate cascaded records, validate customer counts, and align hazard observations spatially and temporally with outage records. Privacy and security constraints customer-level data, critical infrastructure information must be engineered into the pipeline from the start, not patched in before a filing. In our experience, data preparation is sixty to seventy percent of the effort in a first-time resilience benchmarking engagement, and it is effort that pays permanent dividends: once the event-extraction pipeline exists, every subsequent storm season updates the metrics nearly for free.
10. What a Credible Resilience Framework Must Include
Surveying the existing landscape of resilience tools and frameworks community-resilience GIS platforms, adaptation toolkits, investment rating systems, federal grant metrics frameworks, and laboratory assessment methodologies reveals consistent gaps when they are applied to power systems: limited treatment of cross-sector interdependencies, weak quantitative handling of equity and vulnerable populations, static indicators that cannot track evolving threats, insufficient representation of power system technical complexity, and a general shortage of quantitative, event-driven metrics grounded in operational data. A framework fit for purpose must therefore encompass:
- Grid performance evaluation. Dynamic performance characterization across the full event lifecycle pre-event preparedness indicators, event-phase degradation profiles, and post-event recovery metrics supporting both pre-event estimation and post-event assessment.
- Dynamic and adaptive metrics. Metrics that update with system conditions and threat evolution, scale from feeders to bulk systems, and normalize across urban and rural contexts for meaningful comparison.
- Cross-sector interdependencies. Explicit quantification of cascading effects between the power system and water, transportation, communications, and fuel infrastructure.
- Socio-equity dimensions. Metrics capturing disproportionate outage impacts on disadvantaged and vulnerable populations, integrated into planning and investment prioritization rather than appended to it.
- Power-system technical complexity. Renewable and inverter-based resource behavior, protection performance, cyber-physical threat surfaces, and hardening measure effectiveness represented at engineering depth.
Institutionally, resilience must be integrated across three time horizons: long-term planning (climate-informed vulnerability assessment of future grid configurations, flexible and DER-ready designs, redundant communications), operational planning (dynamic contingency plans, forecasting and early-warning systems, scenario stress-testing, pre-positioned resources), and real-time operation (situational awareness, adaptive protection, coordinated transmission-distribution restoration). Utilities, large industrial and data-center loads, governments, and standards bodies each carry distinct responsibilities in that structure and the interconnection interface between them is where resilience requirements most often get lost.
11. The Keentel View: Resilience Is an Interconnection-Grade Design Input
Keentel Engineering's core conviction is that grid interconnection is a first-order design input, not a downstream utility formality. Resilience belongs in exactly the same category. The moment a project is conceived a utility-scale solar plant, a battery system, a data center, a transmission line, a substation its contribution to and dependence on system resilience is being determined by design choices: point of interconnection selection, redundancy and sectionalizing architecture, ride-through and protection settings, islanding capability, black-start and restoration roles, structural hardening class, and the contractual definition of critical load.
Treated early, these choices cost little and compound. Treated late, they surface as interconnection restudies, compliance findings, storm-season failures, and rate-case rejections. The metrics framework in this article is how the early treatment becomes rigorous: it gives developers, utilities, and large loads a shared quantitative language for what resilience is worth, what it costs, and which investments actually move it.
Case Study
Case Study 1 Resilience Valuation of a Utility-Scale BESS for a Storm-Exposed Coastal Utility
Background
A coastal investor-owned utility serving a mixed residential, commercial, and light-industrial territory faced recurring multi-day distribution outages from named-storm events. The utility had contracted a 120 MW / 480 MWh battery energy storage system connected at a 115 kV substation serving several vulnerable feeders, justified initially on energy arbitrage and capacity value. Ahead of a rate proceeding, the utility needed to quantify defensibly the resilience value the storage asset contributed, so that resilience benefits could be represented alongside conventional adequacy value in the regulatory record.
The Challenge
Conventional effective load carrying capability analysis credited the battery under normal peak conditions but said nothing about its performance during the storm events that motivated ratepayer concern. Standard-issue VoLL figures — calibrated on short interruptions — were indefensible for the three-to-six-day restoration windows in the utility's own storm history. And the utility's prior resilience narrative was qualitative, which the commission staff had explicitly flagged as insufficient in the previous cycle.
Keentel's Approach
Event baseline. Extracted resilience events from nine years of the utility's outage management records, grouping forced outages by temporal clustering and duration overlap, and constructed customer-tracked performance curves for every major event.
- Scenario construction. Built a probability-weighted scenario set of storm events characterized by intensity, footprint, duration, and restoration trajectory, calibrated against the utility's own area outage rate behavior versus recorded wind speed.
- Resilience-adjusted capacity analysis. Simulated each scenario with and without the BESS providing localized supply to sectionalized feeder segments, critical-facility support, and accelerated cold-load pickup during restoration. Baseline expected energy not served across the weighted scenario set was 940 MWh per representative severe event; with the BESS dispatching under the developed resilience operating strategy, this fell to 610 MWh a probability-weighted fractional reduction of 0.35, the asset's resilience-adjusted capacity value.
- Duration-aware monetization. Replaced flat VoLL with duration-dependent customer damage functions by customer class, reflecting the strongly nonlinear cost growth of multi-day outages refrigeration losses, business interruption, and critical-facility backup fuel exhaustion and computed avoided outage cost per scenario and in probability-weighted annual terms.
- Regulatory-grade documentation. Documented every assumption scenario probabilities, dispatch strategy, damage-function sources, discounting in a traceable engineering basis suitable for discovery and cross-examination.
Outcome
The analysis established an annualized resilience avoided-cost value for the BESS equal to roughly 1.8 times its previously credited adequacy-only value, transforming the asset's regulatory narrative from an arbitrage project with a resilience footnote into a quantified resilience resource. The commission accepted the methodology framework, and the utility adopted the event-extraction pipeline as a standing capability every subsequent storm season now updates the metrics automatically. The resilience operating strategy developed for the study was also folded into the plant's actual emergency dispatch procedures.
| Parameter | Detail |
|---|---|
| Asset | 120 MW / 480 MWh lithium-ion BESS, 115 kV interconnection |
| Hazard class | Named tropical storms; multi-day distribution restoration |
| Core methods | Event extraction, performance curves, probability-weighted storm scenarios, resilience-adjusted capacity value, duration-dependent customer damage functions |
| Headline result | Resilience-adjusted capacity value of 0.35; annualized resilience value ≈ 1.8× adequacy-only credit |
| Decision supported | Rate-case representation of storage resilience benefits; emergency dispatch strategy |
Case Study 2 — Transmission Corridor Hardening: A Regulator-Ready Cost-Benefit Case Built from Recorded Outage Data
Background
A transmission owner operating several hundred miles of 230 kV and 138 kV lines through terrain exposed to severe wind and wet-snow icing faced a familiar dilemma: engineering judgment said certain corridors needed structural hardening and anti-icing measures, but the capital request had twice failed to clear internal investment review because the benefit case rested on qualitative risk language rather than quantified resilience improvement.
The Challenge
The owner held fifteen years of minute-resolution forced-outage records and regional weather station data, but had never converted them into event-level resilience metrics. Candidate investments — structure replacement on two corridors, anti-torsional devices to prevent wet-snow accretion, and an expanded emergency spare-structure program competed for a fixed budget with no common quantitative yardstick. And because the heaviest historical events dominated total impact, ordinary expected-value analysis was unstable: the benefit estimate swung wildly depending on whether one or two extreme winters were included in the sample.
Keentel's Approach
- Event metrics from recorded data. Grouped fifteen years of forced outages into resilience events by start-time clustering and duration overlap; computed event size, MVA-tracked performance curve areas, nadirs, and time-to-95%-restoration for every event, deliberately avoiding full-restoration times whose final stragglers made statistics unusable.
- Statistical vulnerability baseline. Constructed area outage rate curves relating observed corridor outage rates to measured wind speed and icing-proxy conditions, establishing the empirical stress-response baseline of the system as built.
- Analytical fragility modeling. Developed component fragility models for existing and hardened structure classes and for conductors with and without anti-torsional devices, expressing each candidate investment as a quantified change in failure probability versus hazard intensity — including the increase in failure return period delivered by each measure.
- Rerun-history benefit quantification. Applied the engineering-predicted outage-rate reductions retrospectively to the recorded event history — rerunning history — to compute how each historical event's MVA-hours, restoration percentile times, and customer impact would have changed had each investment been in place. Presented corridor-by-corridor, this became the emotional and analytical core of the filing: benefits expressed against storms the service territory remembered.
- Heavy-tail-aware portfolio optimization. Characterized large-event cost risk with exceedance curves; the observed tail was heavy enough that expected-value optimization was formally invalid, so the portfolio was optimized against exceedance-frequency reduction and log-domain severity metrics instead, with a risk-based selection of the investment mix across hardening and restoration-improvement measures.
Outcome
The recommended portfolio full hardening on one corridor, anti-icing devices on two others, and a doubled emergency spare-structure and crew pre-staging program in place of the second corridor rebuild delivered approximately 85% of the maximum modeled resilience benefit at 60% of the original capital request. Rerun-history analysis showed the portfolio would have reduced the worst recorded winter event's unsupplied MVA-hours by roughly half and cut time-to-95%-restoration from eleven days to five. The investment cleared internal review on first submission and anchored the owner's subsequent resilience plan filing, with the event-metrics pipeline retained as the standing measurement basis for post-investment verification.
| Parameter | Detail |
|---|---|
| System | 230 kV / 138 kV transmission corridors, wind and wet-snow icing exposure |
| Data basis | 15 years of minute-resolution forced-outage records + regional weather observations |
| Core methods | Event grouping, MVA performance curves, time-to-95%-restore, area outage rate curves, fragility modeling, rerun-history benefits, exceedance and log-domain risk metrics |
| Headline result | ≈85% of maximum resilience benefit at 60% of original capital; worst-event restoration window cut from 11 days to 5 in rerun-history terms |
| Decision supported | Capital portfolio selection; resilience plan filing; post-investment verification framework |
Case Study 3 — Islandable Community Microgrid: Quantifying Resilience for Critical Infrastructure
Background
A geographically exposed community served by a single sub-transmission supply path — hosting a regional hospital, water treatment plant, emergency operations center, and communications hub — pursued an islandable microgrid combining solar PV, a battery energy storage system, and existing backup generation. The sponsoring authority required a quantified resilience assessment to support grant funding, utility coordination, and the design basis itself: how long must the island sustain, what must it carry, and how would success be measured after commissioning.
The Challenge
Grid-level metrics were useless at this scale, and the community's requirements were heterogeneous: the hospital and water plant needed continuity measured in days, while general load could tolerate managed curtailment. Historical supply-path outage data existed but was sparse — a handful of multi-day events over two decades — so the assessment had to combine the thin event record with scenario modeling rather than pure statistics. The funding application also demanded metrics a non-specialist review panel could interpret.
Keentel's Approach
- Requirement definition from customer damage. Established the community's resilience requirement from the critical-facility side: duration-dependent damage functions for the hospital, water plant, and communications loads defined the cost of inaction as a function of outage duration, revealing that the dominant risk inflection occurred once outages exceeded roughly eight hours — when backup fuel logistics and water storage margins began to bind.
- Tiered critical-load design. Defined a tiered critical-load architecture with quantified continuity targets per tier, and designed the sectionalizing and load-management scheme around those tiers rather than treating the community as a single block.
- Probabilistic islanding-duration metrics. Simulated islanded operation across seasonal solar profiles, storage states of charge, generator availability draws, and multi-day event durations, computing sustainable islanding duration distributions per tier — not a single advertised number, but a probability statement: the fraction of modeled events in which each tier remains served for one, three, and seven days.
- Islanded stability assessment. Assessed islanded power quality and stability — voltage and frequency performance under load steps, motor starts at the water plant, and inverter-generator interaction — establishing the stability component of the resilience metric set and driving control-settings requirements into the design.
- Transition and acceptance metrics. Specified transition metrics — planned and unplanned islanding success rate and transfer time, and resynchronization performance — as commissioning acceptance criteria, so the resilience claims made in the funding application became testable contractual requirements.
Outcome
The final design sustained Tier-1 critical loads for seven days in over 95% of modeled events and full community load for more than 24 hours in the majority of scenarios, at a capital cost roughly 20% below the initial single-block concept — the tiered architecture eliminated storage capacity that had been sized to carry non-critical load through worst-case durations. The funding application succeeded, with reviewers specifically citing the probabilistic islanding-duration presentation. Commissioning tests validated the transition metrics, and the community now maintains the metric set as a living dashboard, re-evaluated as loads grow and resources are added.
| Parameter | Detail |
|---|---|
| System | Community microgrid: solar PV + BESS + backup generation; single sub-transmission supply path |
| Critical loads | Regional hospital, water treatment, emergency operations, communications |
| Core methods | Customer damage functions, tiered critical-load architecture, probabilistic islanding-duration metrics, islanded stability assessment, transition/acceptance metrics |
| Headline result | 7-day Tier-1 continuity in >95% of modeled events at ≈20% lower capital than the single-block concept |
| Decision supported | Grant funding, design basis, commissioning acceptance criteria, ongoing resilience dashboard |
PART IV KEENTEL ENGINEERING SERVICES: Grid Resilience Metrics and Valuation
Keentel Engineering provides end-to-end resilience measurement, valuation, and enhancement engineering for utilities, developers, independent power producers, large loads, and communities. Our resilience practice is built on the same foundation as our interconnection practice: quantitative, standards-aware, data-driven engineering delivered to a regulatory-grade standard of documentation.
Resilience Metrics Development and Baselining
- Extraction of resilience events from utility outage records; construction of outage, restore, and performance processes; computation of the full event metric set including customer-hours, MVA-hours, nadir, and restoration-percentile times.
- Area outage rate curve development relating observed outage rates to measured hazard intensity; cost exceedance and heavy-tail risk characterization with exceedance-frequency and log-domain severity indices.
- Standing metric pipelines that update automatically each storm season, giving utilities a permanent, auditable resilience measurement capability.
Hardening and Investment Cost-Benefit Engineering
- Component fragility modeling for structures, conductors, insulators, and substations against wind, ice, flood, wildfire, and seismic hazards; quantification of failure-return-period improvement per candidate measure.
- Rerun-history benefit quantification — expressing investment benefits against the recorded events a service territory actually experienced — and probability-weighted forward scenario analysis.
- Portfolio optimization across hardening, operational, and restoration-improvement measures; preparation of resilience plan filings, rate-case exhibits, and grant applications with fully traceable engineering bases.
Resilience Valuation for Storage, Renewables, and DERs
- Resilience-adjusted capacity value analysis for BESS, hybrid plants, and DER portfolios across probability-weighted extreme-event scenario sets.
- Duration-dependent customer damage function development by customer class and facility type; defensible multi-day VoLL selection for regulatory proceedings.
- Resilience-informed dispatch and emergency operating strategy development, integrating storage assets into restoration and critical-load support roles.
Microgrid and Critical-Infrastructure Resilience Engineering
- Tiered critical-load architecture and sectionalizing design; probabilistic islanding-duration analysis; islanded stability, protection, and power-quality assessment.
- Transition metrics and commissioning acceptance criteria that convert resilience claims into testable requirements; ongoing resilience dashboards for communities and campuses.
Extreme-Event Simulation and Grid Studies
- EMT (PSCAD) and positive-sequence (PSS®E) simulation of extreme-event scenarios, cascading outage analysis, ride-through and protection performance under degraded conditions, and restoration/black-start studies.
- Interconnection studies that treat resilience as a first-order design input — POI selection, redundancy architecture, ride-through settings, and restoration roles engineered from day one.
Compliance, Planning Integration, and Advisory
- NERC operations and planning compliance engineering aligned with resilience objectives; integration of resilience metrics into long-term planning, operational planning, and real-time operating practice.
- Owner's engineer and independent review services for resilience programs, storm-hardening plans, and post-event assessments.
Work With Keentel Engineering
Whether you are baselining resilience for the first time, defending a hardening investment, valuing a storage asset's resilience contribution, or designing an islandable system around critical loads — Keentel Engineering brings the metrics, the models, and the regulatory-grade documentation to make the case. Offices in Tampa, FL and Austin, TX. Visit keentel.com to start the conversation
PART II ENGINEERING FAQ: Power System Resilience Metrics
Q. What is power system resilience, in one sentence?
Resilience is the ability of a power system to anticipate, absorb, adapt to, and rapidly recover from extraordinary high-impact events — limiting the extent, severity, and duration of degradation while sustaining critical services.
Q. How is resilience different from reliability?
Reliability describes performance under normal conditions and credible contingencies, using long-term averages and strict pass/fail criteria against predefined N-1/N-k contingency lists. Resilience describes performance under extreme, high-impact events that are typically excluded from design criteria; it accepts controlled degraded operation, evaluates the full event timeline including infrastructure damage and restoration, and includes threats, environment, and human response inside the analysis boundary. The two are complementary — resilience extends reliability, it does not replace it.
Q. Why can't we just use SAIDI and SAIFI for resilience?
Because those indices average performance across the year and routinely exclude major event days — the very events resilience is about. They assume independent, statistically stationary failures, carry no information about degradation depth or recovery speed, ignore human and organizational factors, treat all customers identically, and provide no guidance for hardening investment. They remain essential for reliability regulation; they are structurally blind to resilience.
Q. What is a HILP or HILF event?
A high-impact, low-probability (or low-frequency) event: hurricanes, ice storms, wildfires, floods, extreme heat or cold, geomagnetic disturbances, coordinated physical or cyber attacks, and large cascading failures. These events produce correlated, large-scale outages that violate the statistical assumptions behind conventional reliability analysis, which is why they require dedicated metrics and methods.
Q. What are the phases of a resilience event?
Anticipation and preparation before the event (risk identification, hardening, contingency planning); absorption during the initial shock (withstanding damage while maintaining partial operation); adaptation and sustainment through the prolonged disruption (reconfiguration, critical-load prioritization); and recovery (restoration of service and infrastructure to pre-event or improved condition). A complete metric set covers all phases — systems can be strong in one phase and weak in another.
Q. What is a resilience performance curve?
A time-series representation of system functionality through an event. Formally, if O(t) is the cumulative number of outages and R(t) the cumulative number of restorations, the performance curve is P(t) = R(t) − O(t) — it drops with each outage and climbs with each restore. The area between the curve and the time axis quantifies total disruption (outage-hours, MVA-hours, or customer-hours depending on what is tracked), and the nadir quantifies maximum simultaneous impact.
Q. Is the resilience trapezoid the same thing
The trapezoid is the idealized version: a clean degradation phase, a flat degraded plateau, then a recovery phase, with restoration assumed to begin only after damage ends. Real utility data almost never behaves that way — outages and restorations overlap in time, heavily on distribution systems. Decomposing the performance curve into separate outage and restore processes generalizes the trapezoid: every trapezoid metric can still be computed, without the unrealistic phase-separation assumption.
Q. How are individual outages turned into resilience events?
By automated grouping: outages are clustered into events based on temporal proximity of their start times and overlap of their durations. Most events are single outages; the rare largest events contain hundreds. Resilience analysis works at the event level because events — not isolated component failures — are what customers, regulators, and emergency managers experience.
Q. Why use time to 95% restoration instead of full restoration time on transmission systems?
Because transmission redundancy means the last few component restorations are often operationally meaningless and can take arbitrarily long, injecting huge variability into any statistic that depends on them. Anchoring on the time to restore 95% (or 50%/90%) of outages produces stable, comparable restoration metrics.
Q. What data do we need to start measuring resilience?
Usually data you already have: time-stamped forced-outage and restoration records with cause codes (transmission), plus customer counts and locations (distribution), supplemented by weather observations for the same footprint and period. Public aggregation platforms, standardized availability databases, regulatory event reports, and critical-infrastructure geospatial layers round out the picture. The gating factor is rarely data existence — it is data cleansing and event extraction, which is where most first-time effort goes.
Q. What are fragility curves and area outage rate curves?
A fragility curve is a component-level analytical model: the conditional probability a specific asset fails as a function of hazard intensity (wind, ice, flood depth). An area outage rate curve is its system-level statistical counterpart: the observed outage rate of a whole service area as a function of measured stress, derived from historical outage and weather records. Fragility models project the effect of proposed hardening; area curves benchmark the system as it actually is. Rigorous studies use both.
Q. How do we quantify the benefit of a hardening investment before building it?
Two complementary ways. Predictively: modify the fragility models to reflect the hardening, rerun the hazard scenarios, and compare unserved energy, customer-hours, and cost. Retrospectively: "rerun history" — apply the engineering-estimated outage-rate reduction to recorded past events and compute how the historical resilience metrics would have improved had the investment been in place. The retrospective form is often the more persuasive in regulatory settings, because it speaks to events people actually lived through.
Q. What is the Value of Lost Load, and what's the catch for resilience studies?
VoLL is the monetized cost of unserved energy to customers, used to convert outage impact into dollars. The catch: standard VoLL figures are calibrated on interruptions lasting minutes to a day, while resilience events last days to weeks, and outage cost is strongly nonlinear in duration. Using reliability-grade VoLL for a multi-day event materially misprices resilience. Duration-dependent customer damage functions, built by facility type, are the appropriate instrument for extreme events.
Q. What is resilience-adjusted capacity value (resilience-adjusted ELCC)?
An extension of effective load carrying capability into extreme-event conditions. A resource is evaluated across a probability-weighted set of disruptive scenarios, each with its own intensity, duration, and restoration trajectory; the metric is the probability-weighted fractional reduction in expected energy not served that the resource delivers. Multiplying by VoLL and representative event duration converts it into avoided outage cost — letting storage, generation, DERs, and wires-based hardening compete in a single valuation framework.
Q. What does it mean that blackout costs are "heavy-tailed," and why should I care?
Empirical exceedance curves of event customer cost on real distribution systems show log-log tail slopes with magnitude below one — an extremely heavy tail. Practically: there is no "typical" large blackout, large events dominate total risk, and sample means over the tail do not converge with available data. That invalidates expected-value tools, including conditional value-at-risk and expected-cost optimization, for large-blackout risk. The defensible alternatives are exceedance metrics (probability and annual frequency of exceeding a cost threshold) and log-domain indices that average the logarithm of large-event costs.
Q. Which resilience metrics do regulators actually respond to?
Metrics that are computable from recorded data, auditable, and expressible in customer terms: customer-hours lost per event, restoration times to defined percentiles, critical-facility continuity, frequency of large-cost events, and avoided-cost figures with transparent VoLL or damage-function assumptions. Composite indices are useful for communicating trends, but filings are won on the underlying independent metrics and the traceability of the analysis behind them.
Q. Should we aggregate everything into one resilience score?
Generally no. Independent metrics for distinct resilience attributes — robustness, absorption, restoration speed, customer impact, cost — preserve the diagnostic information that drives investment decisions. Where a single score is genuinely required, use dynamic aggregation in which component weights vary with event type and contingency level, and always publish the components alongside the composite.
Q. How do transmission and distribution resilience metrics differ?
Transmission metrics emphasize energy not served in MWh, stability margins, N-k withstand, topological criticality, and cascading exposure, computed from SCADA and synchrophasor data with detailed dynamic models. Distribution metrics emphasize customers interrupted, customer-hours, restoration rates, critical-load continuity, and reconfiguration or islanding capability, computed from outage management and AMI data. A sound framework aligns both on shared dimensions — restoration duration, robustness, recovery slope — so results compare across the hierarchy.
Q. What resilience metrics apply to microgrids and islandable systems?
Sustainable islanding duration under realistic resource and load profiles; fraction of critical and total demand met by local resources; voltage and frequency stability in islanded operation; transition success rate and speed between grid-connected and islanded modes; and the support the system can provide to the wider grid during emergencies. For community systems, these are typically paired with critical-facility continuity metrics for hospitals, water, communications, and shelters.
Q. How do crew and logistics factor into resilience measurement?
Through restoration-effort metrics: crew deployment tracked hourly through an event yields total crew-hours; customer-hours restored per crew-hour measures restoration efficiency; crew-hours per outage restored measures crew effectiveness; and a logarithmic composite of average customer restoration duration and crew-hours per outage gives a single emergency-response efficiency score comparable across events of different sizes. These metrics turn staffing, staging, and mutual-assistance decisions into quantitative questions.
Q. Can existing reliability metrics be adapted for resilience?
Yes, by threshold conditioning: restrict the metric to events exceeding a severity criterion — duration beyond 24 hours, more than a set number of simultaneous outages, or cost above a defined level. Threshold-conditioned load-curtailment and energy-not-served metrics reuse existing data pipelines and institutional familiarity, and are often the fastest route to a defensible resilience baseline.
Q. What role do AI, IoT, and real-time monitoring play?
Machine learning supports failure prediction, vegetation and asset risk scoring, damage forecasting ahead of storms, and restoration optimization. Dense IoT sensing and synchronized measurements raise system observability, enabling real-time resilience metric evaluation during events rather than only post-event reconstruction. These technologies strengthen every lifecycle phase — but they inherit the data-quality and cyber-security obligations that come with expanded digital surface area.
Q. Where should a utility or developer start?
With a baseline: extract resilience events from the last five to ten years of outage records, compute the core event metrics (size, customer-hours, restoration percentile times, nadir), build the cost exceedance curve, and identify the two or three hazard types that dominate the tail. That baseline scopes everything downstream — which hardening options to model, which scenarios to simulate, and what a credible avoided-cost case looks like. It is typically a focused engineering effort measured in weeks, not a multi-year program.

About the Author:
Sandip "Sonny" R. Patel, P.E.
IEEE Senior Member · Founder & CEO, Keentel Engineering
In 1995, Sonny Patel earned his Electrical Engineering degree from the University of Illinois. But degrees don't build legacies — action does.
For three decades, he has worked the power industry from every side of the table: 16 years as a utility engineer at Exelon/Commonwealth Edison; generation leadership across hydroelectric, industrial steam turbine, and a 9 GW renewable fleet; NERC Regional Entity Senior Compliance Engineer and Audit Team Lead, auditing some of the nation's largest utilities; and testing and commissioning lead on equipment up to 765 kV — the very top of the North American grid.Utility. Generator. Regulator. Consultant. Few engineers have seen all four seats. Fewer still have sat in them.
His experience spans nuclear, hydro, conventional generation, renewables, oil and gas, mining — and today's data centers, where he is authoring a three-book series on data center design. He is a Licensed Professional Engineer in six states and a Licensed Electrical Contractor in Florida (Unlimited EC) — he doesn't just design the work; he's qualified to stand behind its execution.Today, as Founder and CEO of Keentel Engineering, Sonny leads a nationwide team of engineers delivering substation design, power system studies, NERC compliance, and commissioning — done right, coast to coast.Three decades. Every side of the table. One standard: accountable engineering.
Services

Let's Discuss Your Project
Let's book a call to discuss your electrical engineering project that we can help you with.
About the Author:
Sandip "Sonny" R. Patel, P.E.
IEEE Senior Member · Founder & CEO, Keentel Engineering
In 1995, Sonny Patel earned his Electrical Engineering degree from the University of Illinois. But degrees don't build legacies — action does.
For three decades, he has worked the power industry from every side of the table: 16 years as a utility engineer at Exelon/Commonwealth Edison; generation leadership across hydroelectric, industrial steam turbine, and a 9 GW renewable fleet; NERC Regional Entity Senior Compliance Engineer and Audit Team Lead, auditing some of the nation's largest utilities; and testing and commissioning lead on equipment up to 765 kV — the very top of the North American grid.
Utility. Generator. Regulator. Consultant. Few engineers have seen all four seats. Fewer still have sat in them.
His experience spans nuclear, hydro, conventional generation, renewables, oil and gas, mining — and today's data centers, where he is authoring a three-book series on data center design. He is a Licensed Professional Engineer in six states and a Licensed Electrical Contractor in Florida (Unlimited EC) — he doesn't just design the work; he's qualified to stand behind its execution.
Today, as Founder and CEO of Keentel Engineering, Sonny leads a nationwide team of engineers delivering substation design, power system studies, NERC compliance, and commissioning — done right, coast to coast.Three decades. Every side of the table. One standard: accountable engineering.
Leave a Comment
Thank you for contacting us.
We will get back to you as soon as possible.
We will get back to you as soon as possible.
Oops, there was an error sending your message.
Please try again later.
Please try again later.
Related Posts
By SANDIP R PATEL
•
October 3, 2026
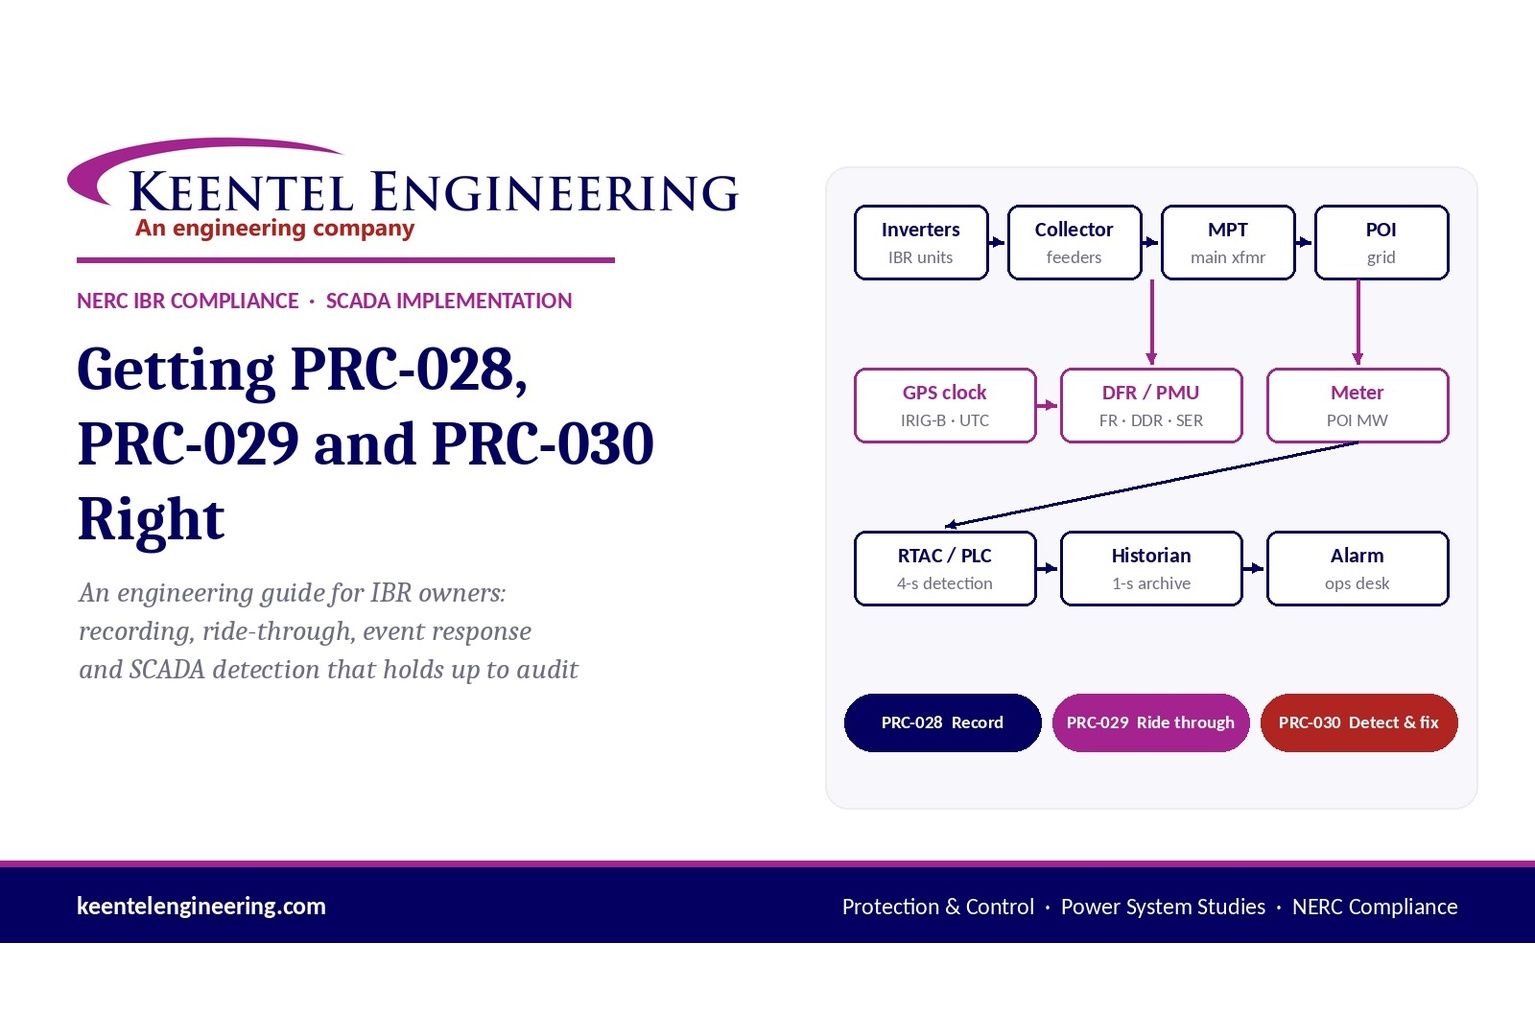
Engineering guide to PRC-028 disturbance recording, PRC-029 ride-through and PRC-030 event detection for inverter-based resources.
By SANDIP R PATEL
•
October 3, 2026
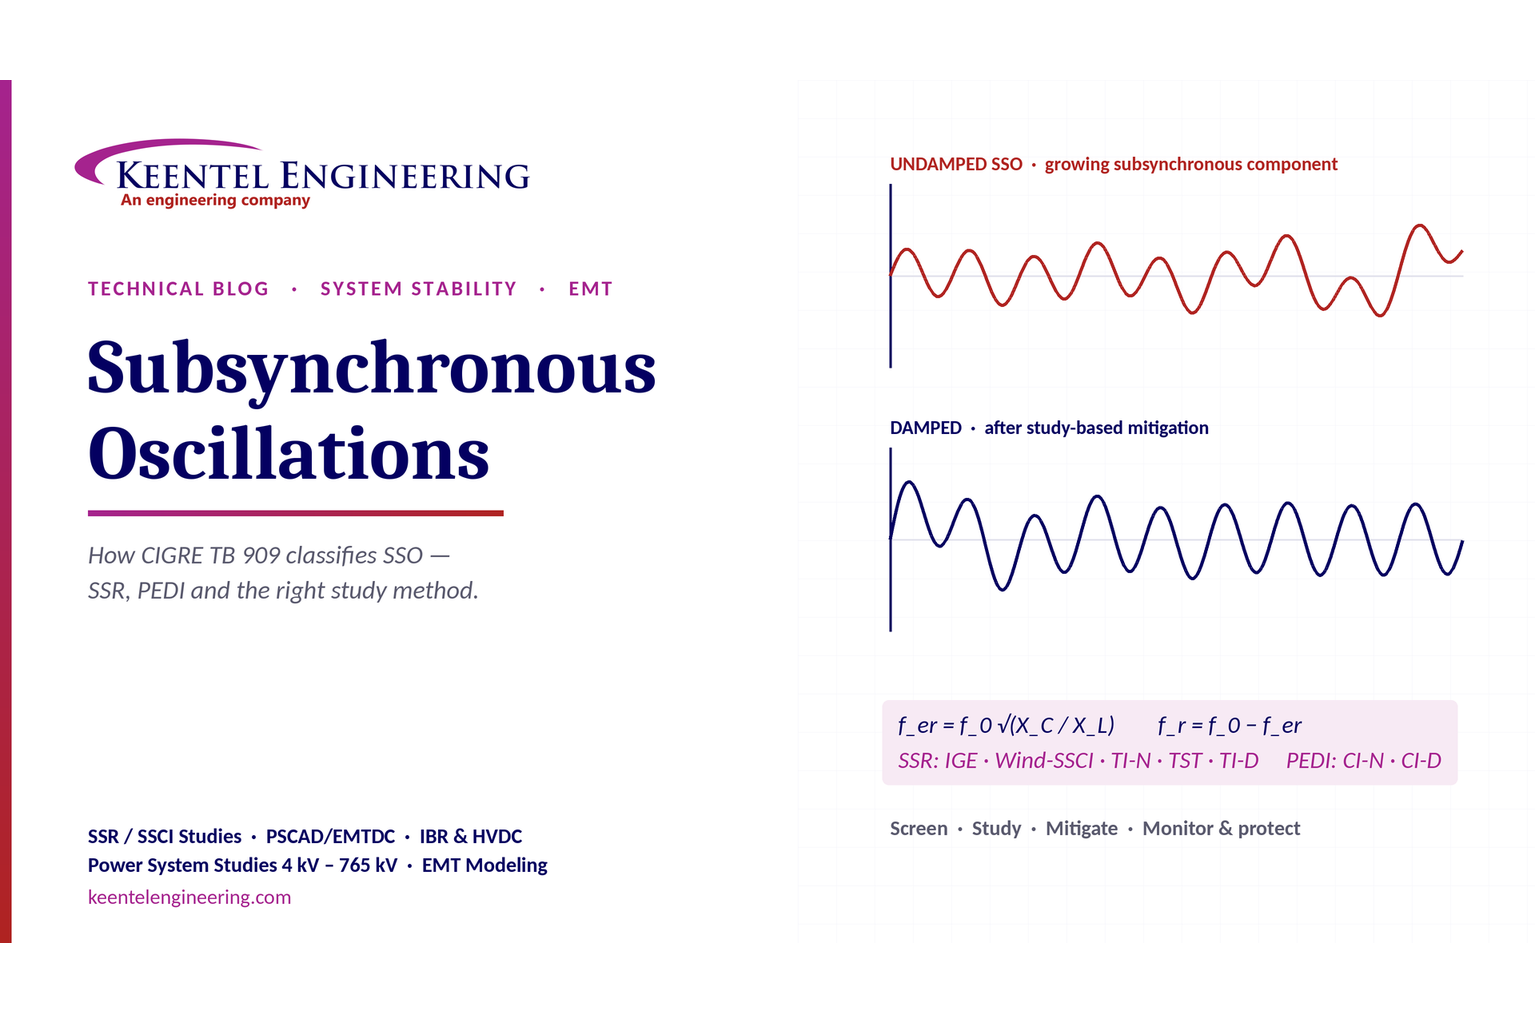
A practical guide to SSO classification, SSR, PEDI, Wind-SSCI, EMT analysis, mitigation and protection based on CIGRE TB 909.
By SANDIP R PATEL
•
October 3, 2026
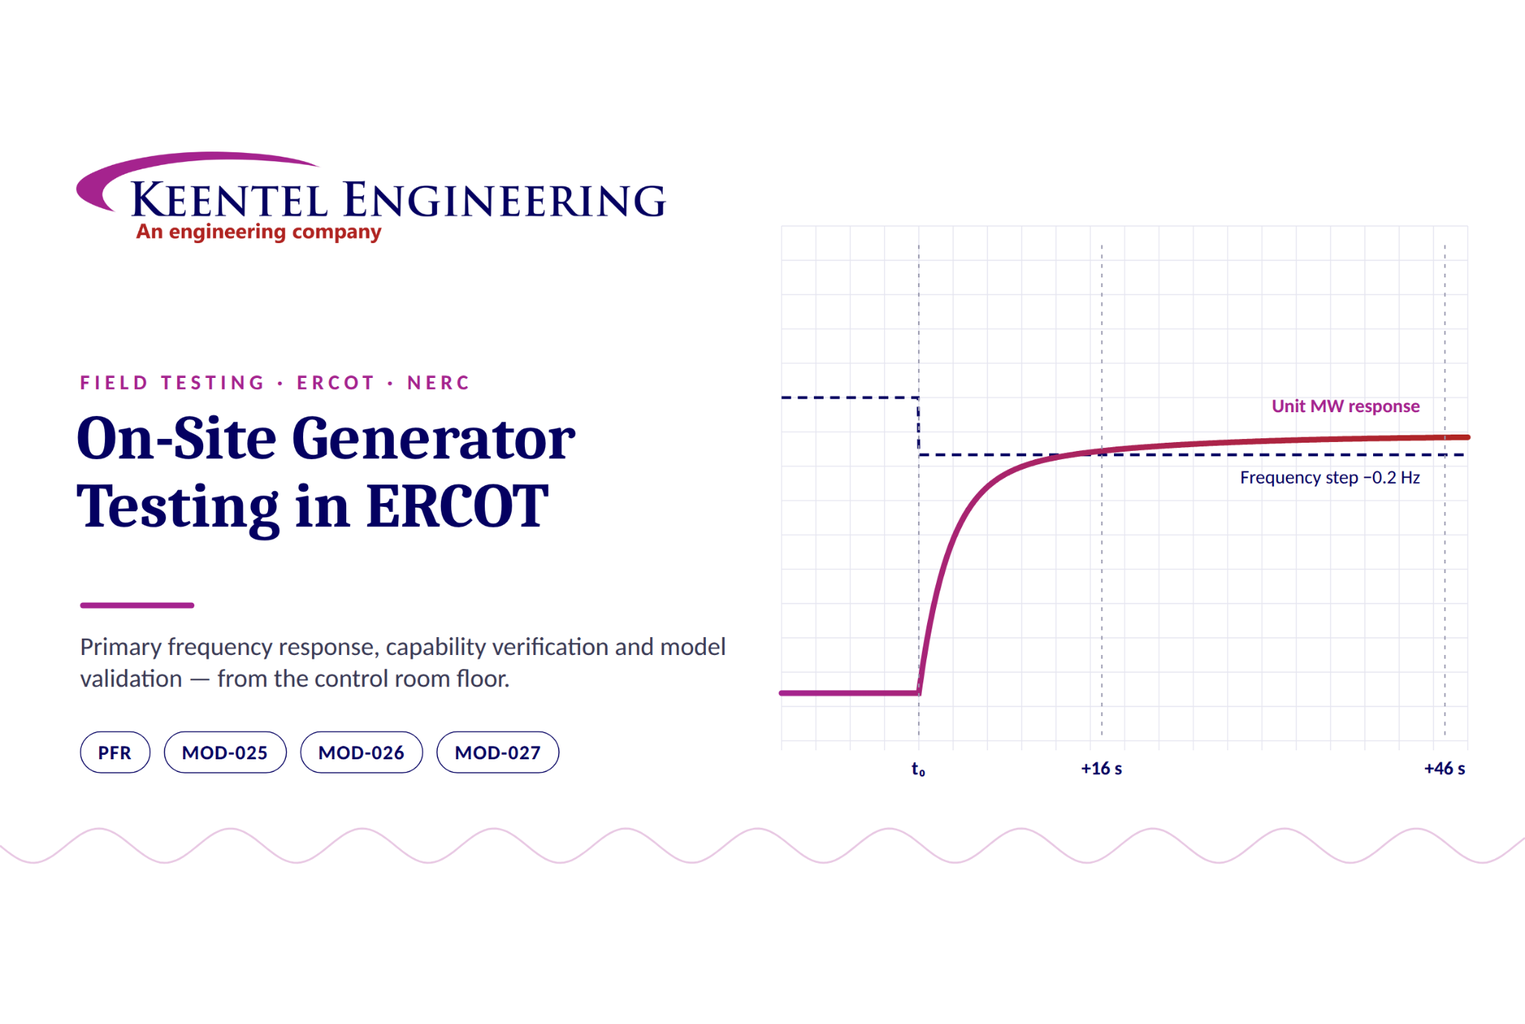
Learn ERCOT generator testing for PFR, MOD-025 and MOD-026/027, including staged tests, capability verification, dynamic models and field testing.
By SANDIP R PATEL
•
October 3, 2026
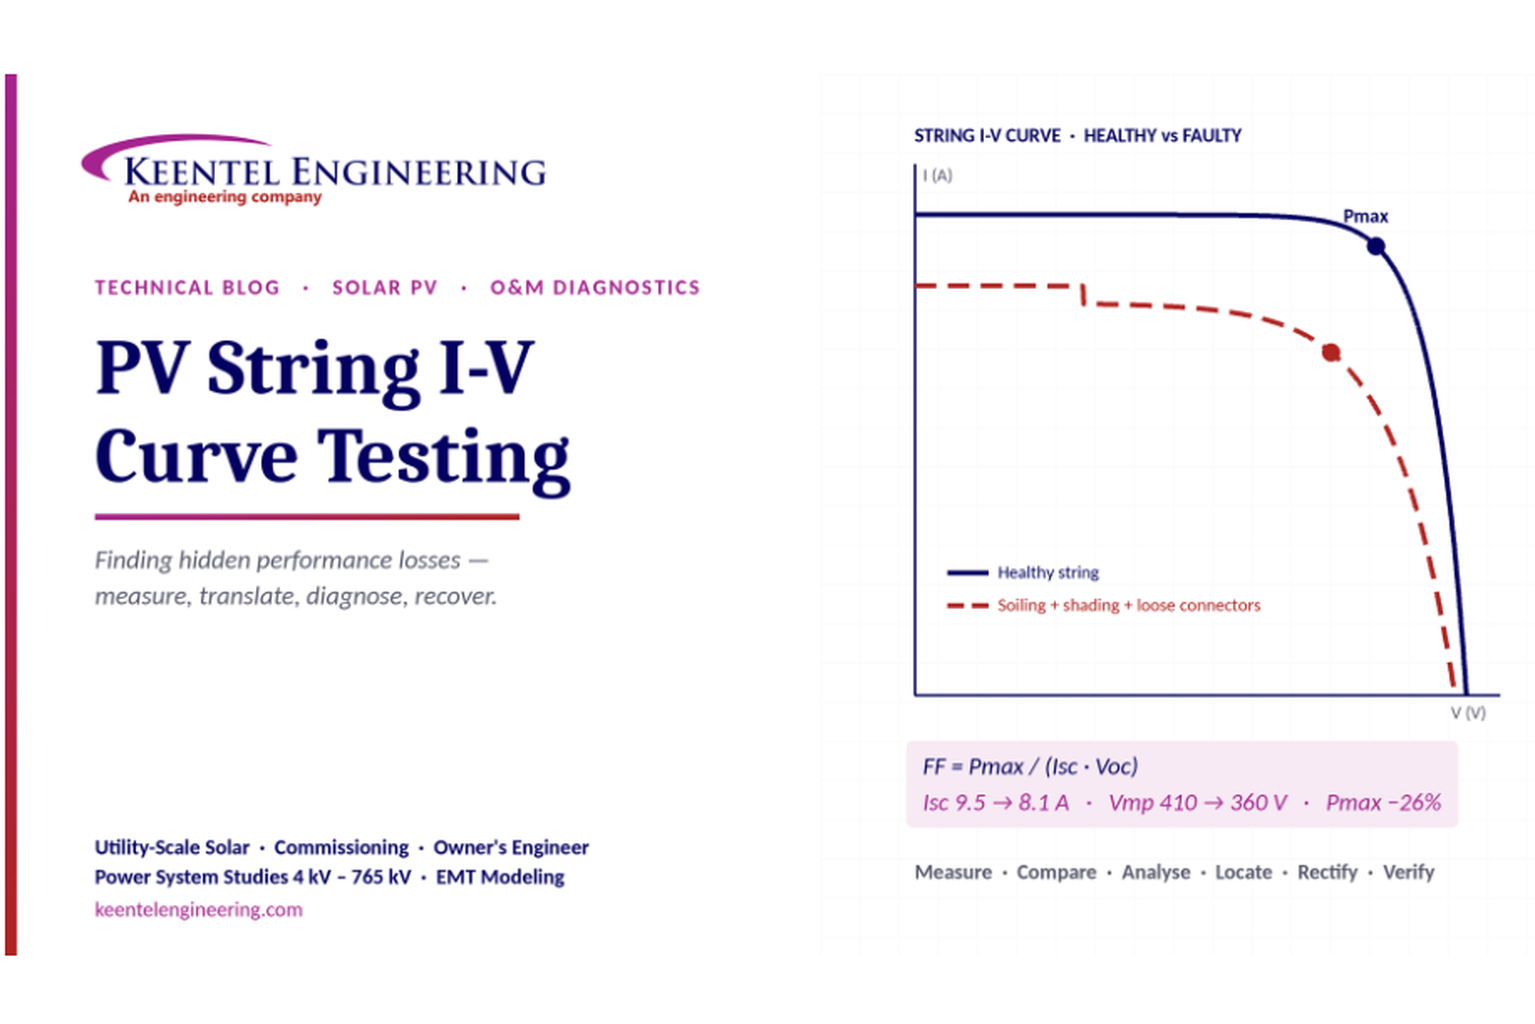
Learn how PV string I-V curve testing identifies hidden solar performance losses, including soiling, shading, mismatch, degradation, and wiring faults.
By SANDIP R PATEL
•
October 3, 2026
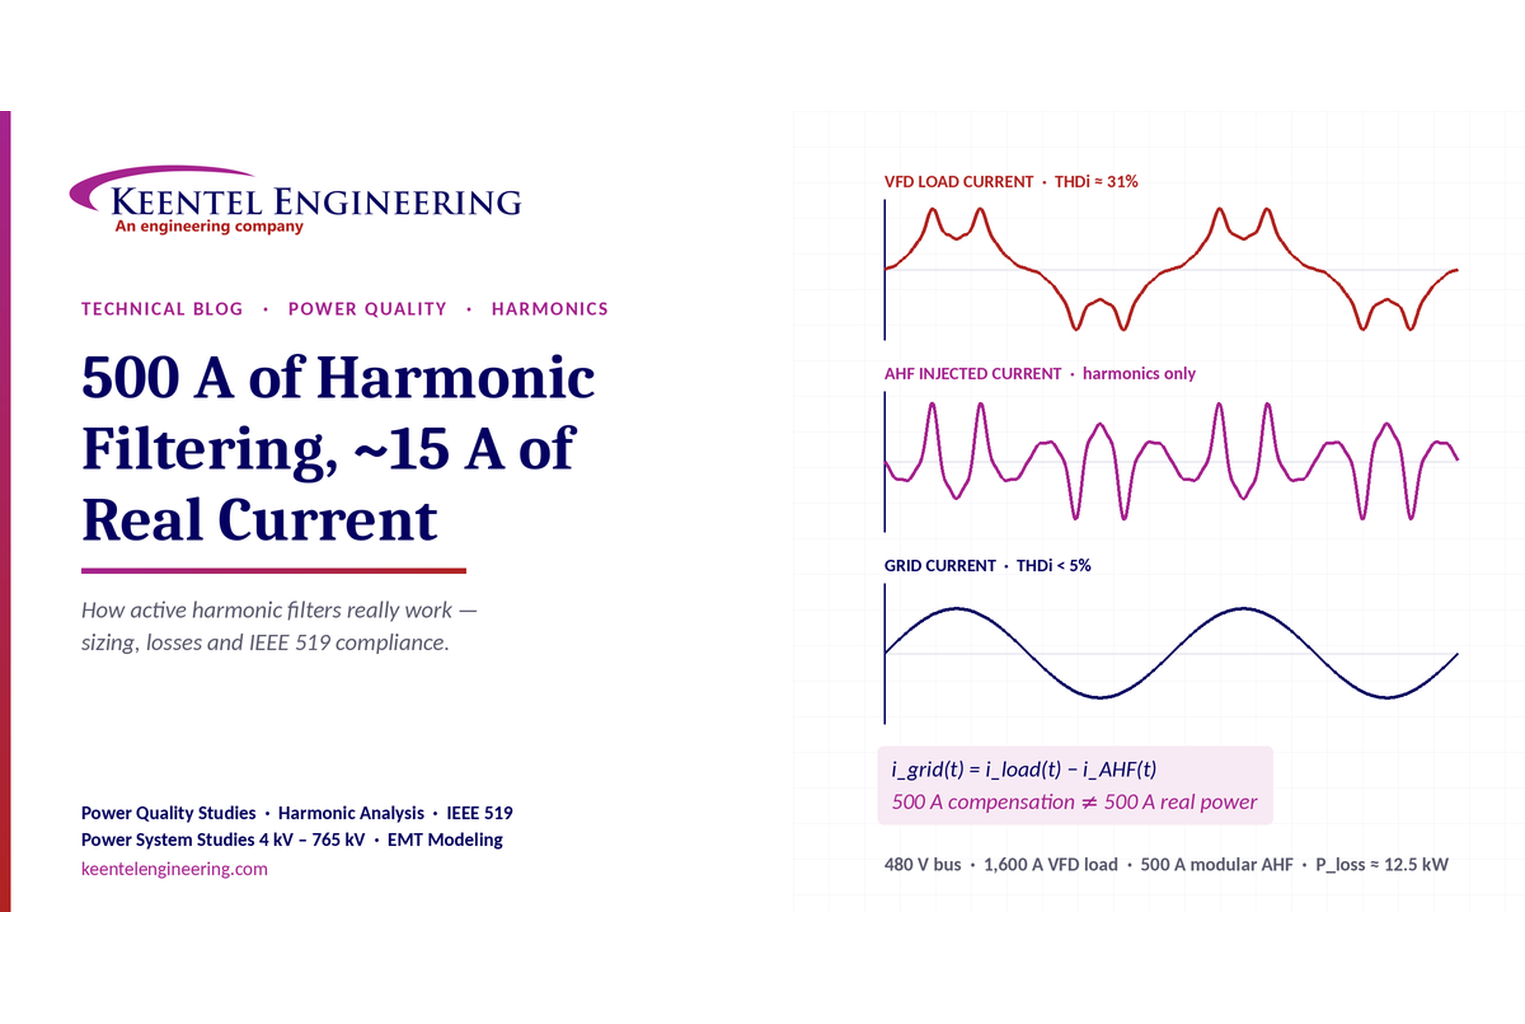
Learn how active harmonic filters work, how to size AHF systems, reduce VFD harmonics, calculate losses, and meet IEEE 519 TDD limits at the PCC.
By SANDIP R PATEL
•
October 3, 2026
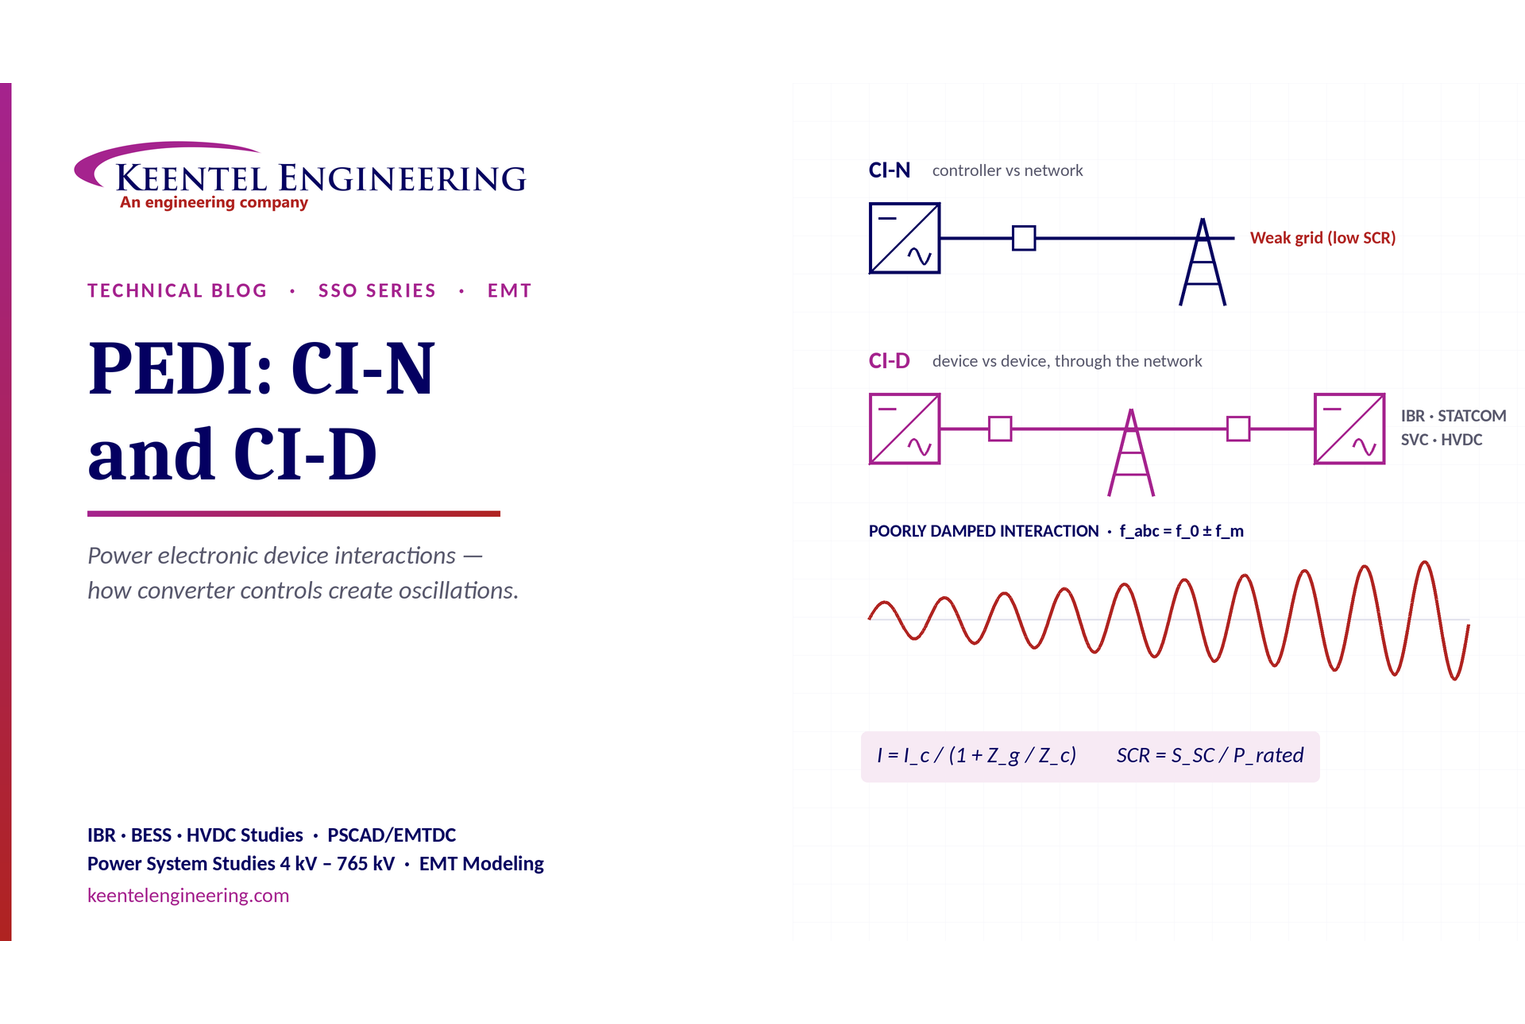
Learn power electronic device interactions (PEDI), including CI-N and CI-D, weak-grid stability, SCR, EMT studies, impedance analysis and mitigation for IBRs.
By SANDIP R PATEL
•
October 3, 2026
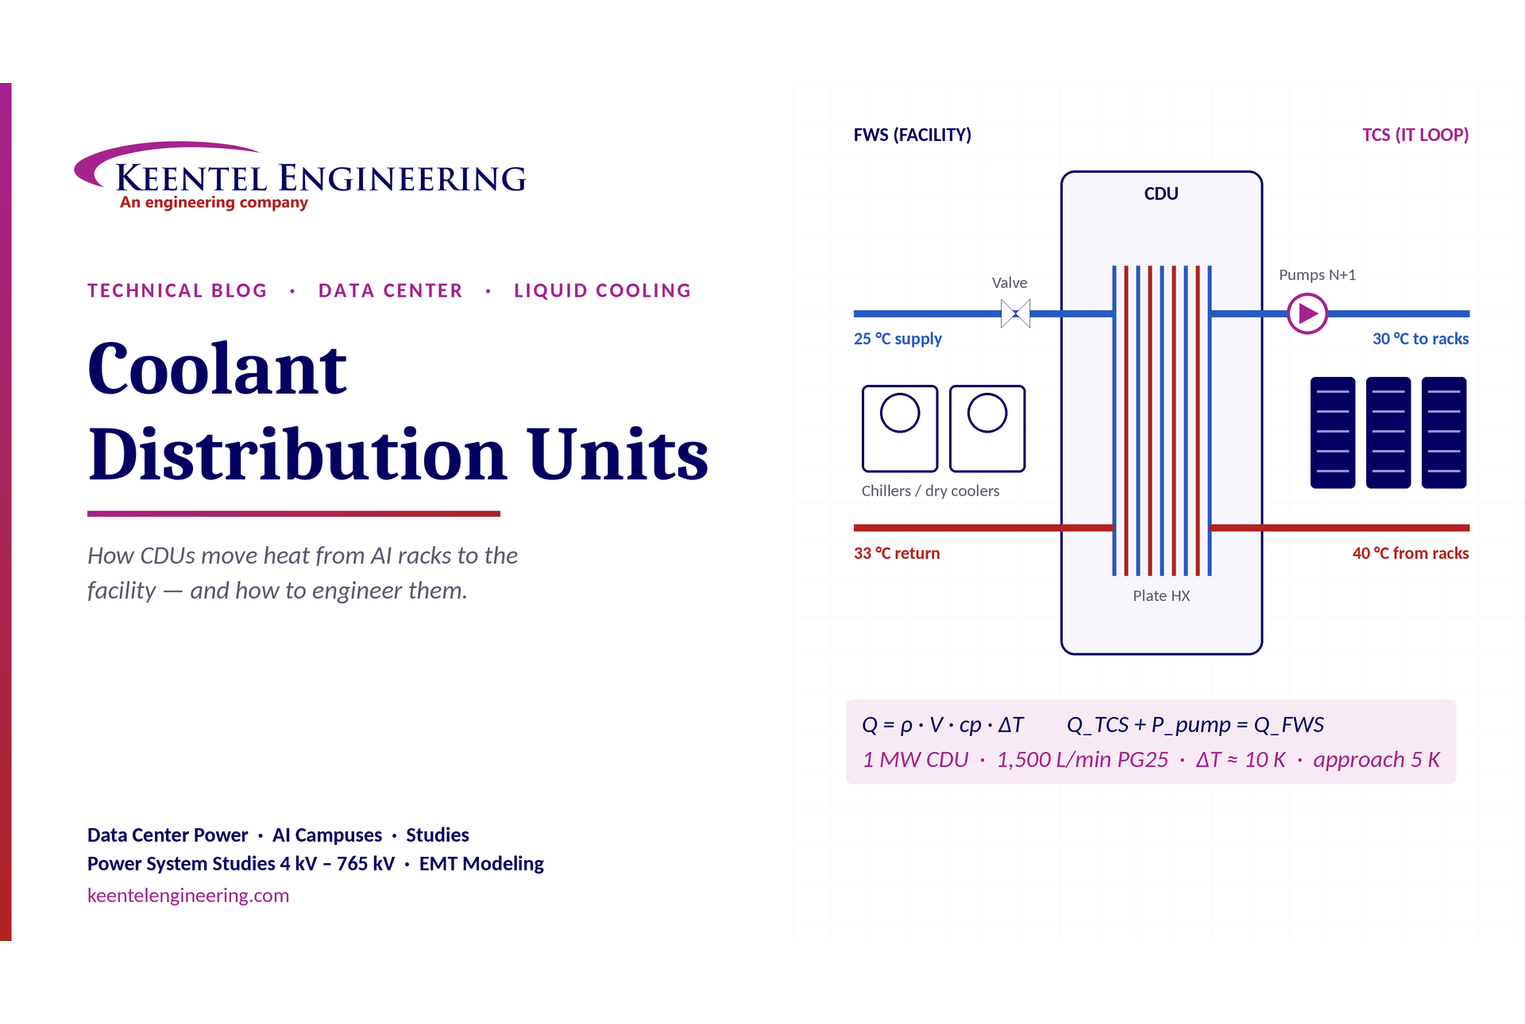
Learn how data center coolant distribution units (CDUs) work, including FWS and TCS loops, heat transfer, sizing, redundancy and liquid cooling for AI data centers.
By SANDIP R PATEL
•
October 3, 2026
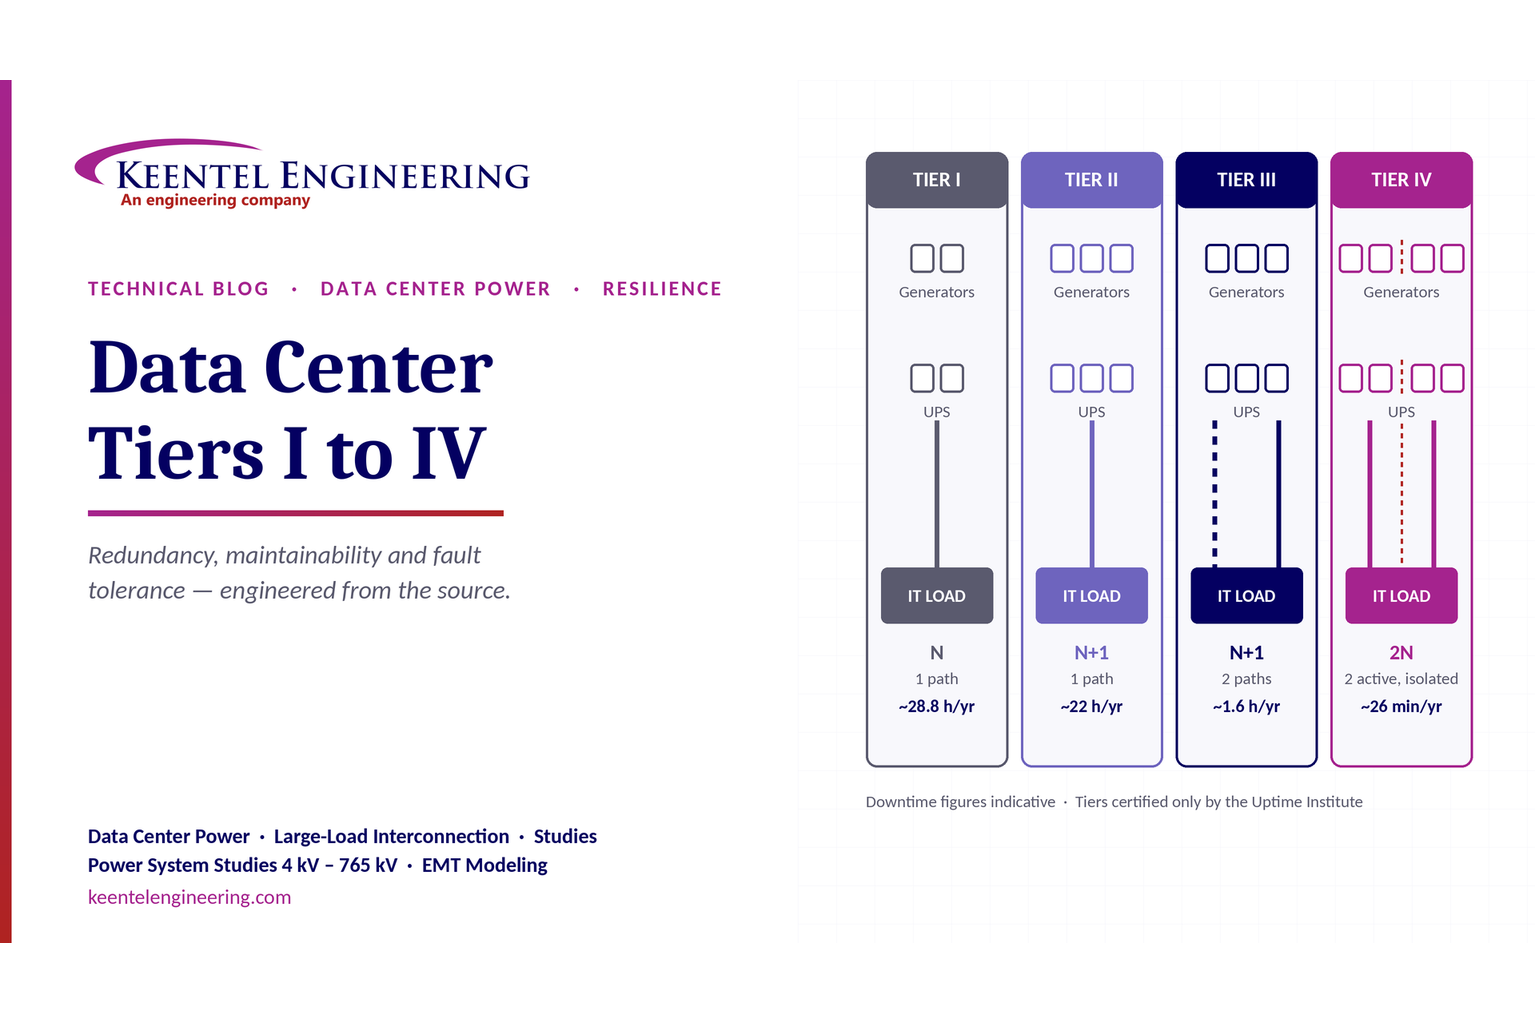
Compare Data Center Tiers I–IV, including redundancy, uptime, Tier III concurrent maintainability, Tier IV fault tolerance, UPS, generators and power design.
By SANDIP R PATEL
•
October 3, 2026
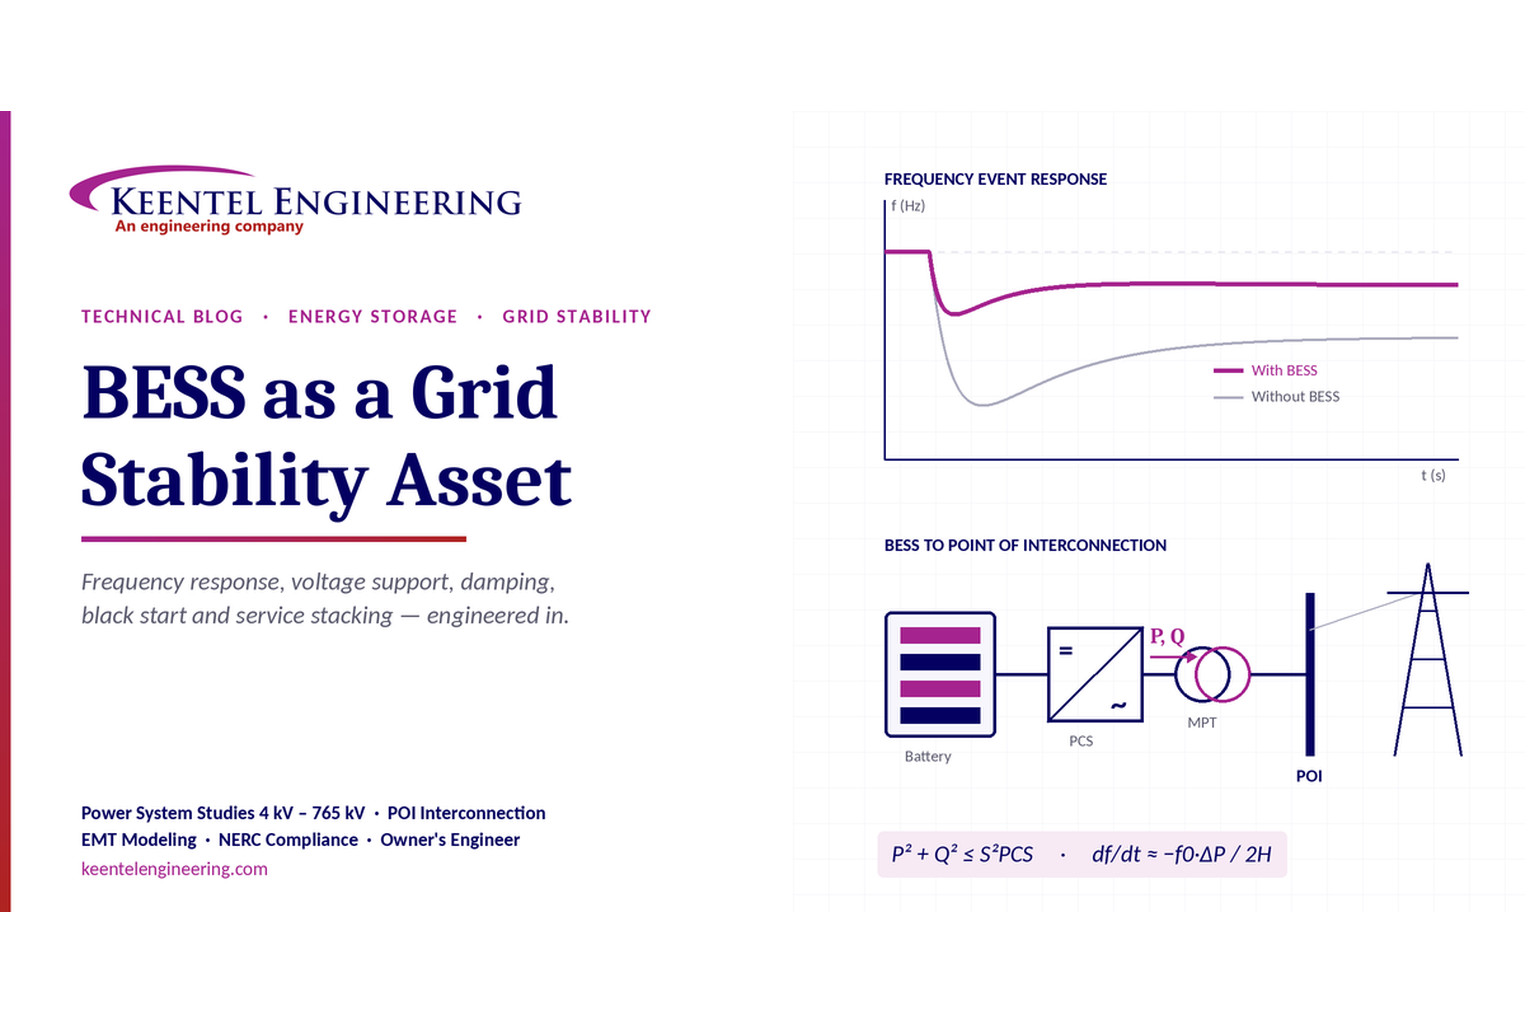
Learn how BESS supports grid stability through fast frequency response, voltage support, oscillation damping, black start, grid-forming controls and EMT studies.





