Part A — PRC-030-1 at a Glance
On October 1, 2026, NERC Reliability Standard PRC-030-1, Unexpected Inverter-Based Resource Event Mitigation, became enforceable for Generator Owners of Bulk Electric System (BES) inverter-based resources (IBRs). Applicable non-BES IBRs follow on January 1, 2027. Solar, wind and battery storage owners now have a mandatory, clock-driven obligation: when a plant's output changes unexpectedly, they must find the change, explain it, decide whether to fix it, and prove that the fix was carried through.
The standard is short — four requirements — but each requirement rests on engineering. The owner must define a detection algorithm that resolves a four-second change in megawatts. It must run root-cause analysis on inverter, plant controller and protection behavior. It must assess ride-through and reactive power performance. And it must judge whether the same root cause exists at every other plant in its fleet. This guide explains how to do that work and how to make it hold up at audit.
PRC-030-1 in one table
| Requirement | What the Generator Owner must do | Clock | Who receives it |
|---|---|---|---|
| R1 | Implement a documented process to identify any complete facility loss of output, or any change in Real Power of at least 20 MW and at least 10% of gross nameplate rating within 4 seconds, excluding four defined causes | Continuous | Internal (evidence for audit) |
| R2 | Analyze each identified event, or each event an RC, BA or TOP asks about: root cause, ride-through and reactive response, performance issues and need for correction, and applicability to the owner's other IBRs | 90 calendar days from the event or the request | Results to the requesting entity on request |
| R3 | If corrective action is needed, develop a Corrective Action Plan (CAP) or a technical justification for not acting | 60 calendar days from completing the R2 analysis | Associated RC, BA and TOP |
| R4 | Implement each CAP, update it when actions or timetables change, and notify the RC of changes and completion | Until complete | Associated RC |
All four requirements carry a Medium Violation Risk Factor. Evidence must generally be retained for 36 calendar months after each requirement or CAP is completed.
Key dates
| Item | Date | Basis |
|---|---|---|
| FERC approval of PRC-030-1 (with PRC-028-1, PRC-002-5 and the IBR definition) | February 20, 2025 | FERC letter order |
| FERC approval of PRC-029-1 and PRC-024-4 (Order No. 909) | July 24, 2025 | FERC order |
| Effective date and compliance date for BES IBRs | October 1, 2026 | Later of the first quarter 12 months after each order |
| Compliance date for applicable non-BES IBRs | January 1, 2027 | Later of January 1, 2027 or the effective date |
What Keentel's analysis shows
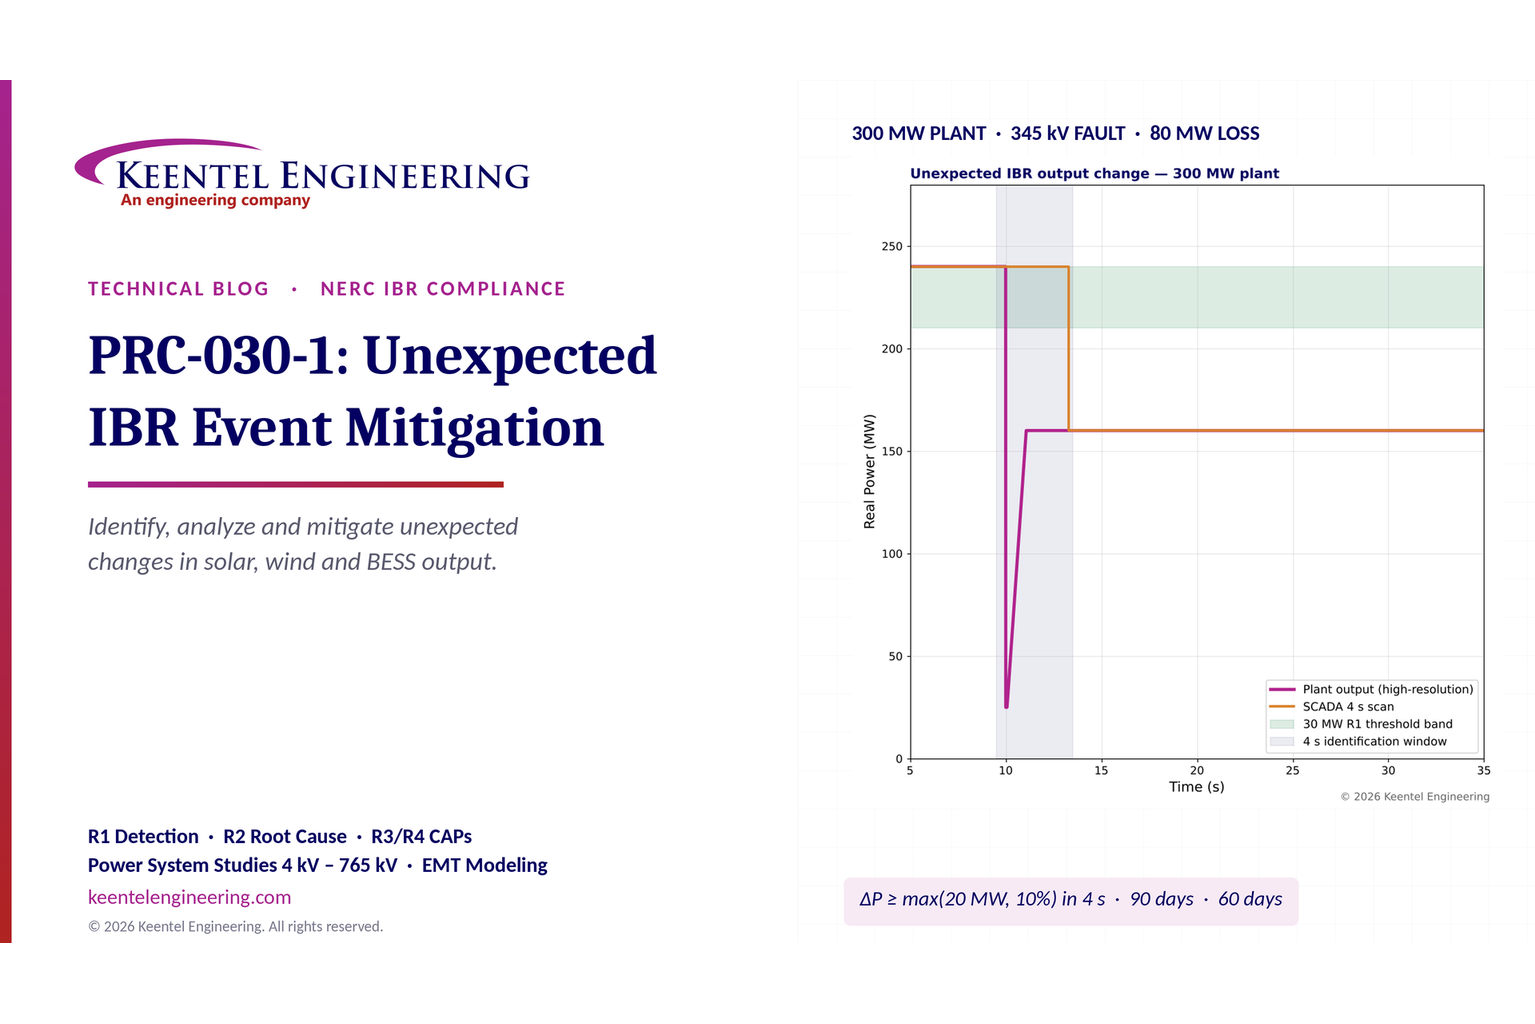
Keentel Engineering modeled a typical event: a 300 MW solar plant producing 240 MW when a 345 kV line fault is cleared in four cycles. During the fault, legacy inverters enter momentary cessation. On fault clearing, a brief 1.17 pu overvoltage trips 40 of 120 inverters on an instantaneous AC overvoltage setting.
| Quantity | Value |
|---|---|
| R1 threshold for a 300 MW plant | max(20 MW, 30 MW) = 30 MW |
| Momentary dip during the fault (high-resolution data) | 240 → 25 MW (215 MW), recovered within about 1 s |
| Sustained loss after the inverter trips | 80 MW (27% of nameplate) — qualifies under R1 |
| What a 4-second SCADA historian sees | Only the 80 MW step; the 215 MW momentary dip is invisible |
| Probability a 3-second ramp is captured in a single 4-second scan difference | 25% |
| R2 due (event November 2, 2026) | January 31, 2027 |
| R3 due (R2 completed January 16, 2027) | March 17, 2027 |

Five lessons
R1 is a measurement problem before it is a paperwork problem. Your detection process can only identify what your data can resolve. A 4-second scan can split a ramp across two samples or miss a momentary dip entirely.
The threshold is the larger of two numbers. Up to 200 MW of gross nameplate, 20 MW governs; above 200 MW, 10% governs. Complete losses must be identified regardless of size.
Clocks are per event, not per investigation. Ninety days for analysis, then sixty days for a CAP or technical justification. Bundled investigations must still meet the earliest event's deadline.
R3 has three recipients. A CAP sent to the RC but not the BA and TOP is a violation at the High VSL level.
Root cause is a fleet question. Part 2.1.4 requires an extent-of-condition review across every other IBR the owner holds. Same inverter, same firmware, same controller — same risk.
Engineering review of common statements about PRC-030-1
| Statement often made | Keentel's check |
|---|---|
| "PRC-030-1 is a future obligation." | No longer. As of October 1, 2026, it is enforceable for BES IBRs. Non-BES IBRs meeting the 20 MVA / 60 kV criteria comply from January 1, 2027. |
| "The threshold is 20 MW or 10%." | Incorrect. The requirement is at least 20 MW and at least 10% of gross nameplate, so the larger value governs. Complete losses are a separate trigger. |
| "Applicability is 20 MVA, so the threshold is in MVA." | The applicability test for non-BES IBRs uses MVA; the R1 thresholds use MW. Document the MW basis of gross nameplate rating. |
| "Curtailment is excluded." | Not named in R1. The Technical Rationale treats curtailment as resource dispatch. Document that interpretation and keep the dispatch instruction. |
| "Our PRC-028 recorders will provide the data." | Existing BES IBRs have until 2028–2030 to install PRC-028-1 monitoring. Until then, many R1 processes rely on SCADA and plant controller data. Verify that they resolve a four-second change. |
| "A technical justification closes the matter." | It answers R3 only. It does not relieve PRC-029-1 ride-through obligations. |
| "Failing to notify the RC under R4 has no VSL, so it is low risk." | A missing VSL is not a missing obligation. Plan as if every part is enforceable. |
| "Failure to update a CAP is graded Lower." | The approved VSL table grades failure to update at the Moderate level and failure to implement at Severe. Check the current approved version. |
Part B — PRC-030-1 in Technical Depth: Identifying, Analyzing and Mitigating Unexpected IBR Events
1. Why PRC-030-1 exists
1.1 From disturbance reports to a mandatory standard
Between 2016 and 2023, NERC and the Regional Entities published a series of disturbance reports on events in which large amounts of solar PV, and later wind and battery storage, reduced output during ordinary transmission faults. The faults themselves were normally cleared in three to five cycles. The plants, however, responded in ways their owners and the grid operators did not expect:
inverters entered momentary cessation and recovered slowly;
inverters tripped on instantaneous AC overvoltage just after fault clearing;
phase-locked loops lost synchronism during phase jumps;
plant controllers ramped output back too slowly;
feeder protection on the collector system tripped on transient currents;
DC-side protection operated during the AC disturbance.
The pattern was consistent. Hundreds or thousands of megawatts of IBR output could disappear within seconds after a single fault on the 345 kV or 500 kV network. Many owners could not explain why, because the data needed to explain it had not been recorded.
1.2 FERC Order No. 901 and the IBR standards program
FERC Order No. 901 (October 19, 2023) directed NERC to develop standards on IBR data sharing, model validation, planning and operational studies, and performance requirements. NERC grouped the work into milestones. The first set of standards addressed three questions that build on each other:
| Question | Standard | Role |
|---|---|---|
| What must the plant do during a disturbance? | PRC-029-1 (with PRC-024-4 for synchronous and Type 1/Type 2 wind) | Frequency and voltage ride-through requirements |
| What data must be recorded? | PRC-028-1 (with PRC-002-5 for non-IBR BES elements) | Sequence-of-events, fault and dynamic disturbance recording at IBRs |
| What must the owner do when the plant does not perform as expected? | PRC-030-1 | Identification, analysis and mitigation of unexpected changes in output |
PRC-030-1 is the feedback loop. PRC-029-1 sets expectations, PRC-028-1 provides the evidence, and PRC-030-1 forces owners to compare the two and correct gaps.
1.3 The approval path and the effective date
The NERC Board of Trustees adopted PRC-030-1 in October 2024, and NERC filed it with FERC in November 2024. FERC approved PRC-030-1 — together with PRC-028-1, PRC-002-5 and the NERC Glossary definition of Inverter-Based Resource — on February 20, 2025. FERC approved PRC-029-1 and PRC-024-4 in Order No. 909 on July 24, 2025.
The PRC-030-1 Implementation Plan ties its effective date to both orders. The effective date is the later of:
the first day of the first calendar quarter that is twelve months after the effective date of the order approving PRC-030-1; and
the same calculation applied to the order approving PRC-029-1.
Worked example 1 — calculating the effective date
| Step | PRC-030-1 approval | PRC-029-1 approval |
|---|---|---|
| Order date | February 20, 2025 | July 24, 2025 |
| Twelve months later | February 20, 2026 | July 24, 2026 |
| First day of the next calendar quarter | April 1, 2026 | October 1, 2026 |
| Later of the two | October 1, 2026 | — |
BES IBRs comply on October 1, 2026. Applicable non-BES IBRs comply on the later of January 1, 2027 or the effective date, which is January 1, 2027.
The precise start point (order issuance date or the order's own effective date) can shift a quarter in some calculations. Here both readings give the same result, but owners should record the basis they use and confirm it with their Regional Entity.
2. Applicability
2.1 Functional entity
PRC-030-1 applies only to the Generator Owner (GO). The Generator Operator is deliberately excluded to avoid divided accountability. Reliability Coordinators (RCs), Balancing Authorities (BAs) and Transmission Operators (TOPs) carry no PRC-030-1 requirements of their own, but they are central to the standard. Their requests can start the R2 clock, all three receive R3 transmittals, and the RC receives R4 notifications.
2.2 Facilities
Two classes of facility are in scope:
BES IBRs — IBRs that meet the BES definition. For generation, that generally means individual units above 20 MVA, or dispersed plants with aggregate capacity above 75 MVA connected at 100 kV or above.
Non-BES IBRs that have or contribute to an aggregate nameplate capacity of at least 20 MVA, delivered through a system designed primarily for that purpose to a common point of connection at 60 kV or above.
The non-BES category mirrors NERC's revised registration criteria for "Category 2" Generator Owners and Generator Operators, with registration completed in May 2026.
Worked example 2 — applicability screen
| Site | Configuration | 20 MVA aggregate? | Common point ≥ 60 kV? | BES? | PRC-030-1 applies? |
|---|---|---|---|---|---|
| A | 50 MW solar, 13.8 kV collectors, step-up to 69 kV POI | Yes (55 MVA) | Yes (69 kV) | No (below 75 MVA) | Yes — non-BES IBR, from January 1, 2027 |
| B | 3 × 8 MVA BESS blocks sharing one 34.5 kV / 115 kV transformer | Yes (24 MVA) | Yes (115 kV) | No | Yes — non-BES IBR |
| C | Two 15 MW solar sites, each on a separate 34.5 kV distribution feeder | Each 16.5 MVA; not a common system | No (34.5 kV) | No | No |
| D | 300 MW solar, 34.5 kV collectors, 345 kV POI | Yes | Yes | Yes | Yes — BES IBR, from October 1, 2026 |
| E | 18 MVA solar adding 6 MVA BESS at the same 69 kV POI | Becomes 24 MVA | Yes | No | Becomes applicable when the BESS is energized |
Site E shows why applicability must be re-run whenever capacity, configuration or the point of interconnection changes. Build a trigger into the owner's management-of-change process.
2.3 Applicability is a facility question
Registration and facility applicability are separate determinations. An owner can be a registered GO and still have plants outside PRC-030-1. Document both: the registration status and a facility-by-facility memo with the single-line diagram, nameplate schedule, POI voltage and design intent.
3. R1 — Identifying qualifying changes in Real Power
3.1 What R1 requires
Each Generator Owner must implement a documented process to identify:
any complete facility loss of output; and
any change in Real Power output of at least 20 MW and at least 10% of the plant's gross nameplate rating, within a four-second period.
Four causes of change are excluded:
intermittent primary energy availability (wind speed, irradiance);
resource dispatch, ramping, planned outages or planned testing;
transmission or collection system losses that, by configuration, disconnect the IBR;
reductions caused solely by a Protection System Misoperation that is being analyzed and corrected under PRC-004.
3.2 The threshold function
Because both conditions must be met, the effective threshold is the larger of the two:

where P(GNR) is the gross nameplate rating in MW. The crossover occurs at:

| Gross nameplate rating | 10% of nameplate | Effective R1 threshold | Threshold as % of nameplate |
|---|---|---|---|
| 25 MW | 2.5 MW | 20 MW | 80% |
| 50 MW | 5 MW | 20 MW | 40% |
| 100 MW | 10 MW | 20 MW | 20% |
| 200 MW | 20 MW | 20 MW | 10% |
| 250 MW | 25 MW | 25 MW | 10% |
| 300 MW | 30 MW | 30 MW | 10% |
| 500 MW | 50 MW | 50 MW | 10% |
| 800 MW | 80 MW | 80 MW | 10% |
Two consequences follow. First, small plants rarely meet the percentage test unless a large share of the plant trips. A 25 MW plant would have to lose 80% of nameplate within four seconds. Second, complete losses are a separate trigger that applies regardless of size. A 25 MW plant that drops to zero must be identified even though 25 MW barely exceeds the threshold — and a 15 MW non-BES plant that drops to zero must be identified even though it could never meet the 20 MW test. Write the complete-loss test into the procedure as a separate check that runs first.
3.3 The nameplate basis: MW, MVA and DC
R1 states thresholds in MW. Plant nameplate data, however, often appears in three forms:
DC capacity of the PV array (MWp or MWdc), often 1.2 to 1.4 times the AC rating;
inverter apparent power (MVA);
AC real power capability (MWac), sometimes capped at the POI by the interconnection agreement.
DC capacity is not a meaningful basis for a Real Power output test. Between MVA and MW, Keentel recommends a documented MW basis derived from inverter ratings:

Worked example 3 — gross nameplate basis
A plant has 120 inverters rated 2.75 MVA, with a rated real power of 2.5 MW each at 0.91 power factor. The interconnection agreement limits injection to 300 MW at the POI.
| Basis | Value | R1 threshold |
|---|---|---|
| DC array (1.3 DC/AC) | about 390 MWdc | Not appropriate |
| Inverter apparent power, 120 × 2.75 MVA | 330 MVA | 33 MW if treated as MW |
| Inverter real power, 120 × 2.5 MW | 300 MW | 30 MW |
| POI injection limit | 300 MW | 30 MW |
The 30 MW threshold is both technically correct and the more conservative choice: a lower threshold identifies more events. Whatever basis is chosen, record it, the source documents and the date, and recompute the threshold when inverters are added, replaced or re-rated.
3.4 The four-second window — what "change" means mathematically
The standard does not define how a change within four seconds is computed. Two definitions are common, and they give different answers.
Endpoint difference. Compare the output at the end of the window with the output four seconds earlier:

Maximum decline within a sliding window. Find the largest drop from any earlier point to any later point inside the window:

D(t) always equals or exceeds ΔP(end). It captures a momentary dip that recovers within the window, while the endpoint difference does not.
In Keentel's 300 MW example (Figure 1), high-resolution data show a 215 MW momentary dip during the fault and an 80 MW sustained loss after it. Both definitions identify the event because the sustained loss alone exceeds 30 MW. But consider a plant that dips 60 MW for 0.8 s and fully recovers: D(t) reports 60 MW and ΔP(end) reports zero.
The Technical Rationale explains that the four-second window bounds the calculation of the change at event onset. It does not limit how long the event lasts — slow recovery belongs in the R2 analysis. It does not settle whether a fully recovered momentary dip is a "change in Real Power output." Keentel's recommendation:
compute D(t) wherever the data allow it, flag every exceedance, and record the classification;
state the adopted definition in the R1 procedure, with the reasoning;
recognize that momentary cessation and slow recovery are, in any case, ride-through performance matters under PRC-029-1 and are best captured now.
3.5 Scan rate: what the data can actually see
The Technical Rationale notes typical SCADA and historian scan periods of two to six seconds. It also suggests that where scans are four seconds or longer, the change over one scan be used. Scan rate matters for two reasons.
Short dips disappear. A sample every Ts seconds cannot see a dip shorter than Ts unless a sample happens to land inside it. With a 4 s scan, a 1 s momentary cessation is captured only about 25% of the time — and even then only partially, because a 1 s dip with a recovery ramp is rarely at its minimum when sampled.
Ramps are split. Suppose the drop takes d seconds — for example, a staggered inverter trip or a plant controller ramp. For the full drop to appear between samples that fit inside a four-second window, the drop must lie inside one span of sample points no longer than four seconds. If W is the largest multiple of Ts not exceeding 4 s, the probability that the whole ramp is captured is:

Worked example 4 — probability of capturing a 3 s, 35 MW ramp at a 300 MW plant
| Scan period Ts | Window span W | Probability the full 35 MW appears in one 4 s span | Typical outcome when split |
|---|---|---|---|
| 4 s | 4 s | (4 − 3)/4 = 25% | Two differences of, say, 23 MW and 12 MW — neither reaches 30 MW |
| 2 s | 4 s | (4 − 3)/2 = 50% | Two-sample span may show only 20–30 MW |
| 1 s | 4 s | (4 − 3)/1 → 100% | Always captured |
| 0.1 s (PMU/DDR) | 4 s | 100% | Always captured, with dip shape |
With a 4 s historian, three events out of four of this kind would be missed by a strict one-scan endpoint test. Two practical defenses follow.
Use the best data you have. Plant controller logs at 100 ms to 1 s, POI revenue meters with interval data, phasor measurement units, and digital fault recorders are often available even before PRC-028-1 equipment is installed.
Screen generously, confirm precisely. Flag any decline above, for example, 0.7 × ΔP(th) across two consecutive scans (eight seconds) as a candidate, then confirm against higher-resolution data. Document the screen and its validation.
3.6 Data sources for R1 — a comparison
| Source | Typical resolution | Time sync | Strengths | Weaknesses |
|---|---|---|---|---|
| Utility or RTO SCADA (EMS) | 2–6 s | EMS clock | Independent of the owner; widely retained | Coarse; may be compressed; owner may need to request it |
| Owner SCADA historian | 1–5 s, often with deadband compression | Historian server clock | Readily available | Compression and deadband can flatten a step |
| Power plant controller (PPC) logs | 50 ms–1 s | PPC clock, sometimes unsynchronized | Shows commands and responses | Short rolling buffers |
| POI revenue meter | 1 s to 15 min intervals; event capture in some models | GPS on newer meters | Accurate, at the point of measurement | Interval data too coarse unless configured |
| PMU / DDR (PRC-028-1 R4–R5) | ≥ 60 records/s | ±1 ms of UTC | Ideal for the four-second test | Not required at existing BES IBRs until 2028–2030 |
| Digital fault recorder / relay records (PRC-028-1 R2–R3) | ≥ 64 samples/cycle | ±1 ms | Shows fault-time behavior | Triggered; short records (≥ 2 s) |
| Inverter event logs (PRC-028-1 R1 SER) | ms time tags | ±100 ms of UTC for IBR units | Fault codes, trip causes | Proprietary formats; limited buffers |
Important transition point. PRC-028-1 phases in disturbance monitoring at existing BES IBRs, with 50% compliance within three calendar years of April 1, 2025 and 100% by January 1, 2030. Many owners therefore must operate R1 today on historian and plant controller data. Characterize the resolution, compression and time accuracy of each source now, and record the limits in the R1 procedure.
3.7 Data-quality screening before threshold testing
False triggers are common, and they consume engineering time. The usual causes are:
telemetry dropouts that report zero or hold a stale value;
controller resets that briefly report zero output;
historian compression that turns a ramp into a step;
clock offsets between systems, which misalign POI and plant data;
calculation tags (for example, summed feeder MW) that fail when one input goes bad.
A robust R1 process applies a data-quality screen first:
check quality flags and communications status for each sample;
compare plant MW against an independent source (POI meter or utility SCADA) during the candidate window;
reject candidates where independent data show no real change, and record why;
retain the rejected candidates and the evidence.
An undocumented screen looks to an auditor like an unrecorded exclusion. The screen is part of the R1 process and must be written down.
3.8 Applying the exclusions with evidence
| Exclusion | Typical evidence | Common trap |
|---|---|---|
| Intermittent primary energy (irradiance, wind) | Irradiance from multiple plant pyranometers, met-mast wind speed, sky camera; consistency of change with the resource | Cloud fronts rarely produce a 10% drop within four seconds at a large plant; a drop that fast should be checked for an electrical cause |
| Dispatch, ramping, planned outage or testing | Dispatch instruction or AGC signal with time stamp; outage ticket; test plan | Curtailment is not named; rely on the Technical Rationale's treatment of curtailment as dispatch and record the instruction |
| Transmission or collection system loss that disconnects the IBR by configuration | Breaker operations, protection records, one-line showing radial connection | A collector feeder trip caused by inverter behavior is not "by configuration" — the root cause is the inverter |
| Protection System Misoperation solely responsible, analyzed under PRC-004 | PRC-004 misoperation record and Corrective Action Plan reference | If any part of the reduction was not caused by the misoperation, the exclusion does not apply in full |
Where more than one cause is present — for example, a plant under curtailment that also loses inverters during a fault — record each cause and state which one governed the change. A change caused by an inverter trip during curtailment is not automatically excluded.
3.9 A defensible R1 algorithm
A documented R1 process, in Keentel's experience, has these elements:
| Element | Content |
|---|---|
| Scope | Facilities covered, with applicability memo references |
| Nameplate basis | P(GNR) per facility, source documents, date |
| Thresholds | ΔP(th) per facility; complete-loss rule |
| Data sources | Primary and secondary sources, resolution, compression settings, clock source and accuracy |
| Calculation | Definition of change (D(t) or endpoint), window handling for scans of 4 s or longer |
| Quality screen | Flags, independent cross-check, rejection rules |
| Exclusions | Rules, required evidence, approver |
| Logging | Event register fields, review frequency, escalation |
| Testing | Back-test against known events; periodic synthetic tests |
| Retention | Raw and derived data, export metadata, legal holds |
The process should run automatically where possible, but a daily or weekly human review of candidate events is essential. The review record is evidence that the process was implemented — the core of measure M1.
Worked example 5 — back-testing the R1 process
Before October 1, 2026, a GO with five plants back-tested its R1 algorithm on twelve months of historian data. The raw threshold test flagged 61 candidates. The data-quality screen rejected 44 (telemetry dropouts and controller resets confirmed by the POI meter). Exclusion review classified 11 as dispatch or curtailment and 2 as irradiance. Four remained as qualifying events. Two of the four had been known; two had not. The back-test proved the process could detect events and gave the GO four real events to practice analysis on before the standard took effect.
4. R2 — Analyzing performance within 90 days
4.1 What R2 requires
Within 90 calendar days of an event identified under R1, or of a request from an RC, BA or TOP that identifies a disturbance and a change in IBR Real Power output, the GO must analyze the facility's performance and:
| Part | Content |
|---|---|
| 2.1.1 | Determine the root cause or causes of the change in Real Power output |
| 2.1.2 | Document the facility's ride-through performance, including its Reactive Power response |
| 2.1.3 | Assess any performance issues identified and determine whether corrective actions are needed |
| 2.1.4 | Determine whether the root cause applies to the GO's other IBR facilities |
| 2.2 | Provide the analysis results to the requesting entity, upon request |
For an RC, BA or TOP request, the clock runs from receipt. Log the date and time of receipt, the sender, the channel and the scope. If the request is unclear, confirm scope in writing immediately — do not let an ambiguous request consume the 90 days.
4.2 Building the event timeline
Every defensible analysis begins with a synchronized timeline. Collect:
POI voltage, current, P, Q and frequency (relay, DFR, PMU or meter);
plant controller set points, measurements, mode changes and commands;
inverter event logs and fault codes — per unit;
collector feeder and main power transformer protection records;
BESS battery management and power conversion system logs (for storage);
utility protection records and the fault location, type and clearing time;
operator actions, dispatch and AGC signals in the window;
weather data (irradiance, wind) for the exclusion check.
Align all records to UTC. Measure the offset of each source against a known common event — typically the fault inception seen in both the POI relay and the inverter log — and record the correction applied. A 300 ms clock offset between a PPC log and the POI relay can make cause look like effect.
4.3 Root-cause method (Part 2.1.1)
A structured approach — fault tree, "5 whys," or cause-and-effect diagram — keeps the analysis complete. Keentel organizes IBR root causes into six branches:
| Branch | Typical mechanisms | Key evidence |
|---|---|---|
| Inverter protection | AC over- and undervoltage, over- and underfrequency, rate-of-change-of-frequency, instantaneous peak overvoltage, DC overvoltage, overcurrent | Inverter fault codes, settings files, firmware version |
| Inverter controls | PLL loss of synchronism on phase jump, momentary cessation, slow current recovery, negative-sequence control limits | Inverter logs, high-resolution POI waveforms |
| Plant controller | Slow ramp-back, incorrect mode change, frequency response logic, communication loss to inverters | PPC logs, set point records |
| Collector system and plant protection | Feeder overcurrent or ground-fault trips, transformer protection, capacitor bank switching | Relay event reports, SER |
| Auxiliary and DC systems | Auxiliary supply loss, tracker or HVAC trips, DC arc-fault detection, battery management system trips | Auxiliary relay logs, BMS data |
| System conditions | Fault severity, phase angle jump, voltage unbalance, weak-grid conditions (low short-circuit ratio) | Utility fault records, system model |
For each hypothesis, record the evidence for and against it, the tests run and the conclusion. When the root cause cannot be determined, the analysis must still show the work: the hypotheses tested, the data reviewed, the manufacturer engagement and the data gaps. Open items should become data-capture actions.
4.4 Ride-through and Reactive Power documentation (Part 2.1.2)
Part 2.1.2 requires documentation of how the plant rode through the event and how it supported voltage. For a typical voltage disturbance, document:
the voltage profile at the POI and, if available, at inverter terminals (magnitude, duration, phase angle jump);
whether each inverter stayed connected, entered momentary cessation, or tripped;
active and reactive current during the disturbance and recovery;
time to recover to pre-disturbance active power (or to available power);
comparison with the applicable ride-through requirement — PRC-029-1 for IBRs, plus any interconnection requirements (for example, those based on IEEE 2800-2022).
A useful measure of dynamic reactive response is the incremental reactive current injected per unit of voltage deviation:

where the gain K is typically 2 to 6 per unit in grid-code practice. In Keentel's 300 MW example, POI voltage falls from 1.00 to 0.45 pu. With K = 2, the expected reactive current injection is:

In practice, injection is limited to about 1.0 pu by the inverter current rating.
Legacy inverters configured for momentary cessation inject close to zero current instead. Part 2.1.2 asks the GO to document what actually happened, not what the settings were supposed to produce.
4.5 Deciding whether there is a performance issue (Part 2.1.3)
The standard does not define "performance issue." Define it in the procedure before you need it. Keentel recommends a three-way comparison:
| Reference | Question |
|---|---|
| Design expectation | Did the plant respond as its controls and settings were designed to? |
| Requirement | Did the response meet PRC-029-1, the interconnection agreement and applicable interconnection requirements? |
| Reliability consequence | How much output was lost, for how long, with what reactive support, and could it recur at this or other plants? |
The Part 2.1.3 record should state the expectation used, the observed behavior, the difference, and why that difference does or does not justify corrective action. "No corrective action needed" is a conclusion that requires reasoning, not the absence of reasoning.
4.6 Extent of condition across the fleet (Part 2.1.4)
Part 2.1.4 asks whether the root cause applies to the GO's other IBR facilities. Treat it as an engineering extent-of-condition review.
| Attribute | Why it matters |
|---|---|
| Inverter manufacturer, model and hardware revision | Same protection and control architecture |
| Firmware version | Settings defaults and protection logic change with firmware |
| Protection settings (AC OV/UV, frequency, ROCOF, PLL) | Settings drive most trips |
| Plant controller model and configuration | Recovery and mode logic |
| Collector design and grounding | Overvoltage on fault clearing depends on grounding and capacitance |
| Interconnection strength (short-circuit ratio) | Weak-grid sites are more exposed to PLL and voltage-control problems |
Record the facilities reviewed, the criteria, the method and a conclusion for each facility.
5. Worked example — a complete R2 analysis for a 300 MW plant
5.1 The event
On November 2, 2026, a phase-to-ground fault on a 345 kV line 40 miles from a 300 MW solar plant is cleared in four cycles (67 ms). The plant is producing 240 MW. POI voltage falls to 0.45 pu. On clearing, voltage briefly reaches 1.17 pu for about 60 ms before settling. Plant output drops to about 25 MW during the fault, recovers to 160 MW within one second, and stays there until tripped inverters auto-restart after five minutes.
5.2 R1 identification

The sustained change is 240 − 160 = 80 MW, well above 30 MW, and occurs within four seconds. No exclusion applies: irradiance was steady, no dispatch change occurred, the plant remained connected through its 345 kV line, and no Protection System Misoperation was involved. The event is logged as a qualifying R1 event on November 2, 2026.
5.3 Quantifying the trip
With 120 inverters sharing 240 MW, each produces 2.0 MW. Inverter logs show 40 units tripped:

The calculation matches the measured POI change, confirming that the inverter trips explain the full sustained loss. Energy lost before restart:

5.4 Root cause
| Hypothesis | Evidence | Conclusion |
|---|---|---|
| PLL loss of synchronism | Phase angle jump at POI only 9°; no PLL fault codes | Rejected |
| AC undervoltage trip during fault | Undervoltage codes absent; all 120 units entered momentary cessation and resumed | Rejected for the trip; momentary cessation noted under Part 2.1.2 |
| Instantaneous AC overvoltage on fault clearing | All 40 tripped units logged "AC overvoltage – fast" within 2 ms of clearing; setting 1.15 pu on peak, 1 ms; the 40 units are at the far ends of the longest collector feeders | Root cause |
| Contributing: reactive current not removed after clearing | Inverters were injecting reactive current at clearing; ramp-down took about 40 ms | Contributing cause |
| Contributing: switched capacitor bank in service | 30 Mvar bank in service; adds voltage rise on clearing | Contributing |
Why only 40 of 120? The tripped inverters sit at the electrical ends of two long 34.5 kV collector feeders, where terminal voltage on clearing was several percent higher than at the POI. The higher terminal voltage, combined with continuing reactive current injection, exceeded the 1.15 pu peak-detected instantaneous setting.
5.5 Ride-through documentation (Part 2.1.2)
During the fault: all 120 inverters entered momentary cessation below 0.9 pu, injecting near-zero current. Reactive support during the fault was therefore negligible.
Recovery: the 80 remaining inverters recovered to pre-fault active power in about 1 s.
Post-clearing overvoltage: the 1.17 pu excursion lasted about 60 ms. Typical high-voltage ride-through requirements for IBRs (IEEE 2800-2022 and PRC-029-1) require continuous operation through excursions of this magnitude and duration. The trips are therefore inconsistent with current ride-through expectations. Confirm against the exact PRC-029-1 table and any exemption filed for the plant.
5.6 Performance issue decision (Part 2.1.3)
Performance issue: yes. Eighty MW was lost for a normally cleared fault, and the plant provided negligible reactive support during the fault. The behavior can recur on any similar fault. Corrective action is needed for the overvoltage trips; momentary cessation is assessed for change subject to the inverter's capability and the PRC-029-1 exemption status.
5.7 Extent of condition (Part 2.1.4)
| Facility | Inverter model / firmware | OV fast setting | Collector design | Applies? |
|---|---|---|---|---|
| Plant 1 (event plant), 300 MW, 345 kV | Model X / v3.2 | 1.15 pu peak, 1 ms | Long 34.5 kV feeders | Yes |
| Plant 2, 150 MW, 138 kV | Model X / v3.2 | 1.15 pu peak, 1 ms | Short feeders | Yes — same setting; lower exposure |
| Plant 3, 200 MW, 230 kV | Model X / v4.0 | 1.25 pu RMS, 1 cycle | Long feeders | No — newer firmware uses RMS detection |
| Plant 4, 100 MW BESS, 115 kV | Model Y | Ride-through compliant | Short feeders | No |
| Plant 5, 60 MW, 69 kV (non-BES) | Model X / v3.1 | 1.15 pu peak, 1 ms | Medium feeders | Yes |
The CAP will therefore cover Plants 1, 2 and 5.
5.8 Compliance dates
| Milestone | Day count | Date |
|---|---|---|
| Event (R1 identification) | Day 0 | November 2, 2026 |
| R2 analysis due | Day 90 | January 31, 2027 |
| R2 analysis completed and dated | Day 75 | January 16, 2027 |
| R3 CAP due to RC, BA and TOP | Day 75 + 60 | March 17, 2027 |
| R2 Lower VSL band begins | after Day 90 | February 1, 2027 |
| R2 Severe VSL threshold | Day 180 | May 1, 2027 |

Note that completing R2 early also pulls the R3 deadline earlier. Some owners deliberately date the analysis only when the Part 2.1.3 decision is final; that is acceptable if the dating is honest and the final analysis is within 90 days.
6. R3 — Corrective Action Plan or technical justification
6.1 What R3 requires
When the R2 analysis identifies performance issues and a need for corrective action under Part 2.1.3, the GO must, within 60 calendar days of completing the analysis:
develop a CAP for the identified IBRs and, where applicable, the other facilities identified in the R2 analysis; or
develop a technical justification explaining why corrective actions will not be implemented; and
provide the CAP or technical justification to the associated RC, BA and TOP.
The NERC Glossary defines a Corrective Action Plan as a list of actions and an associated timetable for implementation to remedy a specific problem.
6.2 What a good CAP contains
| Element | Example for the 300 MW event |
|---|---|
| Problem statement | 40 inverters tripped on instantaneous AC overvoltage on fault clearing |
| Root and contributing causes | 1.15 pu peak, 1 ms setting; reactive current ramp-down; capacitor bank |
| Actions | (1) Manufacturer-approved change to RMS-based OV detection, 1.20 pu, with time delay consistent with the ride-through curve; (2) faster reactive current ramp-down after clearing; (3) capacitor bank switching logic review; (4) firmware upgrade to v4.0 where supported |
| Facilities | Plants 1, 2 and 5 |
| Timetable | Settings change within 90 days; firmware within 9 months, subject to outage windows |
| Verification | Post-change EMT model check; review of the next disturbance records |
| Owner and approver | Named individuals |
| Revision triggers | Manufacturer findings; outage schedule changes |
Settings changes to an IBR may also trigger a PRC-019-2 coordination review, a MOD-026 or MOD-032 model update, and notification to the Transmission Planner. Plan those actions in the CAP.
6.3 Technical justification
A technical justification explains why corrective actions will not be implemented. The Technical Rationale expects an acceptable justification primarily to show two characteristics:
the corrective action would rest on IBR performance requirements that extend beyond those in place when the facility was interconnected; and
implementing the action would require significant material modifications or a qualified change.
The standard does not say whether both are required. Build every justification around both, quantify the modification (cost, outage, hardware replacement), and cite the interconnection requirements in force at interconnection. A technical justification does not relieve PRC-029-1 obligations or any other standard.
Worked example 6 — CAP or technical justification?
| Issue | Possible correction | CAP or justification? |
|---|---|---|
| Instantaneous OV setting too sensitive | Settings change within inverter capability | CAP — modest change, within capability |
| Momentary cessation on legacy inverters | Hardware replacement required to inject current during faults | Possibly technical justification, if the inverters predate current requirements and replacement is a significant material modification — and consistent with any PRC-029-1 exemption filed |
| PLL instability at a weak-grid site | Controller retune with manufacturer, or synchronous condenser | CAP for retune; justification only if the only fix is major equipment |
6.4 Transmittal to all three entities
R3 is conjunctive: the RC and the BA and the TOP. M3 requires evidence of transmittal. Keep a register with one row per recipient per document: contact, method, date and time sent, acknowledgment. A missing transmittal to any one of the three places the GO at the High VSL level.
7. R4 — Implementing and maintaining the CAP
R4 requires the GO to implement each CAP, update it when actions or timetables change, and notify each associated RC when actions or timetables change and when the CAP is complete. There are no fixed deadlines for updates or notifications, so set internal standards — for example, update the CAP register within five business days of a change and notify the RC within ten business days. Auditors will measure performance against your own standard.
Good CAP governance has four parts:
| Part | Content |
|---|---|
| CAP register | Each CAP, its version, owner, timetable and status |
| Change control | Every change with its reason, approver, date and timetable effect |
| Notification log | Each RC notice, date, content and delivery method |
| Closure evidence | Work orders, settings files, test records, and the RC completion notice |
The Technical Rationale emphasizes completing CAPs as quickly as possible, because the RC may need to impose operating restrictions on the plant until the work is done.
8. Measures, evidence retention and violation severity
8.1 Measures
| Measure | Evidence expected |
|---|---|
| M1 | Documented R1 process; evidence of implementation; actual data recordings; identification of gross nameplate rating |
| M2 | Dated analysis documentation: reports, data recordings or derivations, device specifications, configuration and settings, plant configuration |
| M3 | Dated CAP or technical justification and evidence of transmittal to RC, BA and TOP |
| M4 | Dated CAPs, project and work records, settings sheets, work orders, maintenance records, manufacturer and RC communications |
8.2 Retention
Section C.1.2 sets 36 calendar months for most evidence:
R1, R2, M1, M2: 36 months after completion of each requirement;
R3, M3: at least 36 months after completion of each CAP, evaluation or declaration;
R4, M4: at least 36 months after completion of each CAP.
Because R1 is continuous, set retention as policy: keep R1 data and event records for at least the full audit period plus 36 months, and analysis and CAP records for the life of the CAP plus 36 months. Check that historian retention at full resolution is long enough — many historians downsample after 30 to 90 days. Export event windows before they age out.
8.3 Violation severity levels — summary
| Requirement | Lower | Moderate | High | Severe |
|---|---|---|---|---|
| R1 | — | — | — | Failed to implement a documented process |
| R2 | More than 90 and less than 120 days | 120 to less than 150 days | 150 to less than 180 days; or failed to address Part 2.1.1 or 2.1.4; or failed to provide results under Part 2.2 | 180 days or more; or failed to address multiple parts, including ride-through documentation |
| R3 | More than 60 and up to 90 days | More than 90 and up to 120 days | More than 120 and up to 150 days; or CAP omitted other identified facilities; or not provided to all of RC, BA and TOP | Not developed within 150 days |
| R4 | — | Implemented but not updated when actions or timetables changed | — | Failed to implement the CAP |
Read the approved VSL table directly for the exact wording. Note what is not graded — for example, failure to notify the RC under R4. A missing grade is not a missing obligation.
9. Building one data architecture for PRC-028, PRC-029 and PRC-030
The three IBR standards share data. A single architecture, designed once, serves all three:
| Layer | PRC-028-1 requirement | Use in PRC-030-1 |
|---|---|---|
| Sequence of events (SER) | Breaker status and IBR unit fault codes, alarms and ride-through mode status | Trip causes and timing (Part 2.1.1) |
| Fault recording (FR) | ≥ 64 samples/cycle, ≥ 2 cycles pre-trigger, ≥ 2 s records at MPT high side, collector feeders, dynamic reactive devices | Fault and clearing behavior; overvoltage on clearing |
| Dynamic disturbance recording (DDR) | ≥ 960 samples/s input; ≥ 60 records/s output at each MPT | The four-second R1 test; recovery and reactive response (Part 2.1.2) |
| Time synchronization | ±1 ms of UTC for plant devices; ±100 ms for IBR unit clocks | Synchronized timeline |
| Data retention | Retrievable for 20 calendar days; provided within 15 calendar days of request | Export event windows immediately — 20 days is far shorter than the 90-day R2 window |
The last row deserves emphasis. PRC-028-1 requires recorded data to be retrievable for only 20 calendar days. An R2 analysis takes up to 90 days. If the R1 process does not trigger an immediate export and legal hold, the most important evidence can be overwritten before the analysis begins.
10. Audit readiness
10.1 Evidence map
| Requirement | Evidence | Owner | Status check |
|---|---|---|---|
| R1 / M1 | Procedure with version history; event register; review records; nameplate basis; data source register | Compliance lead | Every candidate has a decision |
| R2 / M2 | Dated, versioned analysis; timeline; data exports with metadata; Part 2.1.3 decision; Part 2.1.4 fleet table | Engineering lead | Within 90 days of each event or request |
| R2 Part 2.2 | Request log with receipt time; transmittal of results | Compliance lead | Every request answered |
| R3 / M3 | CAP or technical justification; transmittal register for RC, BA, TOP | Compliance lead | All three recipients confirmed |
| R4 / M4 | CAP register, change log, RC notifications, closure evidence | CAP owner | Notices within internal standard |
10.2 The "no events" answer
The Reliability Standard Audit Worksheet asks whether a qualifying event occurred. A "No" is a claim that needs evidence: the R1 process ran for the whole period, the data were available and valid, and the screen produced no qualifying candidates. Keep a coverage record that shows data gaps and how they were handled. An empty event log alone is weak evidence, because it can also mean missing data.
10.3 Mock audit
Run a mock audit at least once a year. Use a realistic scenario — for example, the 300 MW event above — and walk the team through detection, data export, classification, analysis, the Part 2.1.3 decision, R3 and transmittals, and R4 notifications. Time each retrieval. Ask someone who did not build the program to find evidence using only the evidence map.
10.4 Common findings
transmittals to one or two of the three required recipients;
exclusions recorded as labels without reasoning or approver;
thresholds calculated on the wrong nameplate basis (MVA or MWdc);
analyses without dates or with indistinguishable versions;
screenshots of trends with no source, time zone or export date;
CAP changes without reason, approver or timetable effect;
RC notifications missing or undocumented;
unexplained data gaps;
narratives that describe a process the records do not show.
11. Common misconceptions corrected
| Misconception | Correction |
|---|---|
| "A plant under 200 MW only needs to watch for 10% changes." | Below 200 MW, the 20 MW test governs, and complete losses are identified regardless of size. |
| "SCADA at 4 s is enough." | It may meet the letter of the Technical Rationale's guidance but can miss dips and split ramps. Use the best available data and document limitations. |
| "R2 runs from when we noticed the event." | It runs from the event (R1) or from receipt of the request (RC, BA or TOP). |
| "One investigation, one deadline." | Each event has its own clock; the earliest event sets the deadline. |
| "A CAP is only for the plant that tripped." | It covers other facilities identified through Part 2.1.4. |
| "Sending the CAP to the RC is enough." | R3 requires the RC, BA and TOP. |
| "Once the CAP is filed, R4 is paperwork." | R4 requires implementation, updates and RC notification through completion. |
12. Key takeaways
PRC-030-1 is in effect for BES IBRs from October 1, 2026, and for applicable non-BES IBRs from January 1, 2027.
Know your threshold: max(20 MW, 10% of gross nameplate), plus any complete loss.
Characterize your data: resolution, compression, time sync and retention.
Screen, then classify: data quality first, exclusions with evidence second.
Track clocks per event: 90 days for analysis, then 60 days for a CAP or justification.
Think fleet: Part 2.1.4 turns one plant's problem into a portfolio review.
Send to all three: RC, BA and TOP.
Close the loop: implement, update, notify, prove completion.
13. How Keentel Engineering helps
Keentel Engineering supports generation owners, IBR developers and operators with the engineering and compliance work behind PRC-030-1 and the wider NERC IBR standards, from 34.5 kV collector systems to 115 kV, 230 kV, 345 kV and 500 kV interconnections.
| Service | Keentel scope | Outcome |
|---|---|---|
| Applicability assessment | Facility-by-facility determinations for PRC-028-1, PRC-029-1 and PRC-030-1, with change triggers | Clear, documented scope |
| R1 process design | Nameplate basis, threshold logic, four-second algorithm, data-quality screens, exclusion rules, back-testing | A detection process that works and is defensible |
| Data architecture | SER, FR and DDR design to PRC-028-1; time synchronization; historian configuration; automatic event export | Data that supports PRC-028, PRC-029 and PRC-030 together |
| Event analysis | Root-cause analysis, ride-through and reactive power documentation, Part 2.1.3 decisions, fleet extent-of-condition reviews | R2 analyses completed within 90 days |
| Corrective action engineering | Inverter and plant controller settings, EMT (PSCAD) and PSS®E studies, CAP development, technical justifications | Practical fixes, verified by models |
| CAP governance | CAP register, change control, RC notifications, transmittal registers | Clean R3 and R4 evidence |
| Audit readiness | Gap assessments against the RSAW, evidence maps, narratives, mock audits, SME preparation | Confident audits |
| Training | Practical sessions for engineers, operators and compliance staff | Teams who own the process |
Why clients choose Keentel Engineering
Engineering and compliance under one roof: the people who analyze the event also understand the standard.
Deep IBR expertise: inverter and plant controller behavior, ride-through, weak-grid stability and EMT modeling.
Data-first approach: detection processes and analyses built on measurement, not assumption.
Audit-ready deliverables: dated, versioned and cross-referenced to the RSAW.
Licensed professional engineering: a Florida-registered firm with offices in Tampa, Austin, Sacramento and Baltimore, supporting projects nationwide.
Need to stand up or test your PRC-030-1 program, or analyze an IBR event before the 90-day clock runs out? Talk to Keentel Engineering at (813) 389-7871, contact@keentelengineering.com, or book a 15-minute scoping call at calendly.com/keentel-engineering/15min.
Part C — Case Studies
The following are illustrative composite scenarios based on conditions typical of US IBR projects. They show how Keentel Engineering approaches PRC-030-1 work; site details are generalized and figures are rounded.
Case Study 1 — The R1 process that cried wolf
Situation. A Generator Owner with four BES solar plants (150 MW to 250 MW, interconnected at 138 kV and 230 kV) implemented an R1 process in the summer of 2026 using its SCADA historian. In the first three weeks after October 1, the process flagged 23 candidate events. Engineers began full R2 analyses on each, and the backlog threatened the 90-day clocks.
Analysis. Keentel reviewed the candidates against POI revenue meter data and utility EMS data. Nineteen were telemetry artifacts: communications dropouts recorded as zero output, controller restarts, and historian compression that converted a gradual cloud-driven ramp into an apparent step. Of the remaining four, two were curtailment instructions and one was a fast irradiance drop. Only one was a real, unexcluded change: a 34 MW loss at a 250 MW plant (threshold 25 MW) caused by a collector feeder trip. Keentel also found that the historian's 5 s scan, with a 2 MW deadband, would miss most ramps shorter than about 4 s.
Engineered solution. Keentel redesigned the R1 process with a data-quality screen (quality flags, POI meter cross-check, clock-offset correction), a two-scan candidate screen at 70% of threshold, confirmation against 1 s plant controller data, and documented exclusion evidence. The historian was reconfigured to 1 s scans with compression disabled on POI MW tags, and event windows are now exported automatically.
Outcome. Candidate volume fell by about 80%, and every remaining candidate was real or carried a documented exclusion. The single qualifying event was analyzed and closed within 60 days, and the R1 procedure, back-test results and screen configuration now form the core of the owner's M1 evidence.
Case Study 2 — One trip, three plants
Situation. A 200 MW solar plant interconnected at 345 kV lost 48 MW (threshold 20 MW) when a nearby line fault was cleared. The owner's initial view was that the event was caused by the transmission fault and that no corrective action was needed.
Analysis. Keentel built a synchronized timeline from the POI relay, plant controller and inverter logs. A 160 ms clock offset in the controller log was corrected using fault inception as the common reference. All tripped inverters logged a fast AC overvoltage code within milliseconds of clearing, and all were on the two longest 34.5 kV feeders. An EMT model of the collector system reproduced terminal voltages of about 1.19 pu at the feeder ends versus 1.12 pu at the POI, driven by continuing reactive current injection after clearing. The extent-of-condition review under Part 2.1.4 found the same inverter firmware and setting at two other plants in the fleet, one of them a non-BES 60 MW plant at 69 kV.
Engineered solution. Keentel worked with the inverter manufacturer to replace peak-detected instantaneous overvoltage tripping with an RMS-based characteristic coordinated with the applicable ride-through curve, and to speed up reactive current ramp-down after voltage recovery. The CAP covered all three plants, with settings changes validated in the EMT model before field deployment. PRC-019-2 coordination and model data updates were scheduled as CAP actions.
Outcome. The CAP was transmitted to the RC, BA and TOP within 30 days of analysis completion. Settings changes were completed at all three plants within four months. During a later fault of similar severity, the event plant rode through with no inverter trips and recovered to pre-fault output within about 1 s.
Case Study 3 — A request from the Reliability Coordinator
Situation. Following a regional frequency disturbance, the Reliability Coordinator sent a request to a wind and battery hybrid owner (150 MW wind, 50 MW BESS, interconnected at 230 kV), identifying a 25 MW reduction at the plant. The change exceeded the plant's 20 MW threshold (max of 20 MW and 10% of a 200 MW gross nameplate rating), but the owner's R1 process had not flagged it: the historian's 4 s data split the 3-second change into two steps of about 15 MW and 10 MW.
Analysis. Keentel started the 90-day clock from the date and time the request was received and confirmed its scope in writing within two business days. High-resolution BESS power conversion system data showed that the battery's frequency response logic, after an incorrect mode transition, reduced discharge by 25 MW over about 3 s. Wind output was unaffected. The root cause was a plant controller mode-change sequence that mistakenly applied a ramp-rate limit during frequency response. The extent-of-condition review covered two other BESS sites with the same controller platform.
Engineered solution. The controller logic was corrected and tested on a hardware-in-the-loop platform. The R1 process was updated: the nameplate basis was confirmed at 200 MW (threshold 20 MW), the historian was moved to 1 s scans, and a two-scan screen was added. Keentel prepared the Part 2.2 response, the CAP, and a transmittal register covering the RC, BA and TOP.
Outcome. The analysis was provided to the RC on day 68. The CAP was completed within 90 days of transmittal, with RC notifications at each timetable change and on completion. The owner's revised R1 process has since identified two smaller events on its own, before any external request.